Renovated Duplex with Live-Work
For Sale
$895,000
8 S 7th Street, Wilmington, NC 28401
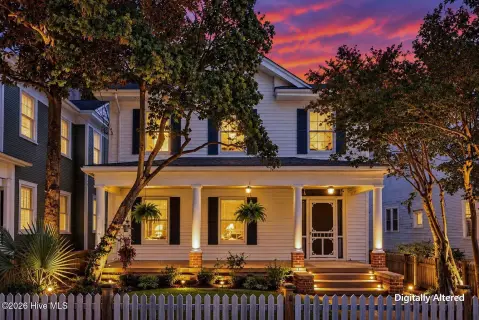
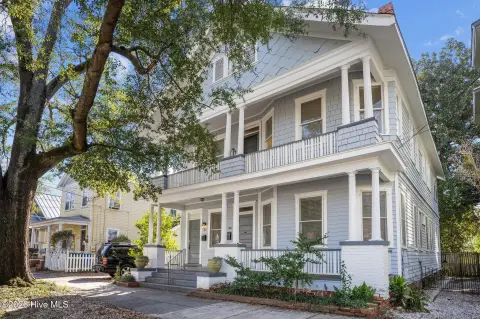
Historic property with residential and commercial zoning, updated interiors, and a flexible layout for living or business use.
Property Size3,166 SF
Price / SF$282.69
Days on Market423
Property Features for 8 S 7th Street
General Information
Standard status
Active
Size
3,166 SF
Property subtype
Multi-Family
Zoning
HD
Taxes and HOA fees
Annual Taxes
$2,711
Amenities
Unfinished
Tile,Wood
Dining Area
No
Yes
4
Electric
Unfurnished
2
Floored - Partial,Permanent Stairs
6
Laundry Closet
High Ceilings,Ceiling Fan(s)
Public
See Remarks
0.06
Street Parking Only
0.0
42 x 66
Wood Siding
On Street
Paved
Basement
City Street,State Road,Paved
3166.0
Building Details
Year Built
1918
Buildings
1
Stories
2
Listing Agency:
Keller Williams Coastal Area P
(912) 233-6000
Listed By:
Jane Howard
(912) 667-3872
Source:
Baystreetrealtygroup
Added: Aug 19, 2025
Changed: Oct 13
Last Checked: Oct 14 at 9:11PM
Displayed information is deemed reliable but is not guaranteed and should be independently verified. All listing content including descriptions, pricing, images are the copyrighted material of Keller Williams Coastal Area P
Investment Insights
Based on property information with market context.
This 3,166-square-foot duplex, built in 1918, combines a historic structure with extensive renovations and adaptable interior planning. The residential configuration includes three bedrooms and two updated bathrooms. Its commercial arrangement can accommodate private offices, meeting rooms, a break area, and two restrooms, supporting a range of residential, office, gallery, or financial-service uses identified for the property.
The building is located at 8 S 7th St in Wilmington’s Historic Downtown, within walking distance of the Soda Pop District and Castle Street Arts District. Residential and commercial zoning allows the property to serve as a duplex, business location, or combined live-work setting. The two-unit layout also supports separate occupancy or rental arrangements, subject to applicable requirements.
The building is located at 8 S 7th St in Wilmington’s Historic Downtown, within walking distance of the Soda Pop District and Castle Street Arts District. Residential and commercial zoning allows the property to serve as a duplex, business location, or combined live-work setting. The two-unit layout also supports separate occupancy or rental arrangements, subject to applicable requirements.
Key Highlights
- 3,166‑square‑foot duplex at 8 S 7th St, Wilmington, NC 28401
- Built in 1918 with extensive interior renovations
- Three bedrooms and two updated bathrooms
Financial Insights
Estimated NOI and Cap Rate
NOI / Yr
$40,209
Cap Rate
4.49%
Suggested Prices Based on Cap Rates
Cap Rate 5%
$804,180
$804.2K
Cap Rate 7%
$574,414
$574.4K
Cap Rate 9%
$446,767
$446.8K
Market Conditions
NOI Build-Up for 3,166 SF
Gross rent
$66.1K $20.88/SF
− Vacancy
−$12.5K −$3.95/SF
EGI
$53.6K $16.93/SF
− OpEx
−$13.4K −$4.23/SF
NOI
$40.2K $12.70/SF
Area
Wilmington, NC
Vacancy
18.90%
Lease Rate
$20.88 /SF/Yr
Expense Ratio
25.00%
Simulate Cap Rate and NOI
Suggested Prices Based on Cap Rates
Cap Rate 5%
$804,180
Cap Rate 7%
$574,414
Cap Rate 9%
$446,767
Alternative Uses
Best Use
Multifamily LT 5
$38.77M
$33.92M – $45.23M
NOI $2,713,607 @ 7.0% cap · market cap 303.20%
Second Best
Mixed Use
$38.18M
$33.41M – $44.54M
NOI $2,672,432 @ 7.0% cap · market cap 298.60%
Theoretical Best
—
—
same as Best Use
Zoning and permitted uses should be independently verified with authorities.
How Realmo checks its estimates
Property Analytics
Unlock full access to Insights
Subscribe to Realmo Intelligence
Open Analytics
Current Use
Location Intelligence
Trade Area within ½ mile
628
Businesses Nearby
Explore this area
Business Placement
Demographics for 28401, NC
22,204
Population
13,017
Households
1.7
Avg Household Size
41
Median Age
34%
College-Educated
88%
High-School Grad
31.0 sq mi
ZIP Area
716
Density / Sq Mi
$52,159
Median Household Income
$35,739
Median Earnings
$1,183
Median Rent
$263,000
Median Home Value
Check the figures for this property
Cap Rate, Value Estimation, Potential NOI and more
View Realmo Analytics
Market
Vacancy Rate% for Office in South region

Questions? Ask Rey
Realmo’s AI knows this listing — price, zoning, demand, history. Ask anything.

Frequently Asked Questions
What type of property is this?
Duplex - Historic property with residential and commercial zoning, updated interiors, and a flexible layout for living or business use.
Where is this duplex located?
The property is located at 8 S 7th Street Wilmington, NC.
What is the asking price?
The asking price for this property is $895,000.
What are key features of this property?
This property features: 3,166‑square‑foot duplex at 8 S 7th St, Wilmington, NC 28401; Built in 1918 with extensive interior renovations; Three bedrooms and two updated bathrooms


