Historic Cedar-Sided Mixed-Use
For Sale
$2,300,000
780 Main Street, Ramona, CA 92065
Commercial Sale, Ramona, CA
Property Size14,000 SF
Price / SF$164.29
Days on Market49
Property Features for 780 Main Street
General Information
Property type
Commercial Sale
Property subtype
Other
Lot features
Corner, Free Standing
Subdivision
RAMONA (92065)
Standard status
Active
APN
281-321-13
Utilities
Heating system
Heat Pump (Heating)
Cooling system
Heat Pump
Amenities
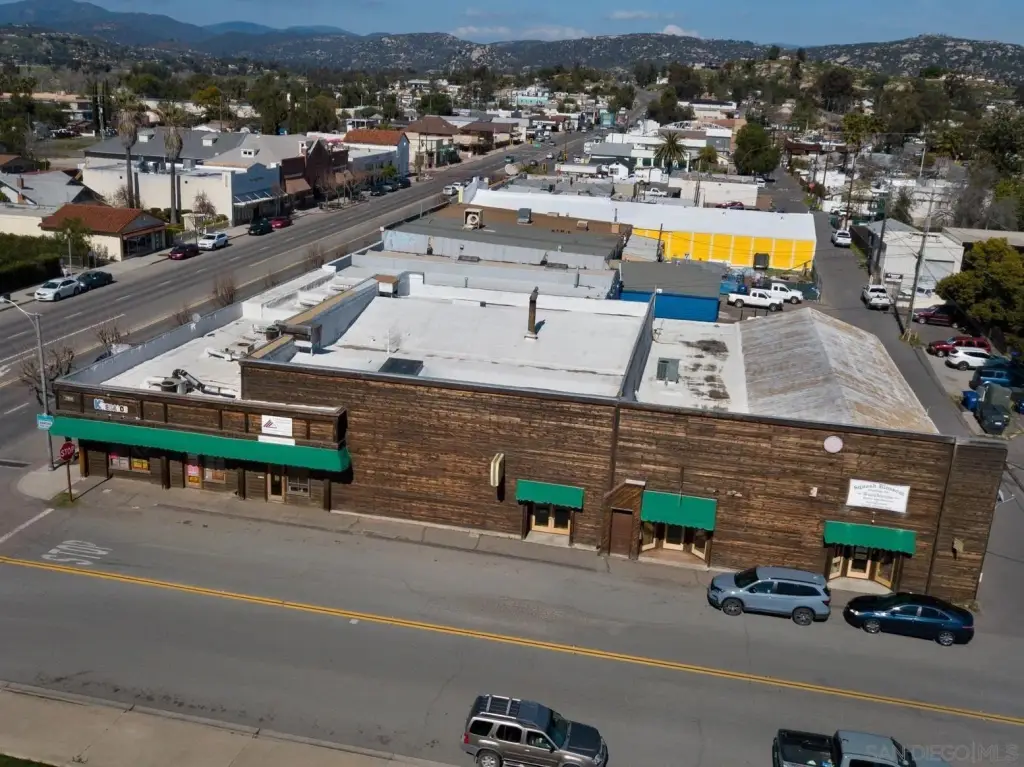
private lighted parking lot
Building Details
Floors in Building
1
Number of units
1
Flooring type
Slab
Roof type
Tar/Gravel
Listing Agency:
TL & Associates
Listed By:
Thomas D Levin · License #01361774
(760) 685-0556
Added: Sep 8
Changed: Oct 17
Last Checked: Oct 26 at 12:06AM
MLS# 260022009
Copyright © 2026 San Diego MLS. All rights reserved. All information provided by the listing agent/broker is deemed reliable but is not guaranteed and should be independently verified.

Ask AI about this property
Review the available facts, identify missing information and prepare questions for the agent.
Investment Insights
Based on property information with market context.
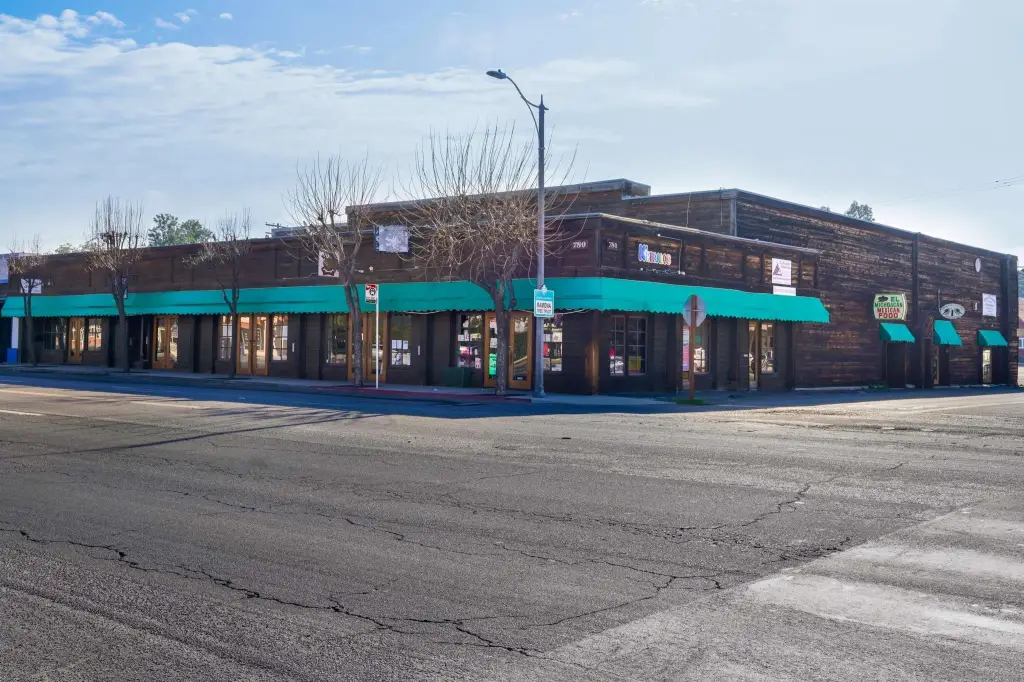
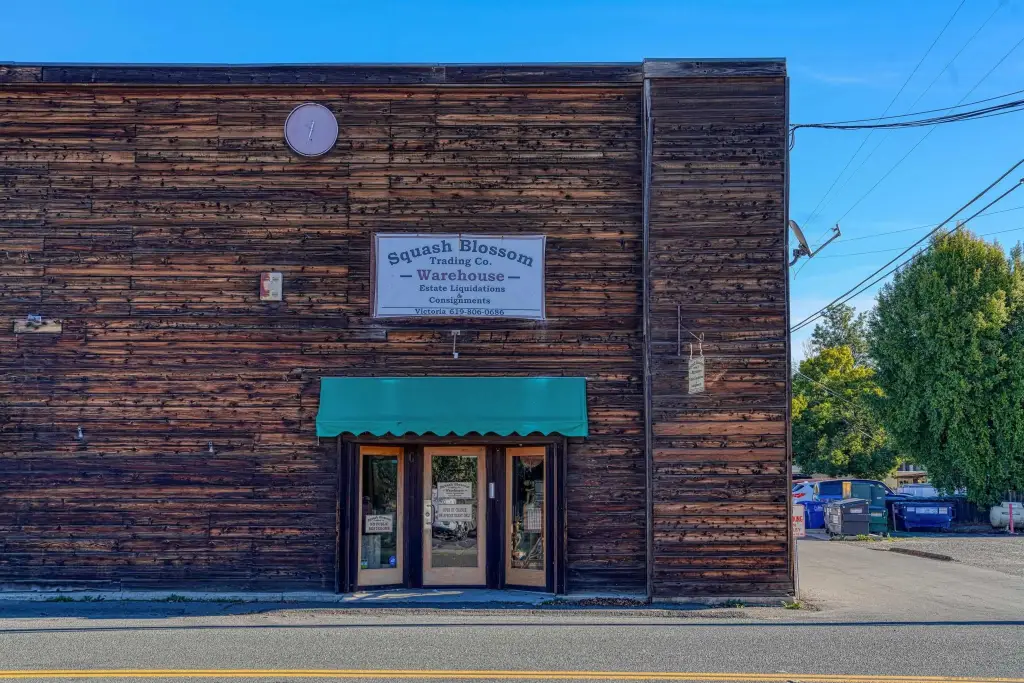
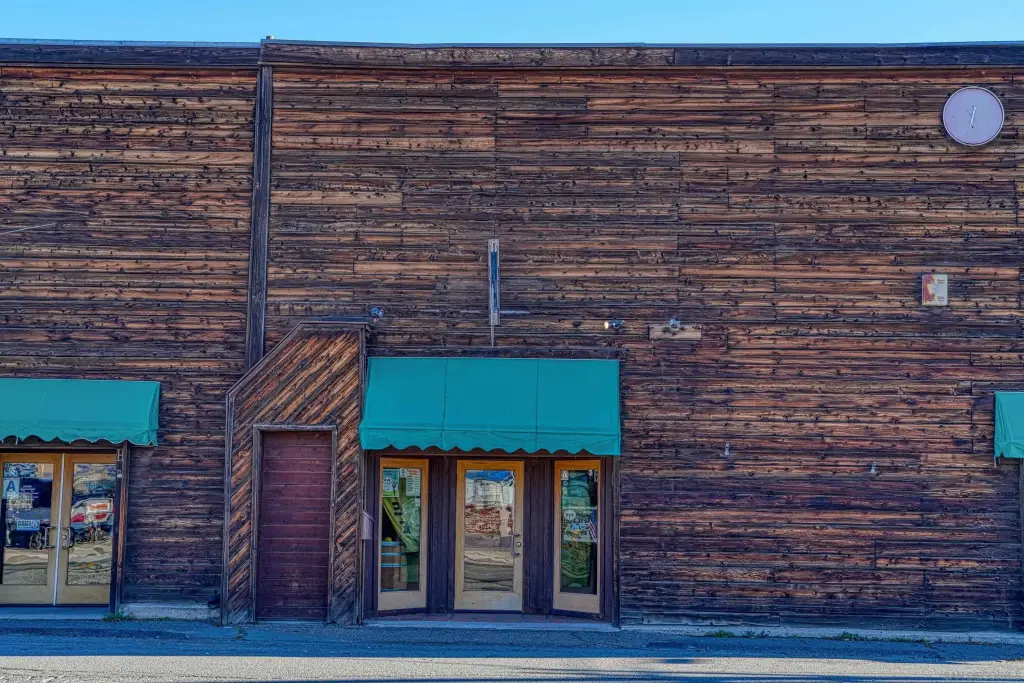
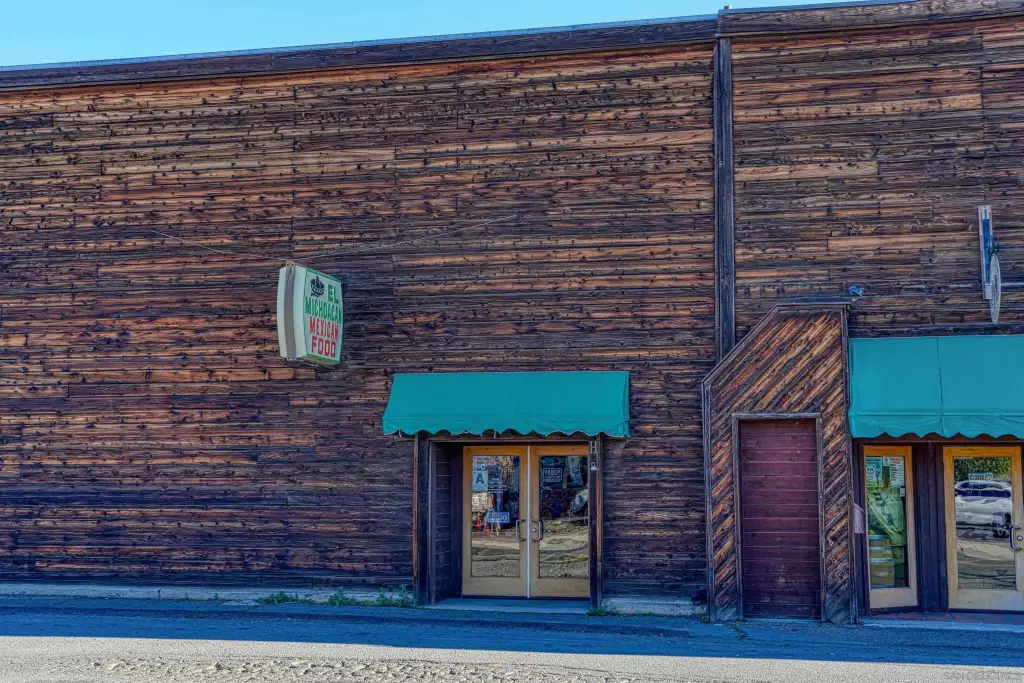
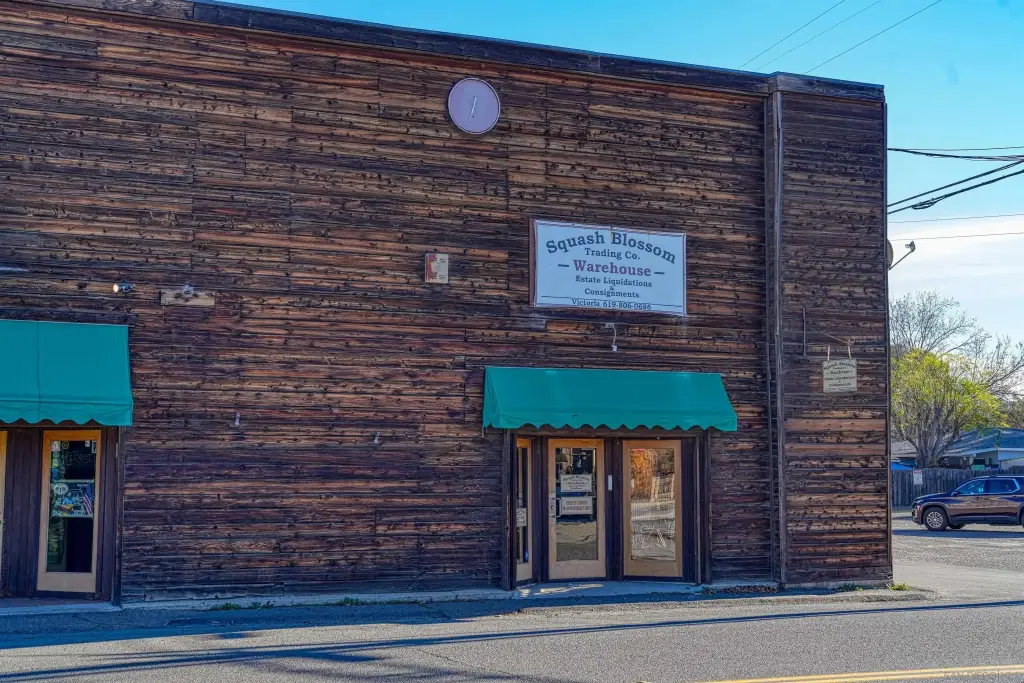
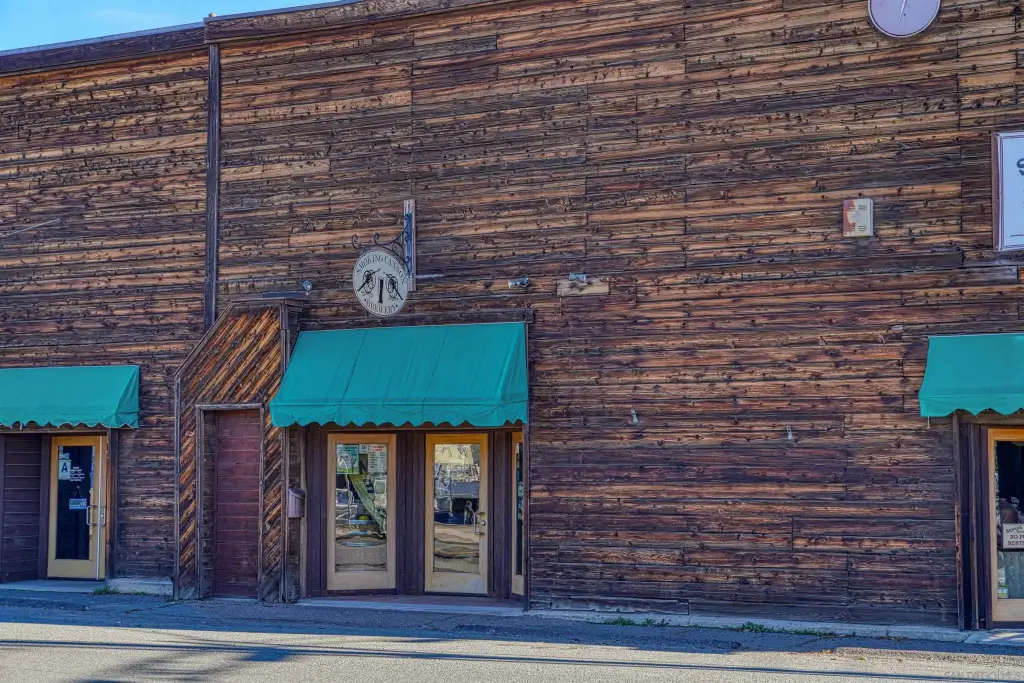
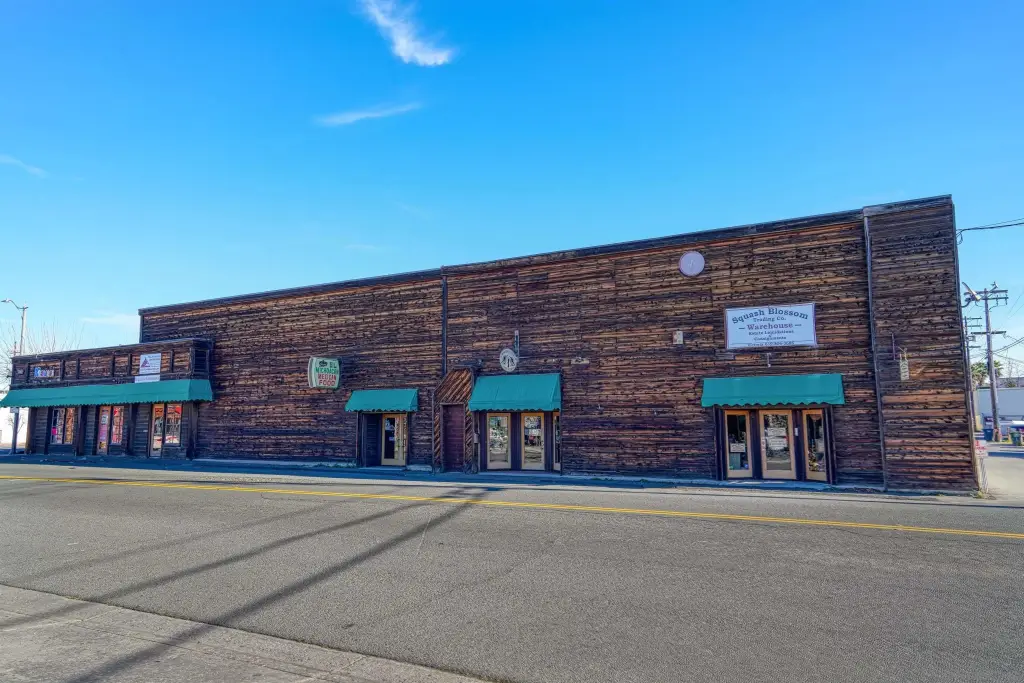
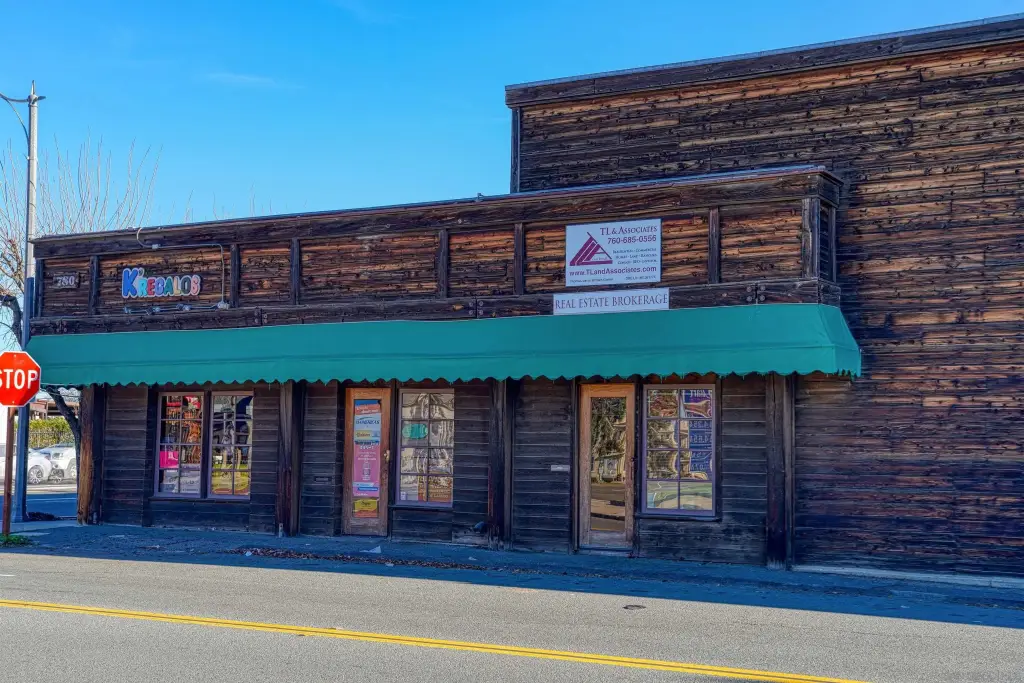
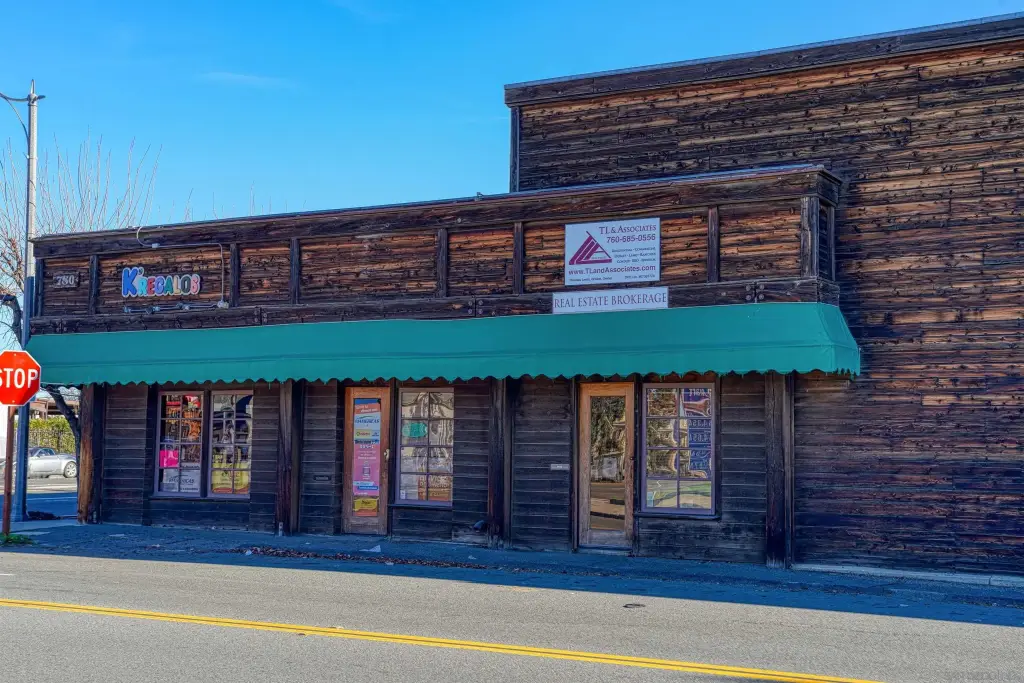
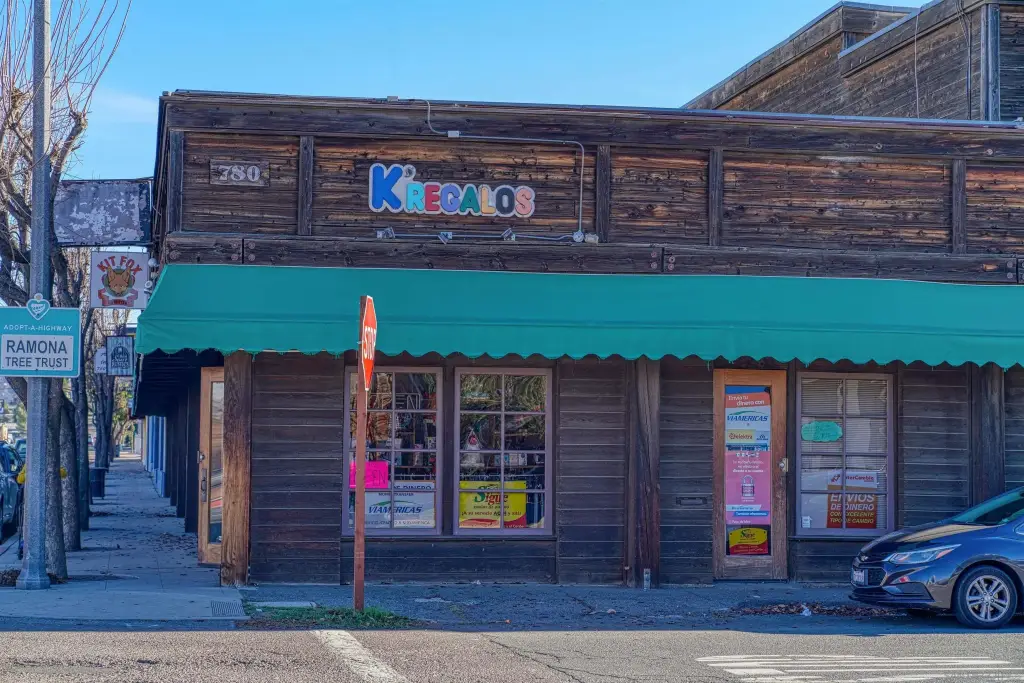
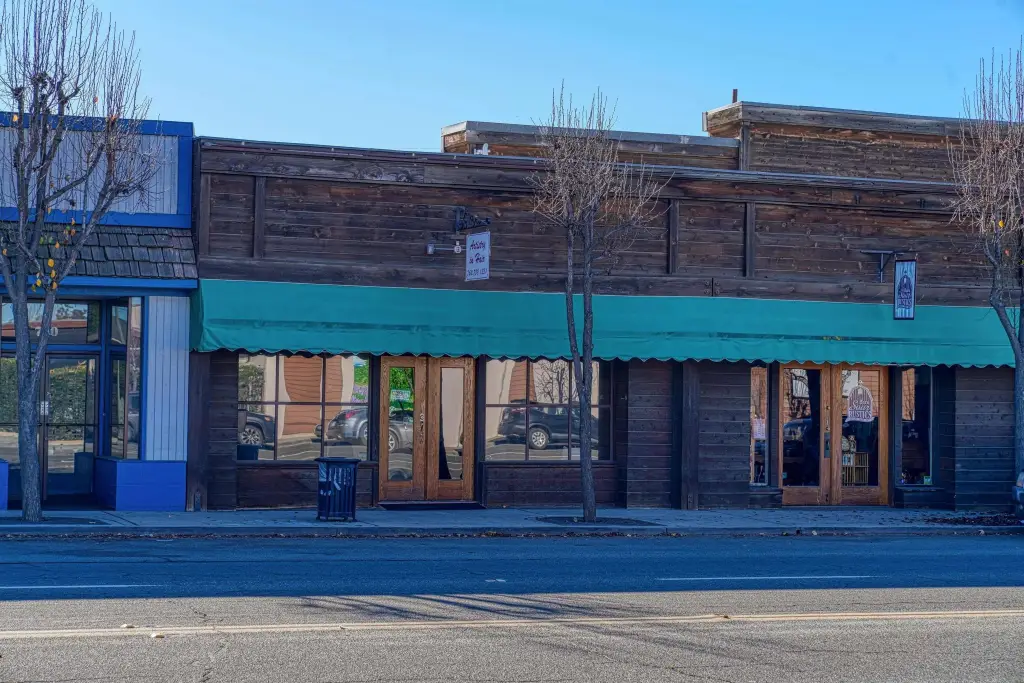
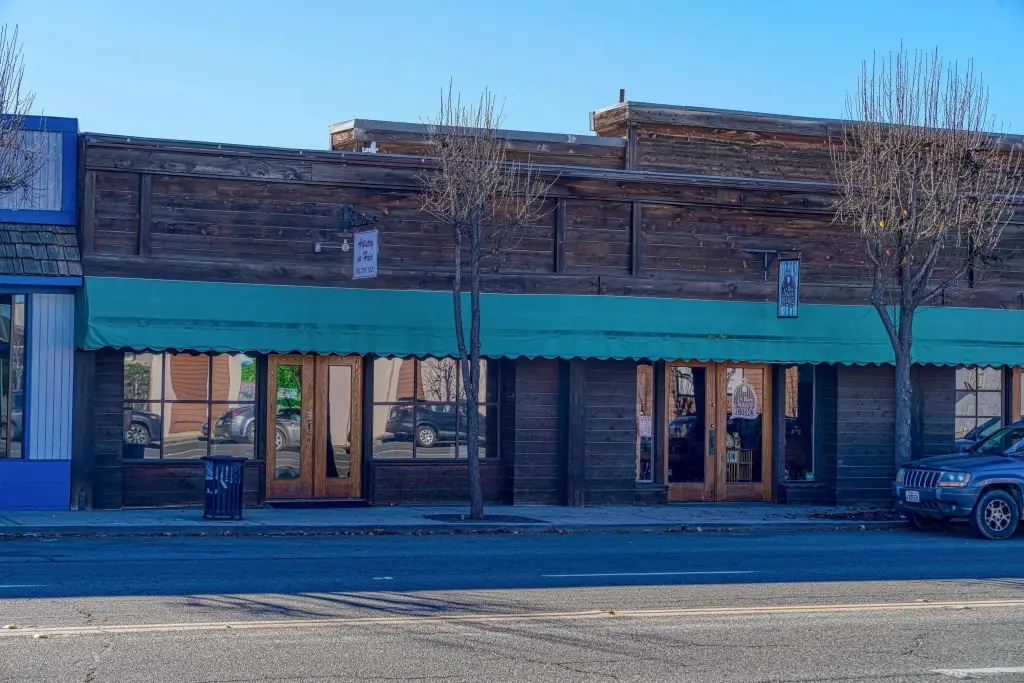
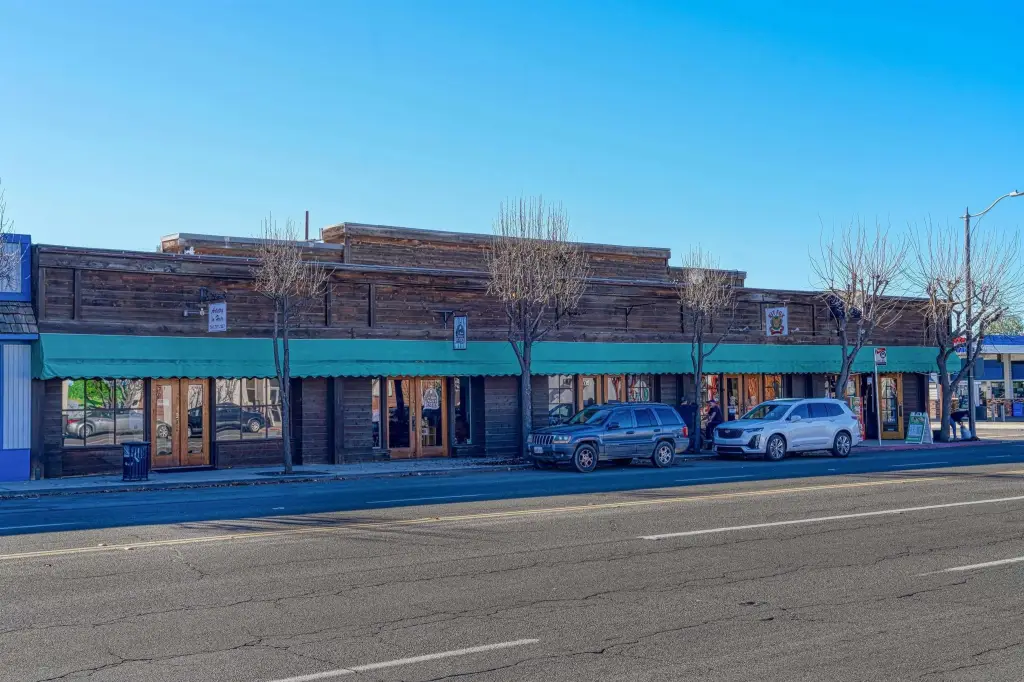
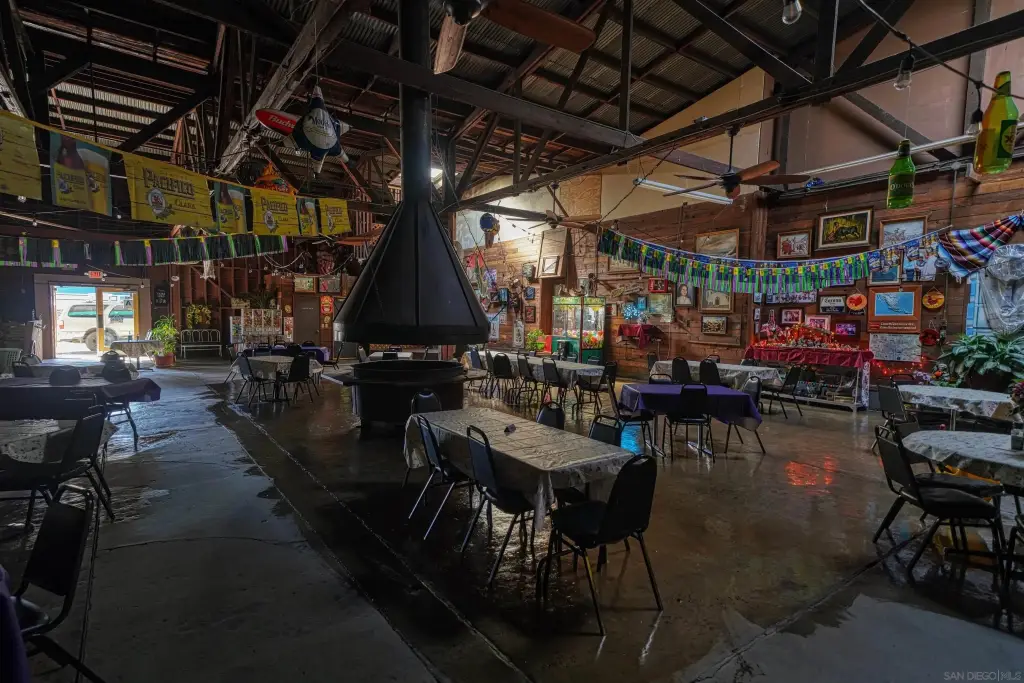
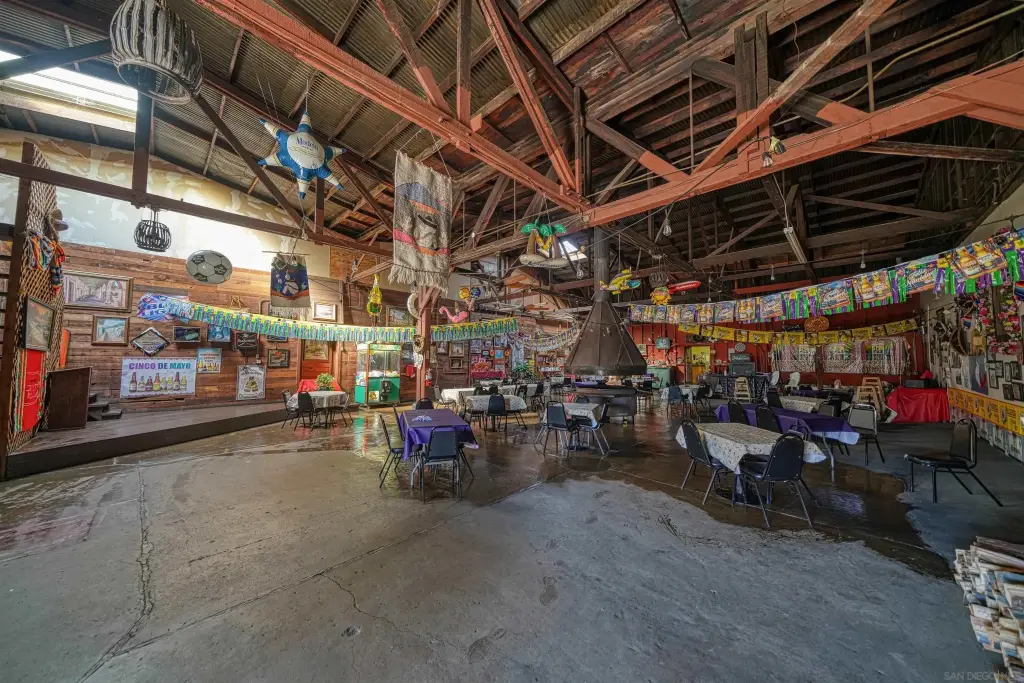
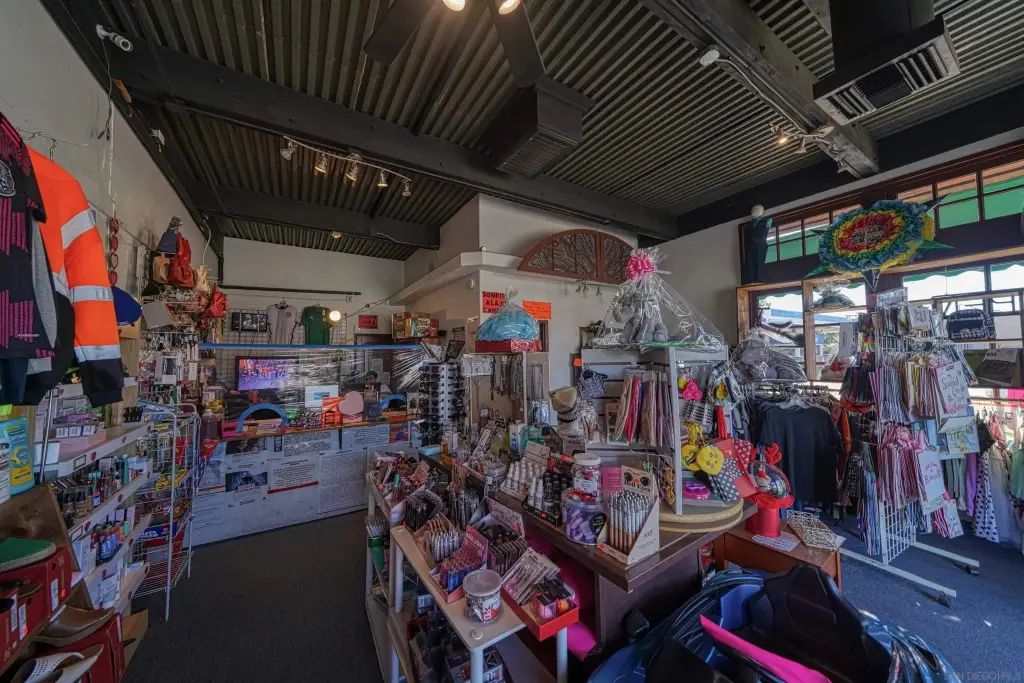
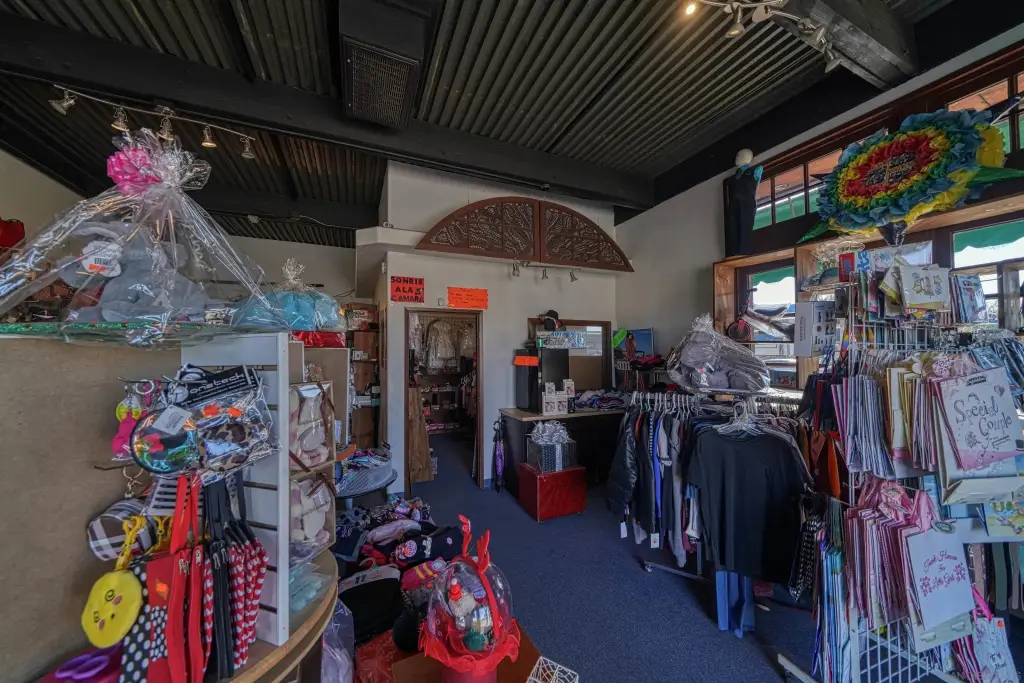
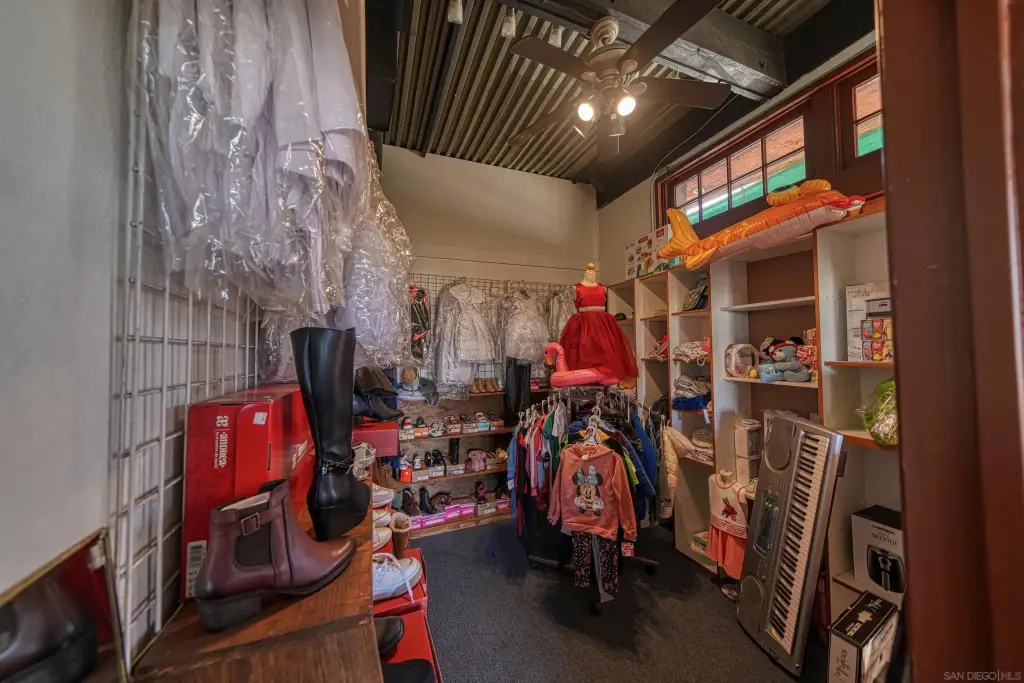
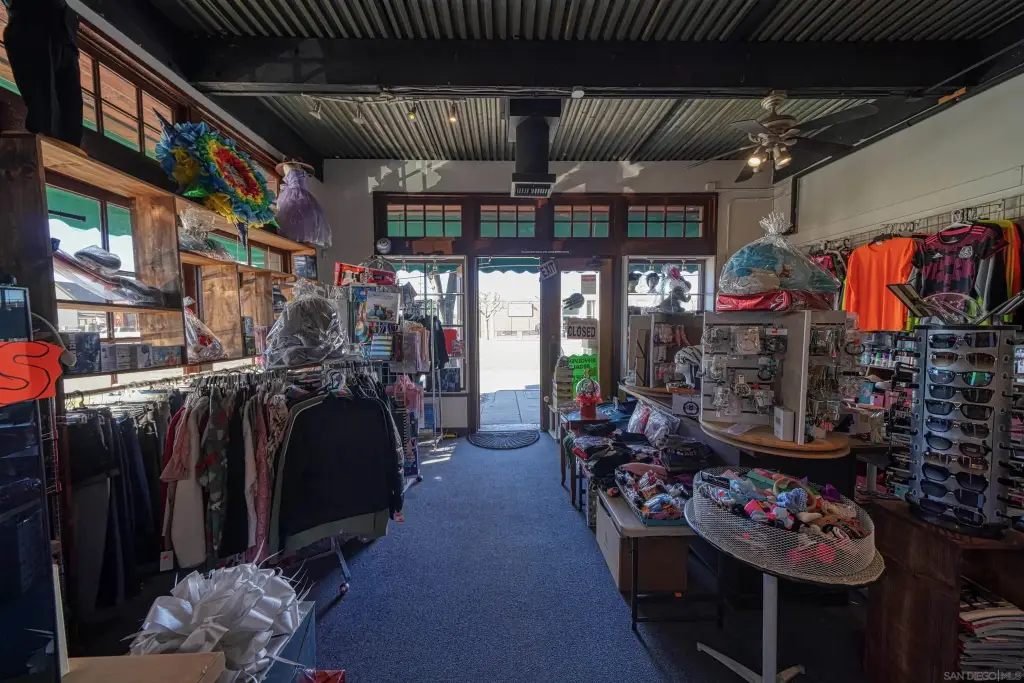
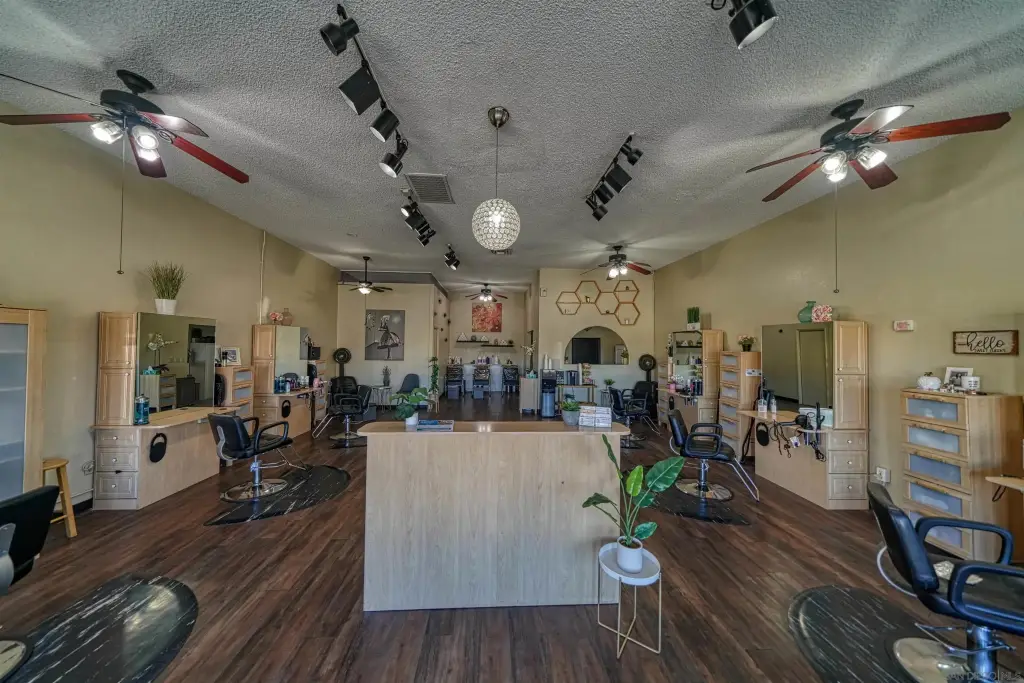
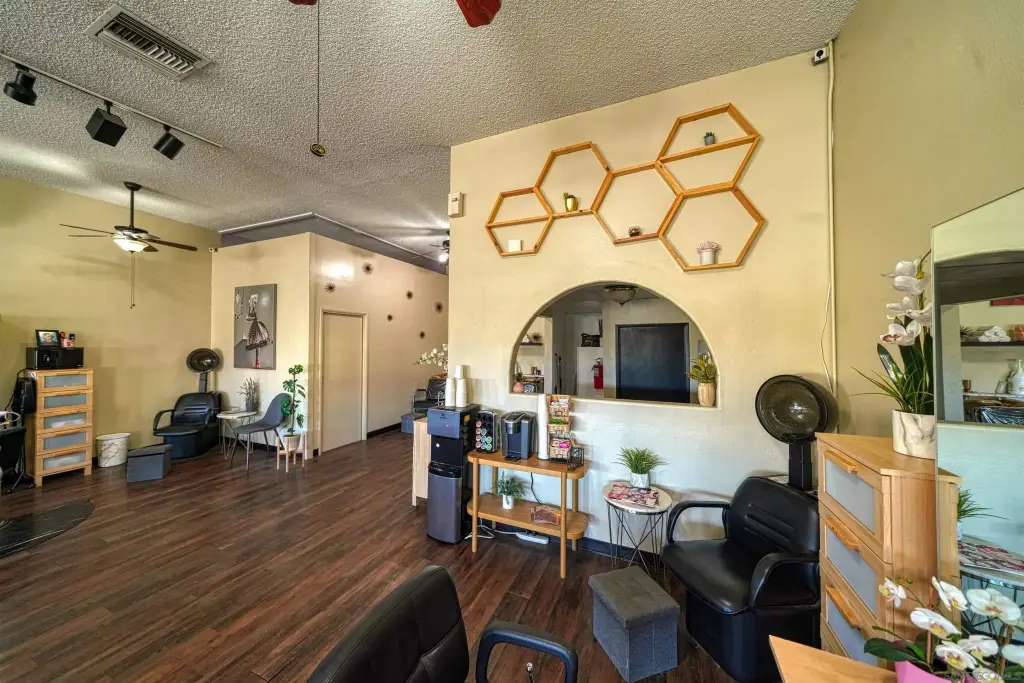
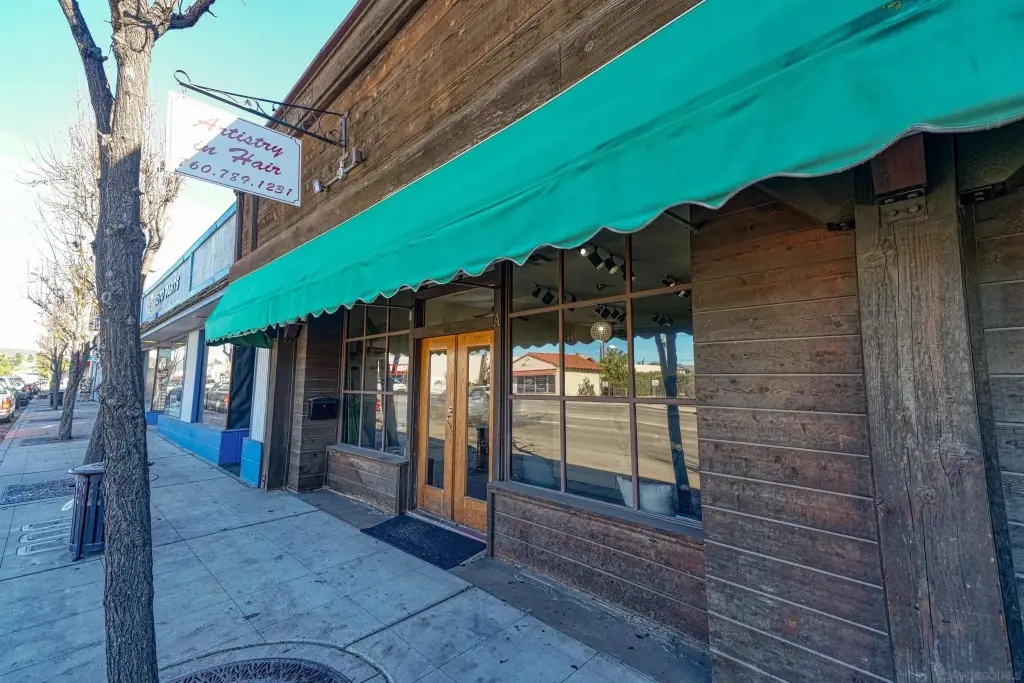
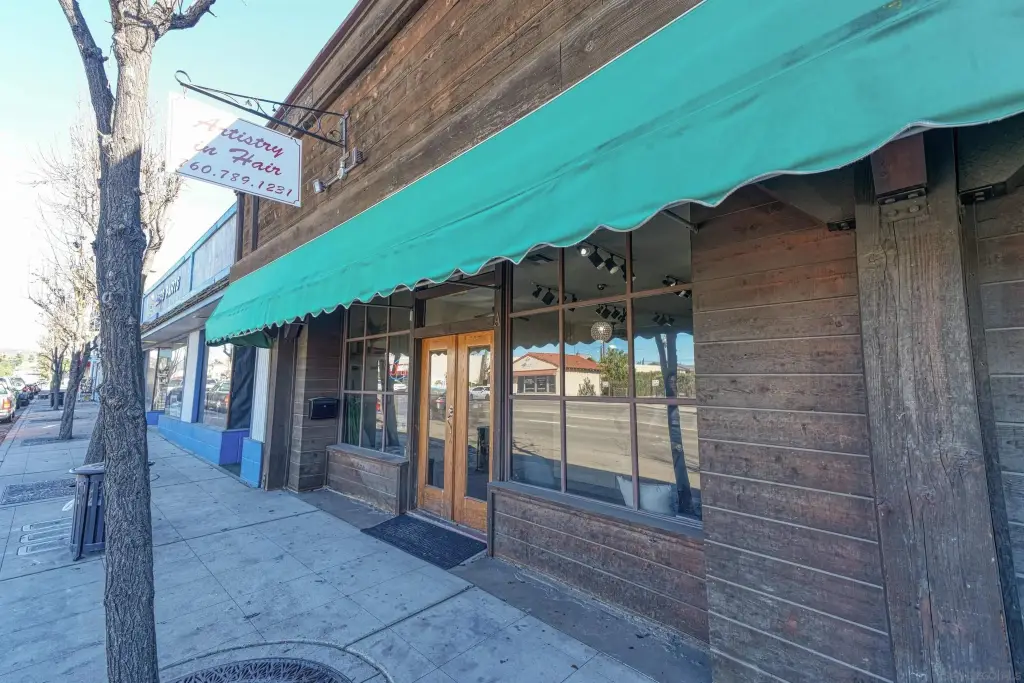
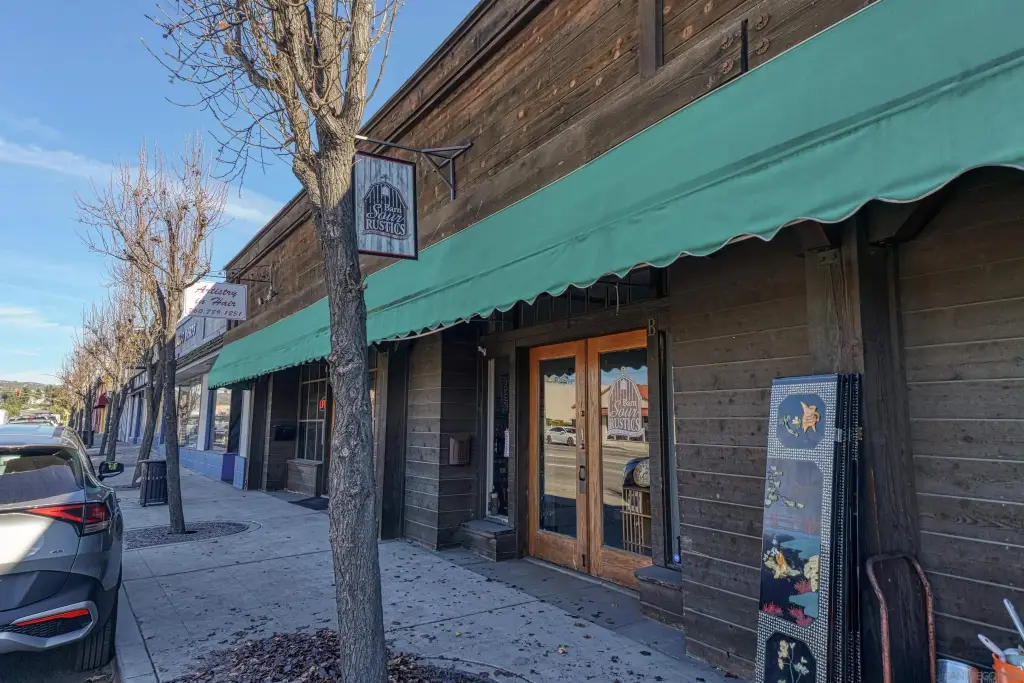
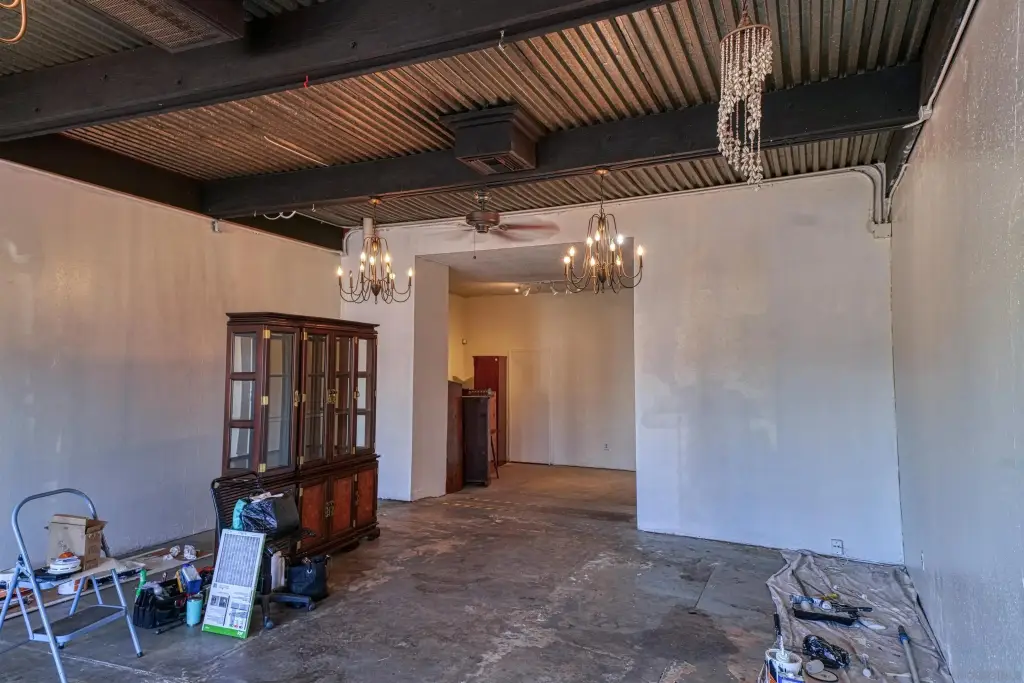
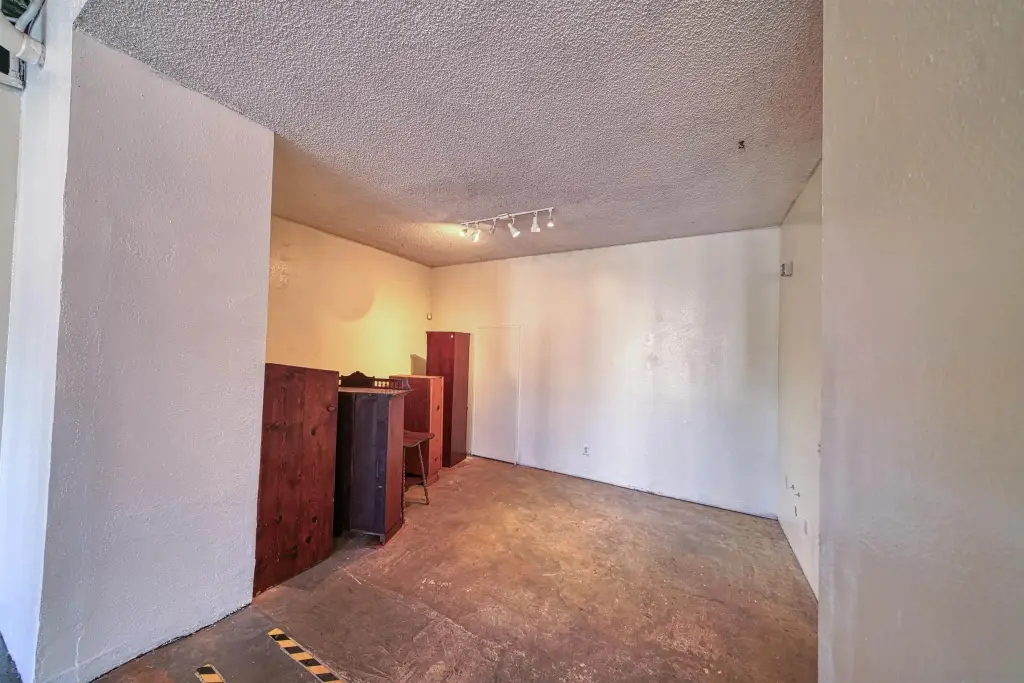
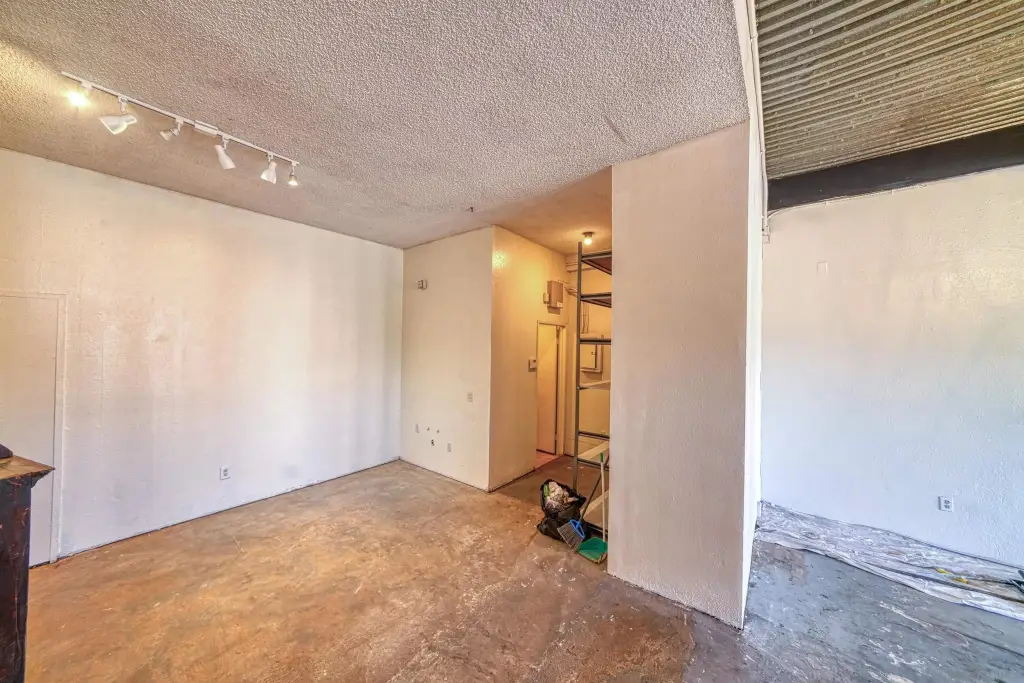
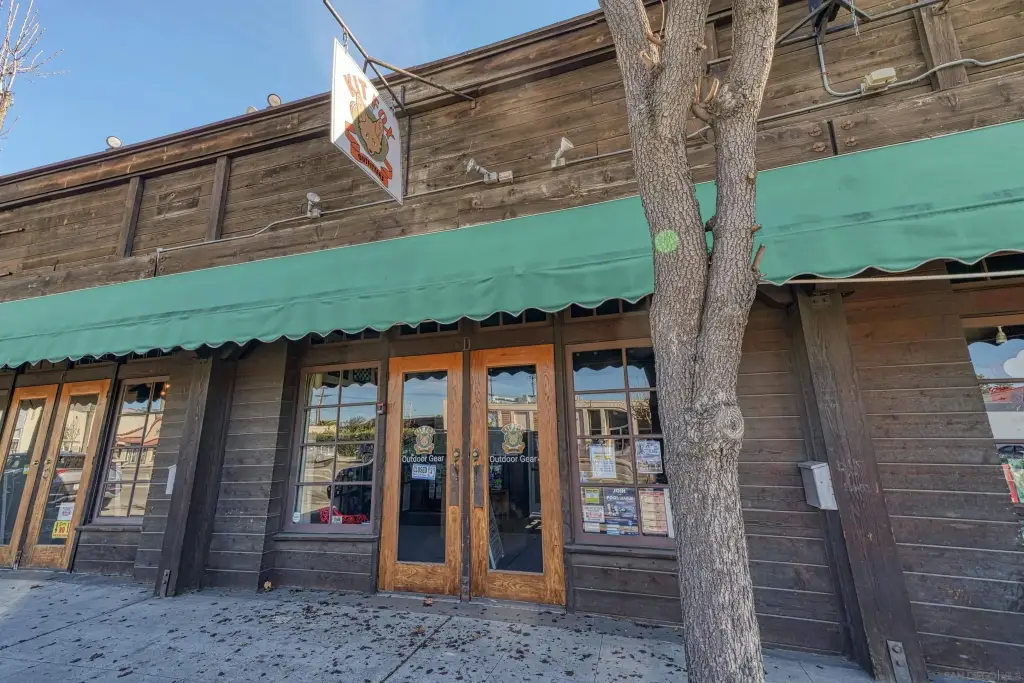
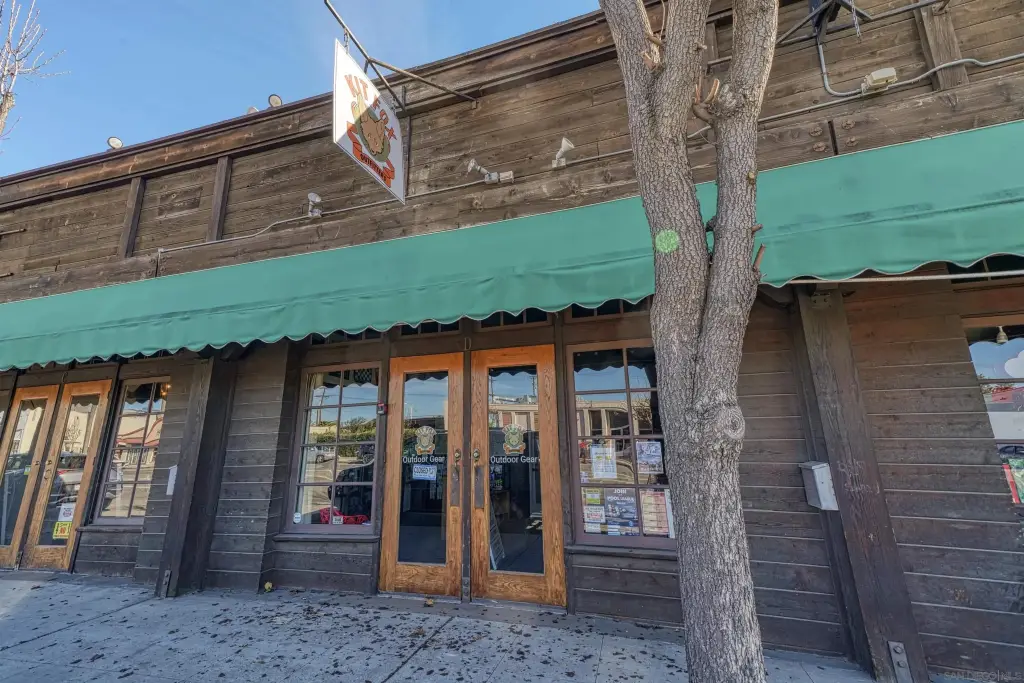
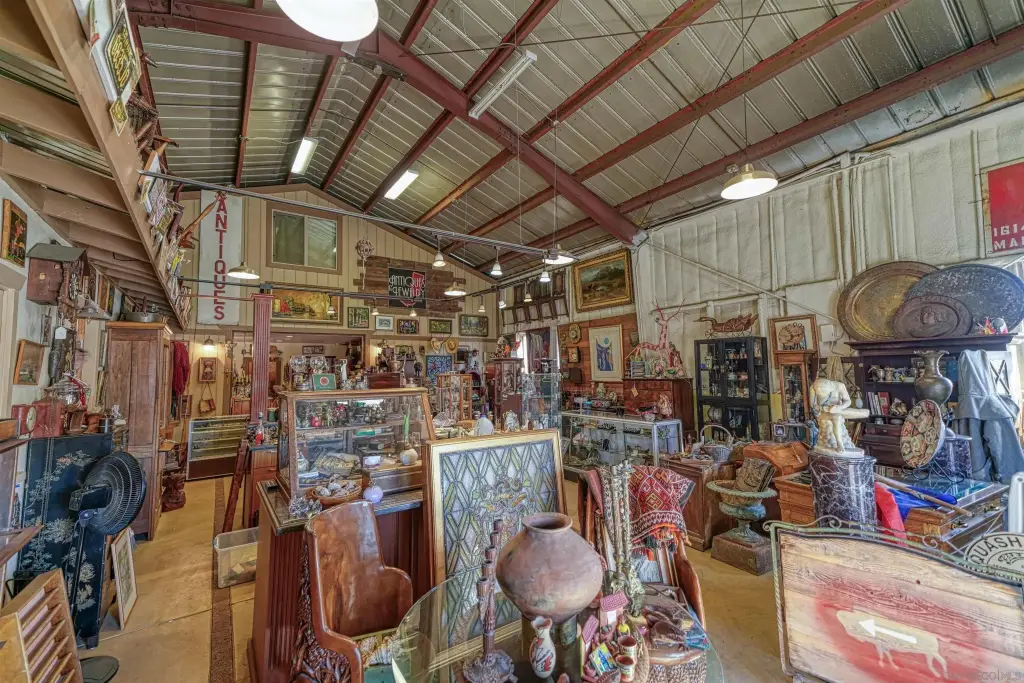
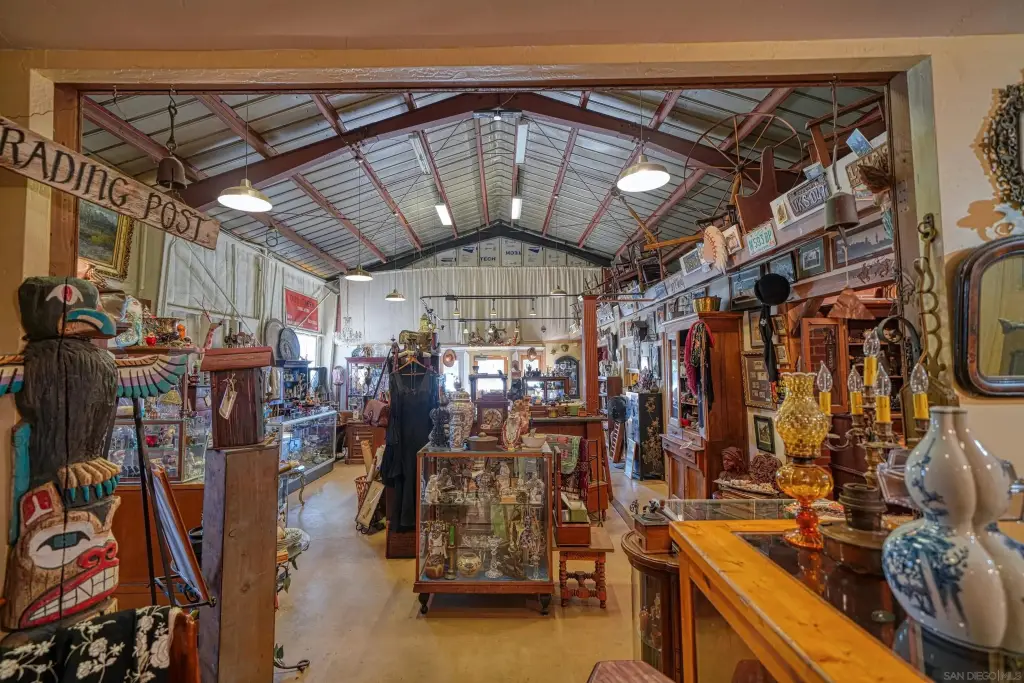
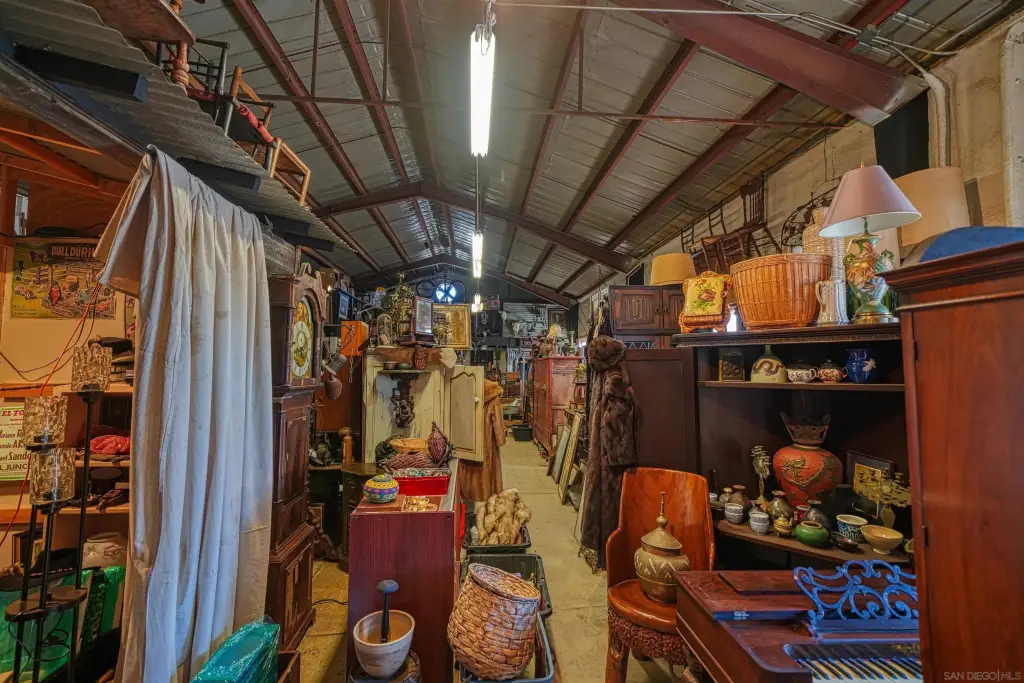
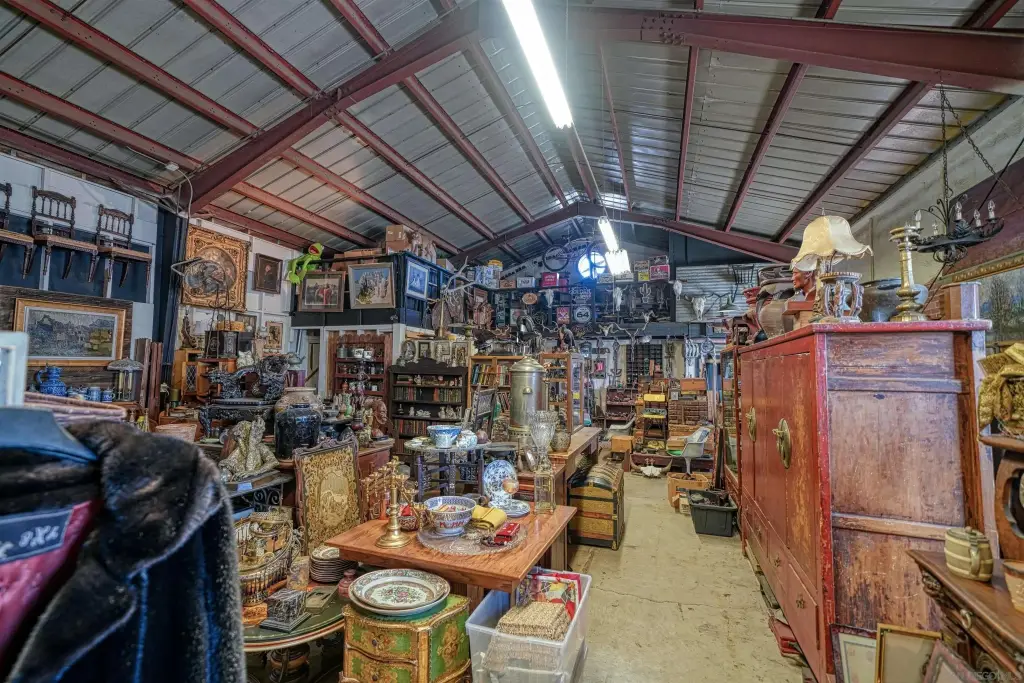
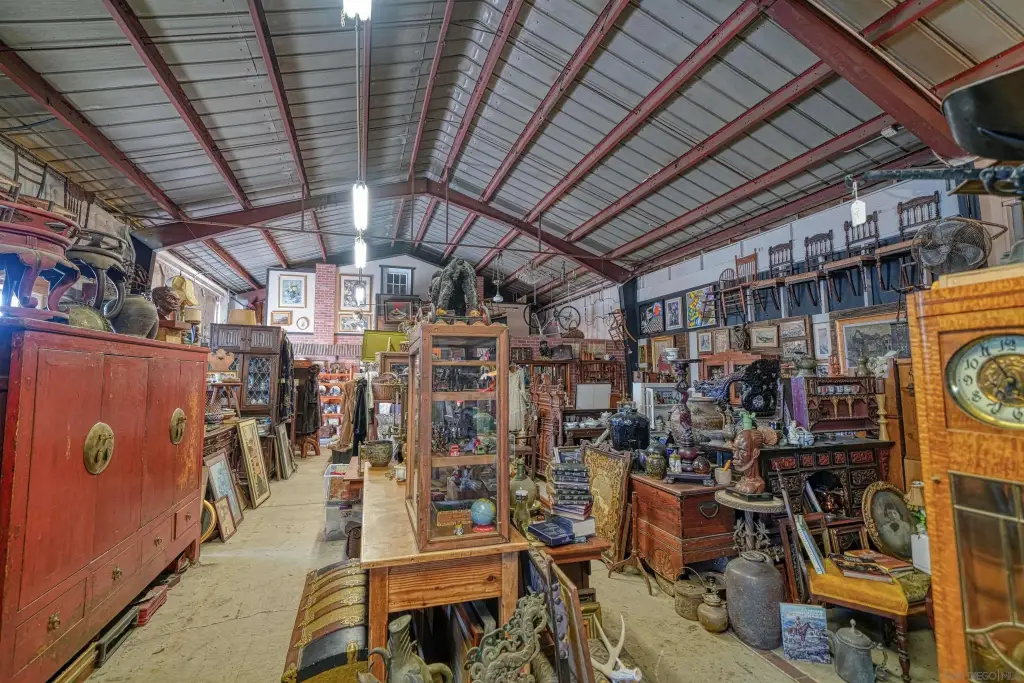
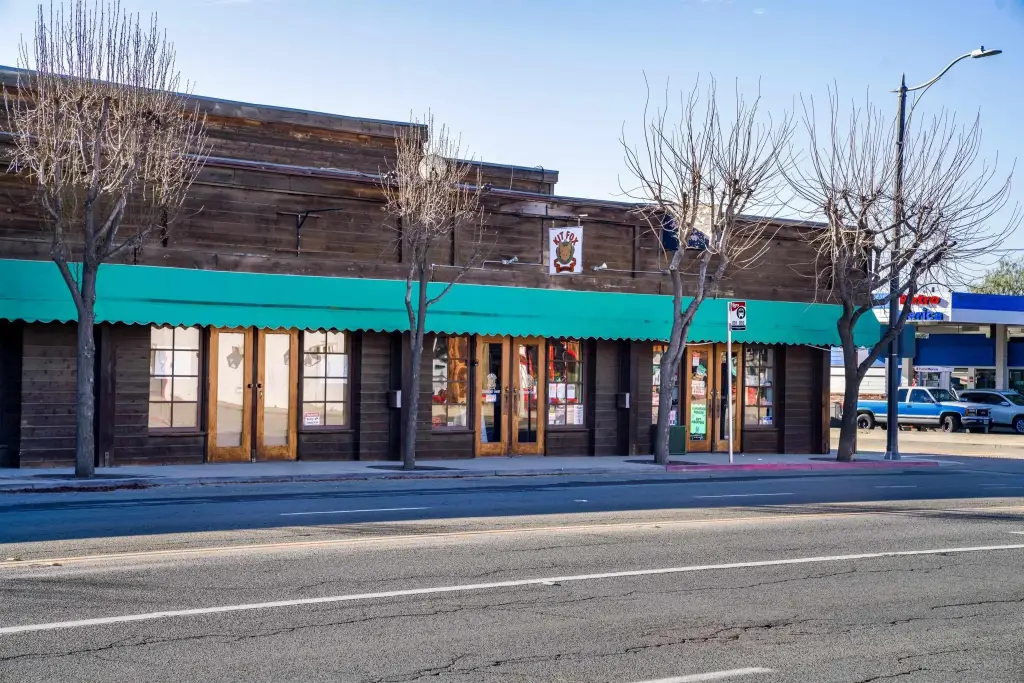
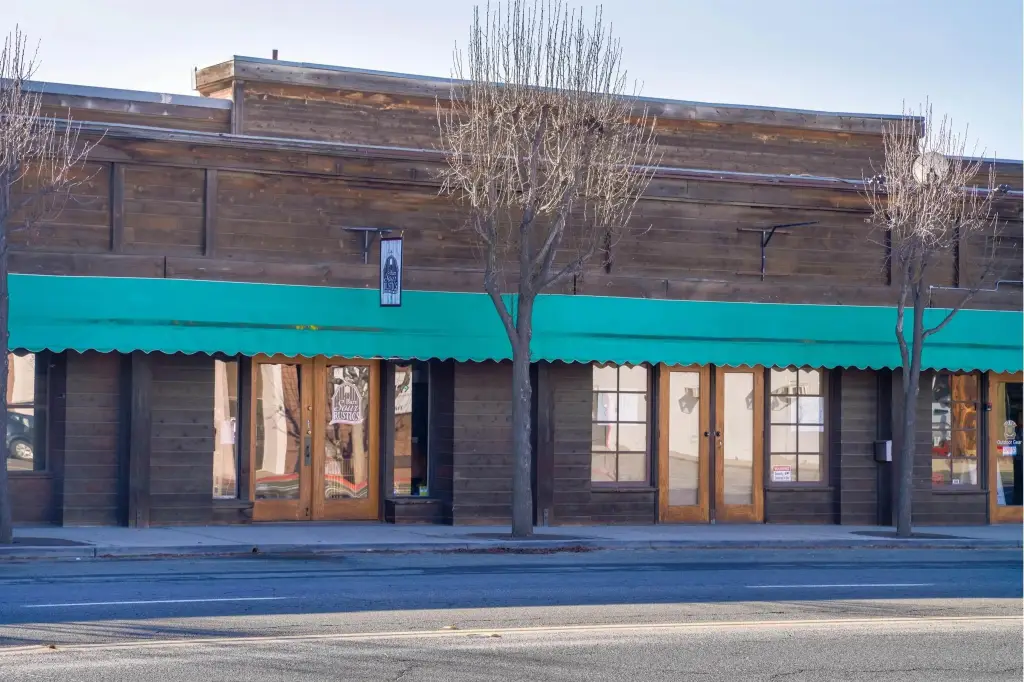
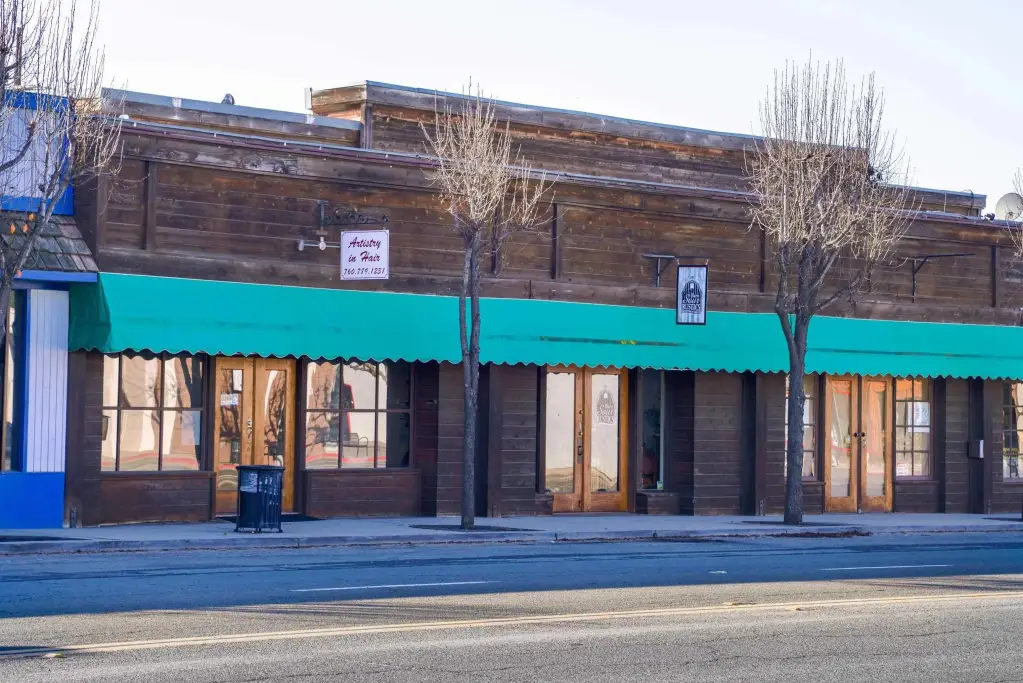
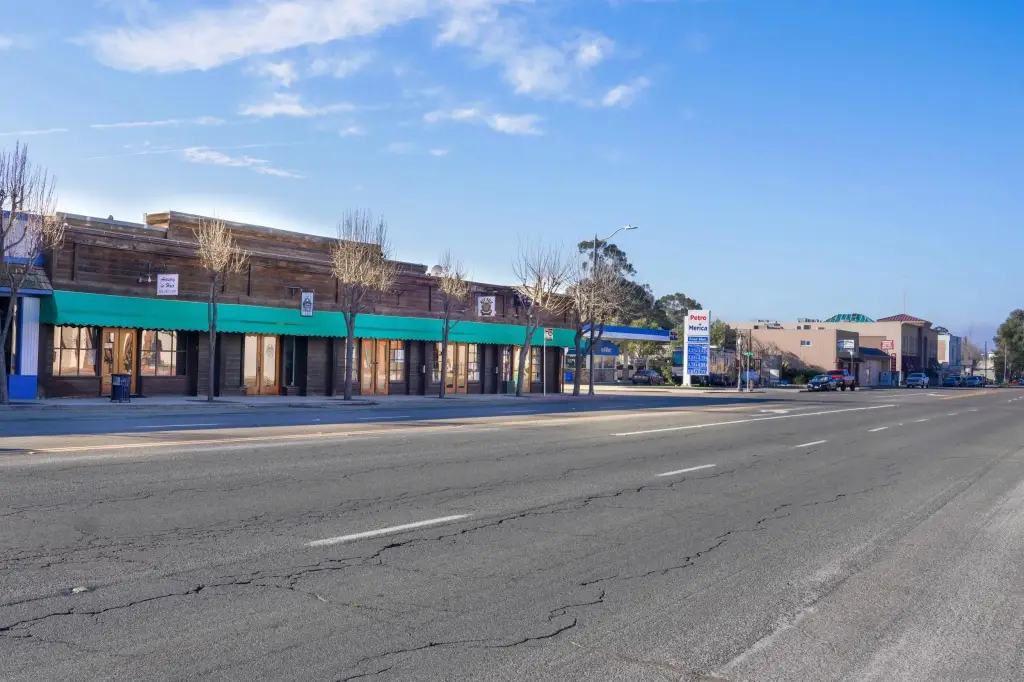
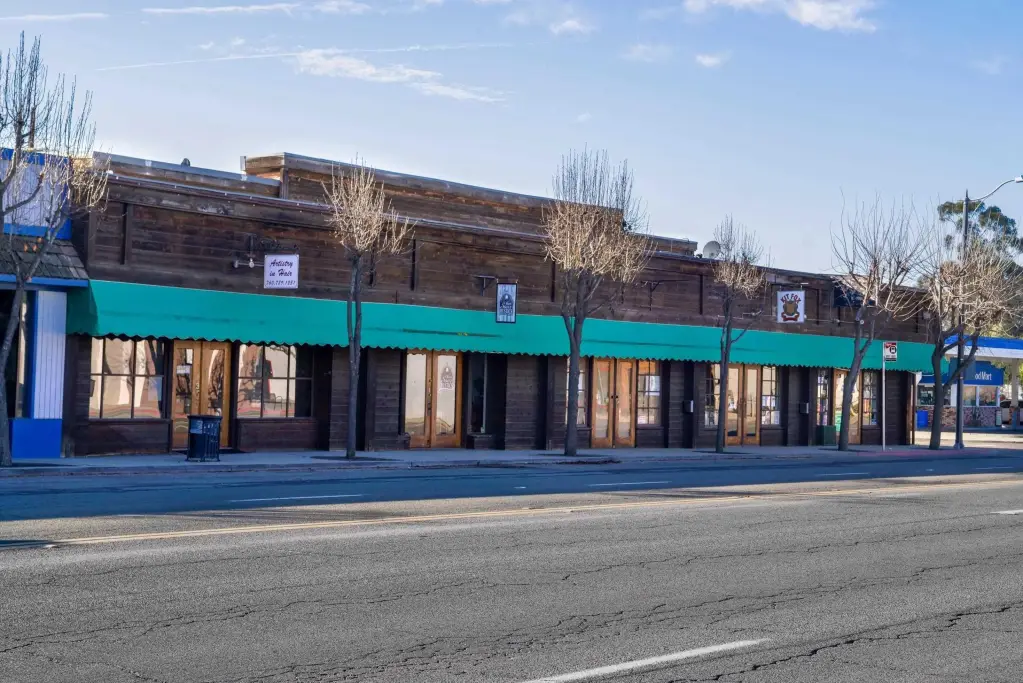
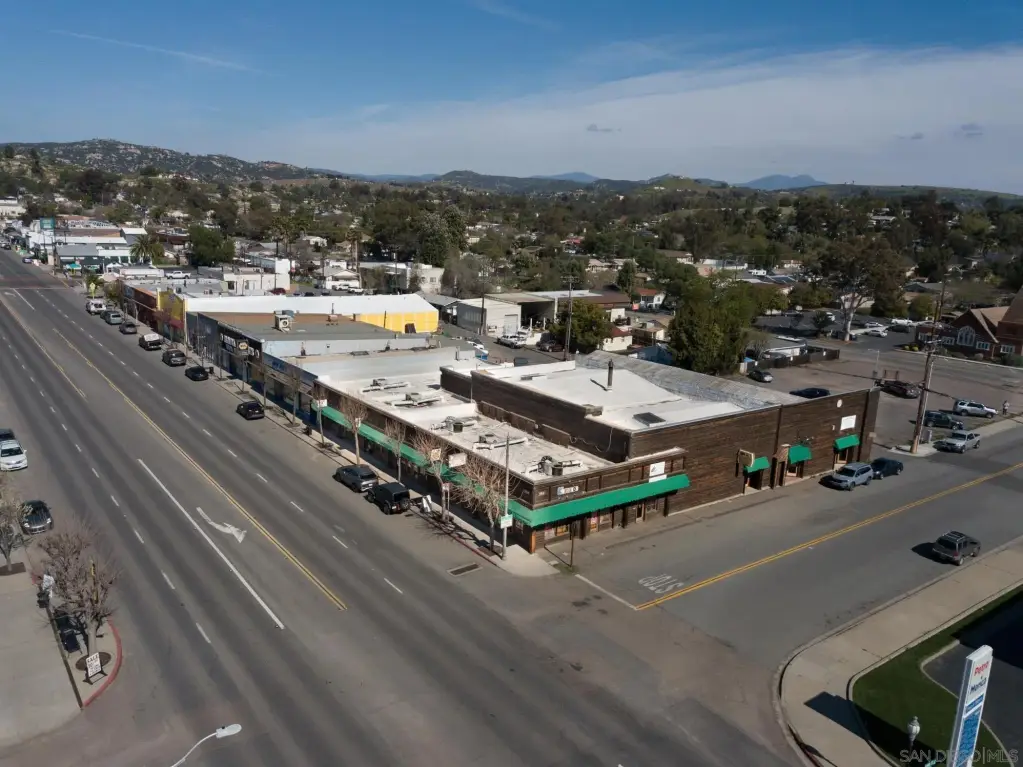
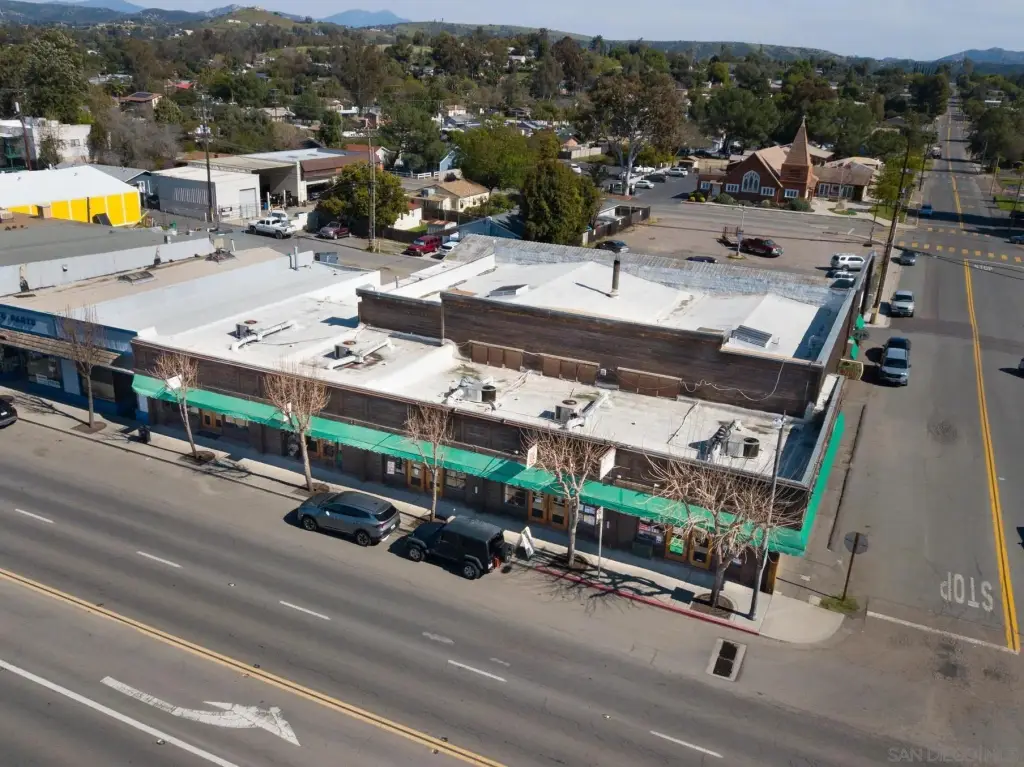
This approximately 14,000-square-foot mixed-use commercial building features a cedar-sided exterior and a layout accommodating multiple operating businesses. Current occupants include a hair salon, fitness business, antique mall, Mexican restaurant, microbrewery, and Mexican gift shop, with additional space also available within the property. The building was constructed in the 1950s as Brown Chevrolet and has remained under the same family’s ownership for nearly 50 years.
Located at 780 Main Street in Old Town Ramona, the property includes a large private lighted parking lot and additional street parking. Building systems include slab flooring, heat-pump heating and cooling, and a tar-and-gravel roof. The combination of established commercial occupancy, varied uses, and substantial on-site parking supports continued operation as a multi-tenant commercial property.
Located at 780 Main Street in Old Town Ramona, the property includes a large private lighted parking lot and additional street parking. Building systems include slab flooring, heat-pump heating and cooling, and a tar-and-gravel roof. The combination of established commercial occupancy, varied uses, and substantial on-site parking supports continued operation as a multi-tenant commercial property.
Key Highlights
- Approximately 14,000 square feet of mixed‑use commercial space
- Tenant mix includes a hair salon, fitness business, antique mall, restaurant, microbrewery, and gift shop
- Large private lighted parking lot plus street parking
Financial Insights
Estimated NOI and Cap Rate
NOI / Yr
$160,171
Cap Rate
6.96%
Suggested Prices Based on Cap Rates
Cap Rate 5%
$3,203,420
$3.2M
Cap Rate 7%
$2,288,157
$2.3M
Cap Rate 9%
$1,779,678
$1.8M
Market Conditions
NOI Build-Up for 14,000 SF
Gross rent
$252.0K $18.00/SF
− Vacancy
−$23.2K −$1.66/SF
EGI
$228.8K $16.34/SF
− OpEx
−$68.6K −$4.90/SF
NOI
$160.2K $11.44/SF
Area
San Diego County, CA
Vacancy
9.20%
Lease Rate
$18.00 /SF/Yr
Expense Ratio
30.00%
Simulate Cap Rate and NOI
Suggested Prices Based on Cap Rates
Cap Rate 5%
$3,203,420
Cap Rate 7%
$2,288,157
Cap Rate 9%
$1,779,678
Alternative Uses
Best Use
Specialty Retail
$5.23M
$4.57M – $6.10M
NOI $365,860 @ 7.0% cap · market cap 15.91%
Second Best
Mixed Use
$4.32M
$3.78M – $5.04M
NOI $302,350 @ 7.0% cap · market cap 13.15%
Theoretical Best
Office A
$6.41M
$5.61M – $7.48M
NOI $449,004 @ 7.0% cap · market cap 19.52%
Zoning and permitted uses should be independently verified with authorities.
How Realmo checks its estimates
Property Analytics
Contact the owner directly
Get the owner's phone numbers and email
Open Analytics
Current Use
Lease Details
Multi-tenant
Tenancy
Location Intelligence
Trade Area within ½ mile
821
Businesses Nearby
Explore this area
Business Placement
Demographics for 92065, CA
37,047
Population
12,774
Households
2.9
Avg Household Size
41
Median Age
29%
College-Educated
87%
High-School Grad
169.3 sq mi
ZIP Area
219
Density / Sq Mi
$120,550
Median Household Income
$52,015
Median Earnings
$1,889
Median Rent
$731,500
Median Home Value
Check the figures for this property
Cap Rate, Value Estimation, Potential NOI and more
View Realmo Analytics
Market
Vacancy Rate% for Industrial in West region


Frequently Asked Questions
What type of property is this?
Mixed-use property - Tenant-occupied commercial building with a varied business mix and private lighted parking in Old Town Ramona.
Where is this mixed-use property located?
The property is located at 780 Main Street Ramona, CA.
What is the asking price?
The asking price for this property is $2,300,000.
What are key features of this property?
This property features: Approximately 14,000 square feet of mixed‑use commercial space; Tenant mix includes a hair salon, fitness business, antique mall, restaurant, microbrewery, and gift shop; Large private lighted parking lot plus street parking



