Medina Industrial Property For
For Sale
Contact for pricing
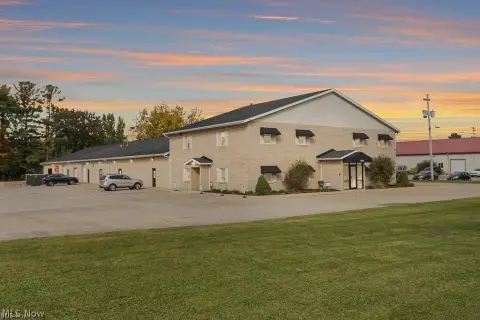
775 - 779 W Smith Rd Medina, Medina, OH 44256
Professionally managed industrial property in Medina, Ohio, suitable for investors.
Property Size100,000 SF
Price / SF$67.50
Days on Market471
Property Features for 775 - 779 W Smith Rd Medina
General Information
Standard status
Active
Size
100,000 SF
Class
C
Property subtype
Industrial
Zoning
I-1
Occupancy
97%
Lease Type
NNN
Investment Type
Core+
Building Details
Year Built
1973
Year Renovated
2023
Buildings
3
Stories
1
Tenancy
Multi
Listing Agency:
The Masica Company
Listed By:
Steve Masica · License #OH #2013002150
(216) 293-8900
Source:
Crexi
Added: Jun 23, 2025
Changed: Aug 23
Last Checked: Aug 14 at 7:24AM
Displayed information is deemed reliable but is not guaranteed and should be independently verified. All listing content including descriptions, pricing, images are the copyrighted material of The Masica Company
Investment Insights
Based on property information with market context.
This professionally managed industrial property offers an investment opportunity with stabilized income and future upside. The property has been maintained by long-term ownership, with upgrades including refreshed office units, modern lighting, and a compliant fire suppression system. The asset is transitioning to triple net (NNN) leases, already in place with some tenants, for enhanced expense recovery and predictable cash flow. Located in Medina’s industrial market, demand is strong among smaller-bay users, driving rent growth and low vacancy. Management is in place and available post-sale, offering operational continuity for local or out-of-market investors seeking reliable returns and long-term flexibility. The property is a flexible, industrial-zoned property in Medina’s established industrial corridor, suitable for warehousing, light manufacturing, service trades, and flex-office uses, appealing to both owner-users and investors. The site provides direct access to I-71, Route 18, and Route 42. Recent upgrades to West Smith Road enhance connectivity to Cleveland, Akron, and surrounding markets. Medina’s low operating costs, competitive tax environment, and access to a skilled labor pool make it a cost-effective alternative to metro-core areas. Nearby amenities like Historic Medina Square and Foundry Social add to tenant appeal. Located near the Medina County Fairgrounds and similar industrial users and service-based users, the property benefits from visibility, local traffic exposure, and adaptability for future tenant needs. The property offers a strategic foothold in a market with upside potential and long-term industrial viability.
Key Highlights
- Stabilized income with future upside potential in Medina's strong industrial market.
- Transitioning to triple net (NNN) leases for enhanced expense recovery and predictable cash flow.
- Strategic location with direct access to I‑71, Route 18, and Route 42, providing connectivity to major markets.
Financial Insights
Estimated NOI and Cap Rate
NOI / Yr
$452,618
Cap Rate
6.71%
Suggested Prices Based on Cap Rates
Cap Rate 5%
$9,052,360
$9.1M
Cap Rate 7%
$6,465,971
$6.5M
Cap Rate 9%
$5,029,089
$5.0M
Market Conditions
NOI Build-Up for 100,000 SF
Gross rent
$557.0K $5.57/SF
− Vacancy
−$24.5K −$0.25/SF
EGI
$532.5K $5.32/SF
− OpEx
−$79.9K −$0.80/SF
NOI
$452.6K $4.53/SF
Area
Medina County, OH
Vacancy
4.40%
Lease Rate
$5.57 /SF/Yr
Expense Ratio
15.00%
Simulate Cap Rate and NOI
Suggested Prices Based on Cap Rates
Cap Rate 5%
$9,052,360
Cap Rate 7%
$6,465,971
Cap Rate 9%
$5,029,089
Alternative Uses
Best Use
Warehouse
$6.47M
$5.66M – $7.54M
NOI $452,618 @ 7.0% cap · market cap 6.71%
Second Best
Flex RnD
$5.87M
$5.14M – $6.85M
NOI $410,982 @ 7.0% cap · market cap 6.09%
Theoretical Best
Specialty Retail
$27.89M
$24.41M – $32.54M
NOI $1,952,505 @ 7.0% cap · market cap 28.93%
Zoning and permitted uses should be independently verified with authorities.
Property Analytics
Unlock full access to Insights
Subscribe to Realmo Intelligence
Open Analytics
Current Use
Location Intelligence
Trade Area within ½ mile
414
Businesses Nearby
Under-served
Demand for This Use
Explore this area
Business Placement
Demographics for 44256, OH
64,815
Population
26,740
Households
2.4
Avg Household Size
43
Median Age
42%
College-Educated
96%
High-School Grad
130.8 sq mi
ZIP Area
496
Density / Sq Mi
$100,345
Median Household Income
$55,180
Median Earnings
$1,120
Median Rent
$292,000
Median Home Value
Check the figures for this property
Cap Rate, Value Estimation, Potential NOI and more
View Realmo Analytics
Market
Vacancy Rate% for Industrial in Midwest region

Questions? Ask Rey
Realmo’s AI knows this listing — price, zoning, demand, history. Ask anything.






Frequently Asked Questions
What type of property is this?
Flex space - Professionally managed industrial property in Medina, Ohio, suitable for investors.
Where is this flex space located?
The property is located at 775 - 779 W Smith Rd Medina Medina, OH.
What is the asking price?
The asking price for this property is $6,750,000.
What are key features of this property?
This property features: Stabilized income with future upside potential in Medina's strong industrial market.; Transitioning to triple net (NNN) leases for enhanced expense recovery and predictable cash flow.; Strategic location with direct access to I‑71, Route 18, and Route 42, providing connectivity to major markets.



