Mixed-Use Property with
For Sale
$875,000
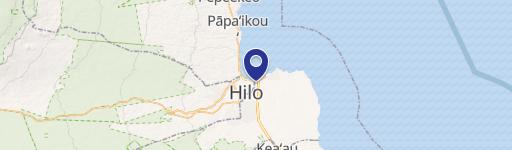
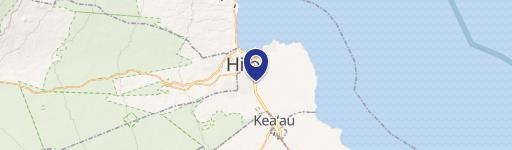
77 SILVA ST, Hilo, HI 96720
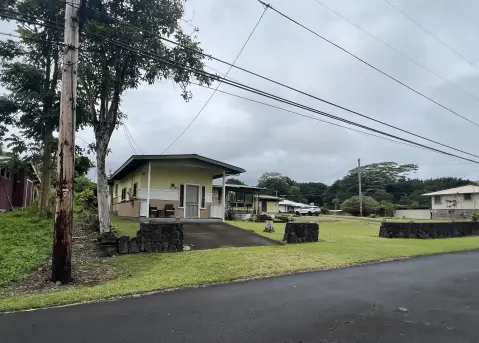
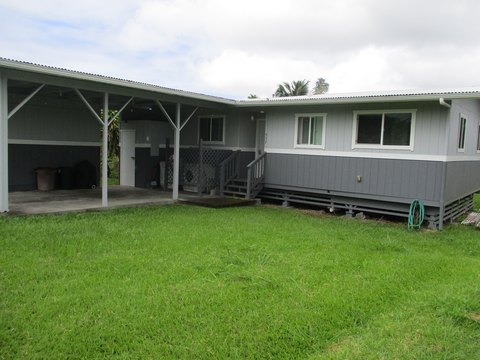
The property combines residential quarters with commercial workspace and multiple storage areas.
Property Size5,464 SF
Price / SF$160.14
Days on Market218
Property Features for 77 SILVA ST
General Information
Standard status
Active
Size
5,464 SF
Property subtype
Commercial
Additional Details
Warehouse Space
2,464 SF
Taxes and HOA fees
Annual Taxes
$5,302
Amenities
covered lanai
kitchenette
studio
storage/closet areas
Attached Garage
Building Details
Year Built
1951
Buildings
1
Stories
2
Listing Agency:
REAL BROKER
(808) 650-5145
Listed By:
ELLADA PEREPECHAEV · License #RS-86971
(808) 333-8206
Source:
Corcoran
Added: Mar 13
Changed: Oct 15
Last Checked: Oct 16 at 9:12AM
Displayed information is deemed reliable but is not guaranteed and should be independently verified. All listing content including descriptions, pricing, images are the copyrighted material of REAL BROKER

Ask AI about this property
Review the available facts, identify missing information and prepare questions for the agent.
Investment Insights
Based on property information with market context.
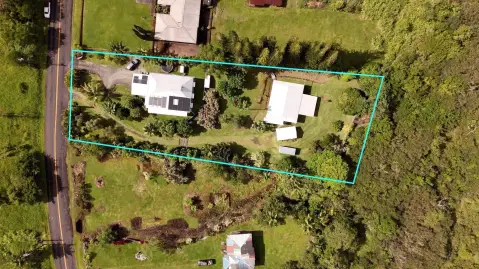
This mixed-use property brings together an upper-level residence and attached commercial improvements. The home includes four bedrooms, one and a half baths, and approximately 3,000 square feet of living area. Below it are eight separate storage or closet areas, a large studio with kitchenette, and an adjoining room. The warehouse is configured as an auto repair shop, with a 704-square-foot front bay, an adjacent 880-square-foot section, and 880 square feet of second-level warehouse space. A covered rear lanai adds another functional area. The property contains over 5,400 square feet of covered area and was built in 1951. Located at 77 Silva Street in Hilo, the property is zoned MG-1A.
Key Highlights
- Upper‑level 4‑bedroom, 1.5‑bath home with approx. 3,000 sqft of living area
- Attached commercial warehouse currently configured as an auto repair shop
- Front bay measures approx. 704 sqft, with an adjacent 880 sqft section
Financial Insights
Estimated NOI and Cap Rate
NOI / Yr
$70,741
Cap Rate
8.08%
Suggested Prices Based on Cap Rates
Cap Rate 5%
$1,414,820
$1.4M
Cap Rate 7%
$1,010,586
$1.0M
Cap Rate 9%
$786,011
$786.0K
Market Conditions
NOI Build-Up for 5,464 SF
Gross rent
$102.3K $18.72/SF
− Vacancy
−$1.2K −$0.22/SF
EGI
$101.1K $18.50/SF
− OpEx
−$30.3K −$5.55/SF
NOI
$70.7K $12.95/SF
Area
Hawaii County, HI
Vacancy
1.20%
Lease Rate
$18.72 /SF/Yr
Expense Ratio
30.00%
Simulate Cap Rate and NOI
Suggested Prices Based on Cap Rates
Cap Rate 5%
$1,414,820
Cap Rate 7%
$1,010,586
Cap Rate 9%
$786,011
Alternative Uses
Best Use
Retail
$1.69M
$1.48M – $1.97M
NOI $118,014 @ 7.0% cap · market cap 13.49%
Second Best
Mixed Use
$1.47M
$1.29M – $1.72M
NOI $103,116 @ 7.0% cap · market cap 11.78%
Theoretical Best
Specialty Retail
$1.86M
$1.63M – $2.18M
NOI $130,533 @ 7.0% cap · market cap 14.92%
Zoning and permitted uses should be independently verified with authorities.
How Realmo checks its estimates
Property Analytics
Unlock full access to Insights
Subscribe to Realmo Intelligence
Open Analytics
Current Use
Location Intelligence
Demographics for 96720, HI
46,615
Population
19,826
Households
2.4
Avg Household Size
43
Median Age
34%
College-Educated
95%
High-School Grad
287.8 sq mi
ZIP Area
162
Density / Sq Mi
$78,537
Median Household Income
$41,268
Median Earnings
$1,346
Median Rent
$458,100
Median Home Value
Check the figures for this property
Cap Rate, Value Estimation, Potential NOI and more
View Realmo Analytics
Market
Vacancy Rate% for Industrial in West region

Frequently Asked Questions
What type of property is this?
Mixed-use property - The property combines residential quarters with commercial workspace and multiple storage areas.
Where is this mixed-use property located?
The property is located at 77 SILVA ST Hilo, HI.
What is the asking price?
The asking price for this property is $875,000.
What are key features of this property?
This property features: Upper‑level 4‑bedroom, 1.5‑bath home with approx. 3,000 sqft of living area; Attached commercial warehouse currently configured as an auto repair shop; Front bay measures approx. 704 sqft, with an adjacent 880 sqft section


