Cold Storage Unit with Overhead
For Sale
Contact for pricing
764 Linden Drive, Arnolds Park, IA 51331
COMMERCIAL, Arnolds Park, IA
Property Size288 SF
Price / SF$76.22
Days on Market252
Property Features for 764 Linden Drive
General Information
Property type
Commercial Sale
Property subtype
Other
Parking features
Driveway
Exterior features
Highway Access
Directions
Off County Road out on South side of Bridges Bay Cabins
Subdivision
Dickinson
Standard status
Active
APN
0721354030
Taxes and HOA fees
Tax Year
2024
Tax Description
GARAGE 30 190TH STREET GARAGES
Tax Annual Amount
250
Legal Description
GARAGE 30 190TH STREET GARAGES
Building Details
Year built
2017
Building materials
Smart Board
Roof type
Asphalt
Listing Agency:
RE/MAX Lakes Realty · RE/MAX International
(712) 336-4967
Listed By:
Aaron Jones · License #B61252
(712) 320-9442
Added: Feb 5
Changed: Oct 8
Last Checked: Oct 15 at 7:06AM
MLS# 251694
Copyright © 2026 Iowa Great Lakes Board of Realtors. All rights reserved. All information provided by the listing agent/broker is deemed reliable but is not guaranteed and should be independently verified.
Investment Insights
Based on property information with market context.
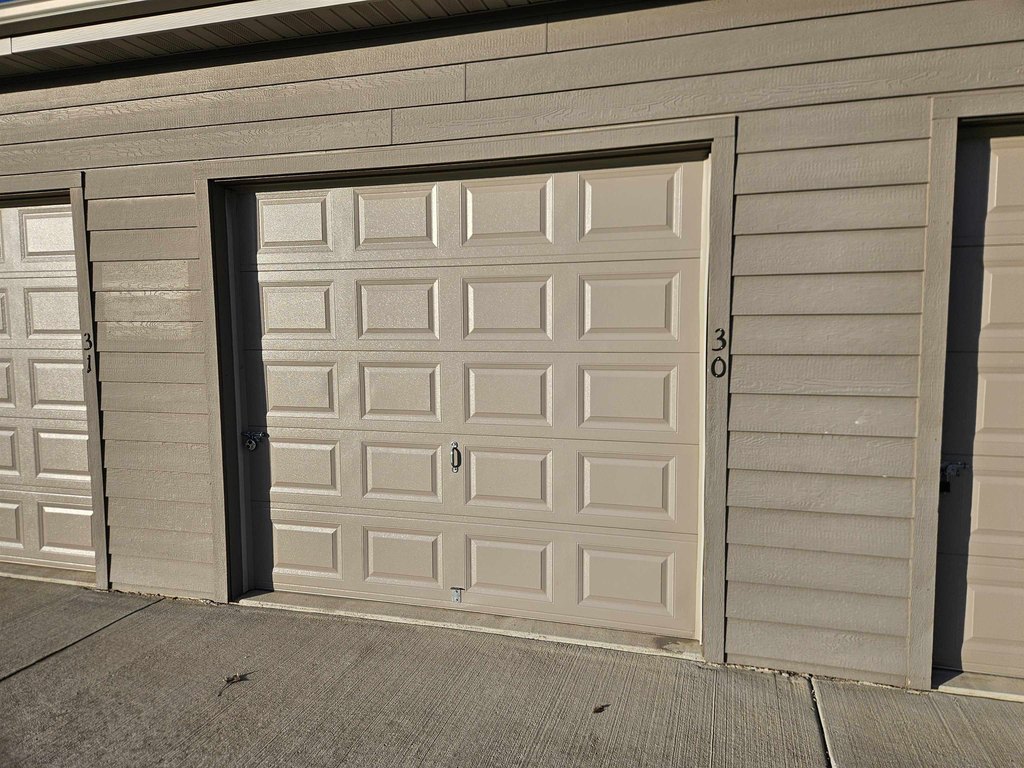
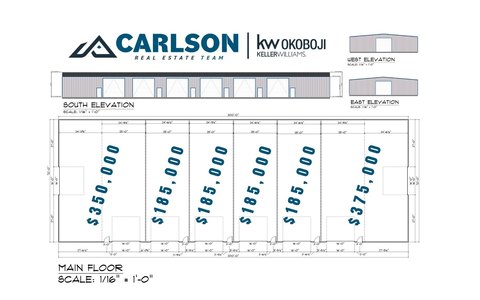
This refrigerated and cold-storage property includes a 12x24 unit with a 9x8 overhead door. The structure was built in 2017 with Smart Board construction materials, an asphalt roof, and a driveway for on-site access.
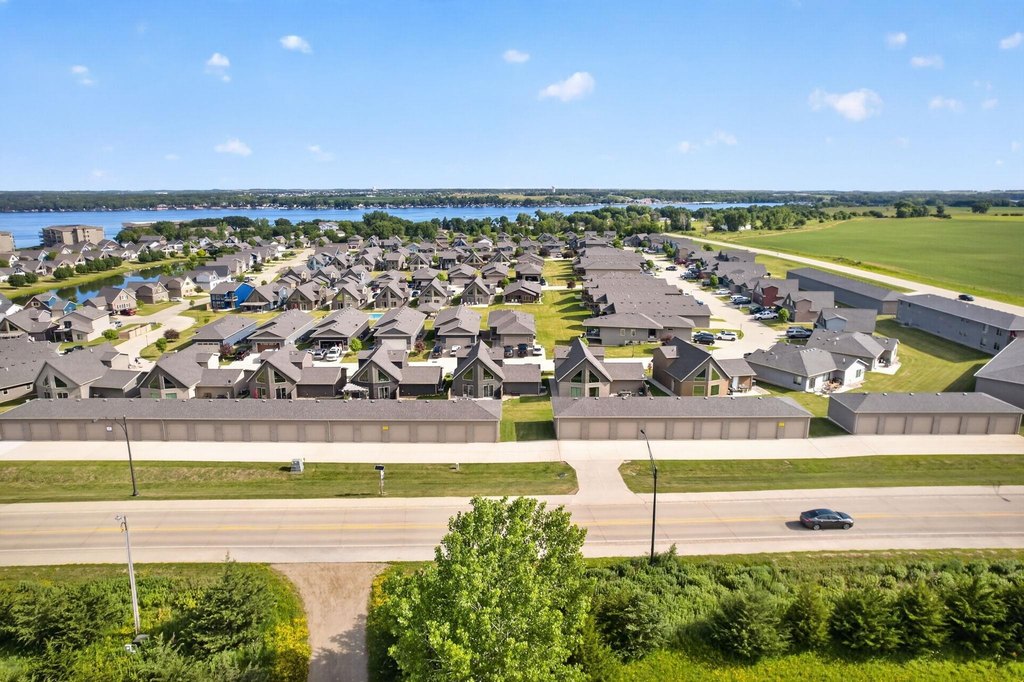
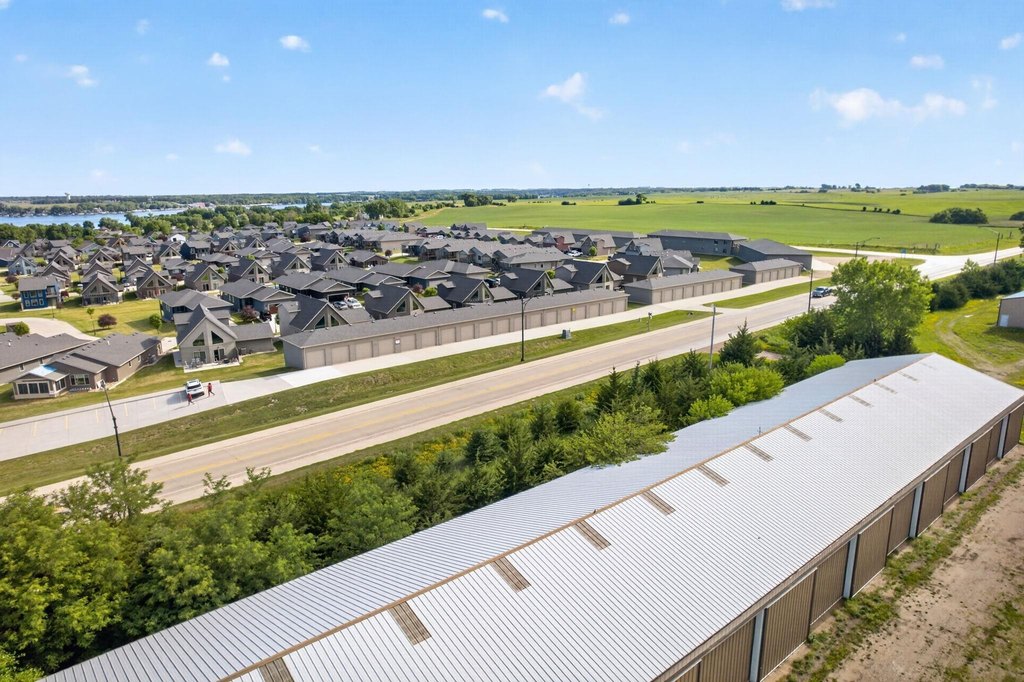
The unit is located at 764 Linden Drive in Arnolds Park, along the county road at Bridges Bay Resort. Highway access is identified as an exterior feature. Multiple units may be purchased and combined, providing flexibility for expanded cold-storage needs.
The unit is located at 764 Linden Drive in Arnolds Park, along the county road at Bridges Bay Resort. Highway access is identified as an exterior feature. Multiple units may be purchased and combined, providing flexibility for expanded cold-storage needs.
Key Highlights
- 12x24 refrigerated and cold‑storage unit
- 9x8 overhead door
- Built in 2017 with Smart Board construction
Financial Insights
Estimated NOI and Cap Rate
NOI / Yr
$1,585
Cap Rate
7.22%
Suggested Prices Based on Cap Rates
Cap Rate 5%
$31,700
$31.7K
Cap Rate 7%
$22,643
$22.6K
Cap Rate 9%
$17,611
$17.6K
Market Conditions
NOI Build-Up for 288 SF
Gross rent
$2.0K $6.96/SF
− Vacancy
−$140 −$0.49/SF
EGI
$1.9K $6.47/SF
− OpEx
−$280 −$0.97/SF
NOI
$1.6K $5.50/SF
Area
Dickinson County, IA
Vacancy
7.00%
Lease Rate
$6.96 /SF/Yr
Expense Ratio
15.00%
Simulate Cap Rate and NOI
Suggested Prices Based on Cap Rates
Cap Rate 5%
$31,700
Cap Rate 7%
$22,643
Cap Rate 9%
$17,611
Alternative Uses
Best Use
Warehouse
$22.6K
$19.8K – $26.4K
NOI $1,585 @ 7.0% cap · market cap 7.22%
Second Best
—
—
no second resolved use
Theoretical Best
Office A
$63.0K
$55.1K – $73.5K
NOI $4,410 @ 7.0% cap · market cap 20.09%
Zoning and permitted uses should be independently verified with authorities.
How Realmo checks its estimates
Property Analytics
Unlock full access to Insights
Subscribe to Realmo Intelligence
Open Analytics
Current Use
Lease Details
Yes
Paved road access
Location Intelligence
Trade Area within ½ mile
31
Businesses Nearby
Explore this area
Business Placement
Demographics for 51331, IA
1,102
Population
1,622
Households
0.7
Avg Household Size
61
Median Age
42%
College-Educated
98%
High-School Grad
1.6 sq mi
ZIP Area
689
Density / Sq Mi
$84,615
Median Household Income
$41,765
Median Earnings
$718
Median Rent
$415,800
Median Home Value
Check the figures for this property
Cap Rate, Value Estimation, Potential NOI and more
View Realmo Analytics
Market
Vacancy Rate% for Industrial in Midwest region

Questions? Ask Rey
Realmo’s AI knows this listing — price, zoning, demand, history. Ask anything.


Frequently Asked Questions
What type of property is this?
Refrigerated & cold storage - Refrigerated storage unit with highway access, driveway parking, and potential to combine multiple units.
Where is this refrigerated & cold storage located?
The property is located at 764 Linden Drive Arnolds Park, IA.
What are key features of this property?
This property features: 12x24 refrigerated and cold‑storage unit; 9x8 overhead door; Built in 2017 with Smart Board construction



