Three-Unit Residential Income
For Sale
Contact for pricing
76 Ella Street, Bloomfield, NJ 07003
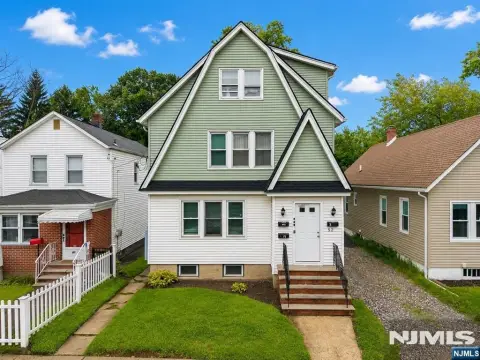
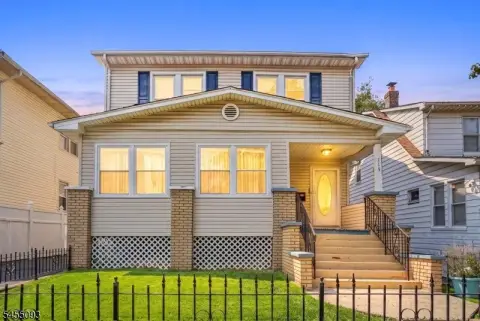
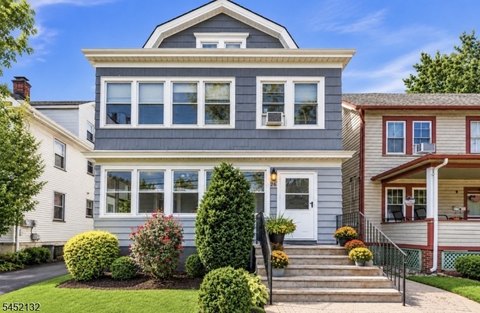
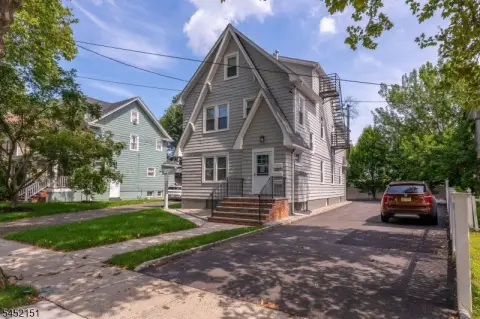
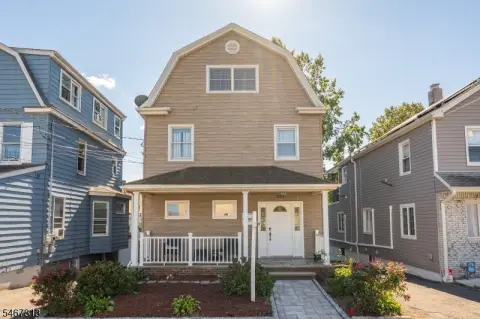
Three-story triplex with separate utilities, a renovated third-floor unit, and a rare detached 2-car garage.
Property Size2,430 SF
Lot Size0.09 Acres
Price / SF$320.16
Days on Market118
Property Features for 76 Ella Street
General Information
Standard status
Active
Size
2,430 SF
Class
C
Total Parking Spaces
8
Lot size
0.09 Acres
Property subtype
Multifamily
Zoning
R-2B
Occupancy
66%
Investment Type
Value Add
Additional Details
Multifamily Units
3
Building Details
Year Built
1928
Buildings
1
Stories
3
Units
3
Tenancy
Multi
Listing Agency:
Fairclough Realtors
Listed By:
Clayton Pannasch · License #1537153
(973) 726-7800
Source:
Crexi
Added: Jun 20
Changed: Oct 6
Last Checked: Oct 15 at 12:01AM
Displayed information is deemed reliable but is not guaranteed and should be independently verified. All listing content including descriptions, pricing, images are the copyrighted material of Fairclough Realtors

Ask AI about this property
Review the available facts, identify missing information and prepare questions for the agent.
Investment Insights
Based on property information with market context.
76 Ella Street is a three-unit residential income property built in 1928. The three-story frame building totals 3,265 sf and sits on a 36 x 107 lot. The configuration includes two 2BR/1BA units and one renovated 1BR/1BA unit on the third floor. Each unit is served by separate utilities, supporting straightforward resident management and billing.
The property also includes a detached 2-car garage and an exclusive 6-car driveway, an uncommon amenity in Bloomfield’s dense residential grid. Bloomfield offers direct NJ Transit access to Penn Station via the Morristown line, and the Watsessing Avenue NJ Transit station is described as a 3-minute walk from the building.
For investors, the mix of unit sizes and the presence of a recently renovated 1BR/1BA unit can support a diversified tenant profile. The offering is also positioned around below-market rents, with the public remarks noting recent multifamily rent growth in the Bloomfield submarket since 2022 and sub-30-day vacancy at turnover. As presented, this is a residential income asset with practical day-to-day operational structure and established commuter-oriented tenancy.
The property also includes a detached 2-car garage and an exclusive 6-car driveway, an uncommon amenity in Bloomfield’s dense residential grid. Bloomfield offers direct NJ Transit access to Penn Station via the Morristown line, and the Watsessing Avenue NJ Transit station is described as a 3-minute walk from the building.
For investors, the mix of unit sizes and the presence of a recently renovated 1BR/1BA unit can support a diversified tenant profile. The offering is also positioned around below-market rents, with the public remarks noting recent multifamily rent growth in the Bloomfield submarket since 2022 and sub-30-day vacancy at turnover. As presented, this is a residential income asset with practical day-to-day operational structure and established commuter-oriented tenancy.
Key Highlights
- Three‑unit residential income property built in 1928, with 3,265 SF on a 36x107 lot
- Unit mix: two 2BR/1BA units plus a renovated third‑floor 1BR/1BA unit
- Detached 2‑car garage plus exclusive 6‑car driveway—described as rare in Bloomfield’s dense residential grid
Financial Insights
Estimated NOI and Cap Rate
NOI / Yr
$40,669
Cap Rate
5.23%
Suggested Prices Based on Cap Rates
Cap Rate 5%
$813,380
$813.4K
Cap Rate 7%
$580,986
$581.0K
Cap Rate 9%
$451,878
$451.9K
Market Conditions
NOI Build-Up for 2,430 SF
Gross rent
$62.1K $25.56/SF
− Vacancy
−$4.0K −$1.65/SF
EGI
$58.1K $23.91/SF
− OpEx
−$17.4K −$7.17/SF
NOI
$40.7K $16.74/SF
Area
Essex County, NJ
Vacancy
6.46%
Lease Rate
$25.56 /SF/Yr
Expense Ratio
30.00%
Simulate Cap Rate and NOI
Suggested Prices Based on Cap Rates
Cap Rate 5%
$813,380
Cap Rate 7%
$580,986
Cap Rate 9%
$451,878
Alternative Uses
Best Use
Multifamily LT 5
$581.0K
$508.4K – $677.8K
NOI $40,669 @ 7.0% cap · market cap 5.23%
Second Best
Apartment 5plus
$533.8K
$467.1K – $622.8K
NOI $37,369 @ 7.0% cap · market cap 4.80%
Theoretical Best
Office A
$634.5K
$555.2K – $740.3K
NOI $44,417 @ 7.0% cap · market cap 5.71%
Zoning and permitted uses should be independently verified with authorities.
How Realmo checks its estimates
Property Analytics
Unlock full access to Insights
Subscribe to Realmo Intelligence
Open Analytics
Current Use
Lease Details
3
Residential units
Location Intelligence
Trade Area within ½ mile
1,404
Businesses Nearby
Explore this area
Business Placement
Demographics for 07003, NJ
52,955
Population
21,692
Households
2.4
Avg Household Size
38
Median Age
49%
College-Educated
93%
High-School Grad
5.3 sq mi
ZIP Area
9,992
Density / Sq Mi
$98,805
Median Household Income
$56,465
Median Earnings
$1,775
Median Rent
$447,600
Median Home Value
Check the figures for this property
Cap Rate, Value Estimation, Potential NOI and more
View Realmo Analytics
Market
Vacancy Rate% for Multifamily in Northeast region





Frequently Asked Questions
What type of property is this?
Triplex - Three-story triplex with separate utilities, a renovated third-floor unit, and a rare detached 2-car garage.
Where is this triplex located?
The property is located at 76 Ella Street Bloomfield, NJ.
What is the asking price?
The asking price for this property is $778,000.
What are key features of this property?
This property features: Three‑unit residential income property built in 1928, with 3,265 SF on a 36x107 lot; Unit mix: two 2BR/1BA units plus a renovated third‑floor 1BR/1BA unit; Detached 2‑car garage plus exclusive 6‑car driveway—described as rare in Bloomfield’s dense residential grid


