Detached Duplex with
For Sale
$1,050,000
756 Hylan Boulevard, Staten Island, NY 10305
Residential, High Ranch, Staten Island, NY
Property Size2,376 SF
Lot Size0.10 Acres
Price / SF$441.92
Days on Market59
Property Features for 756 Hylan Boulevard
General Information
Property type
Residential Multi Family
Property subtype
Other
Zoning
R3-2
Bedrooms
4
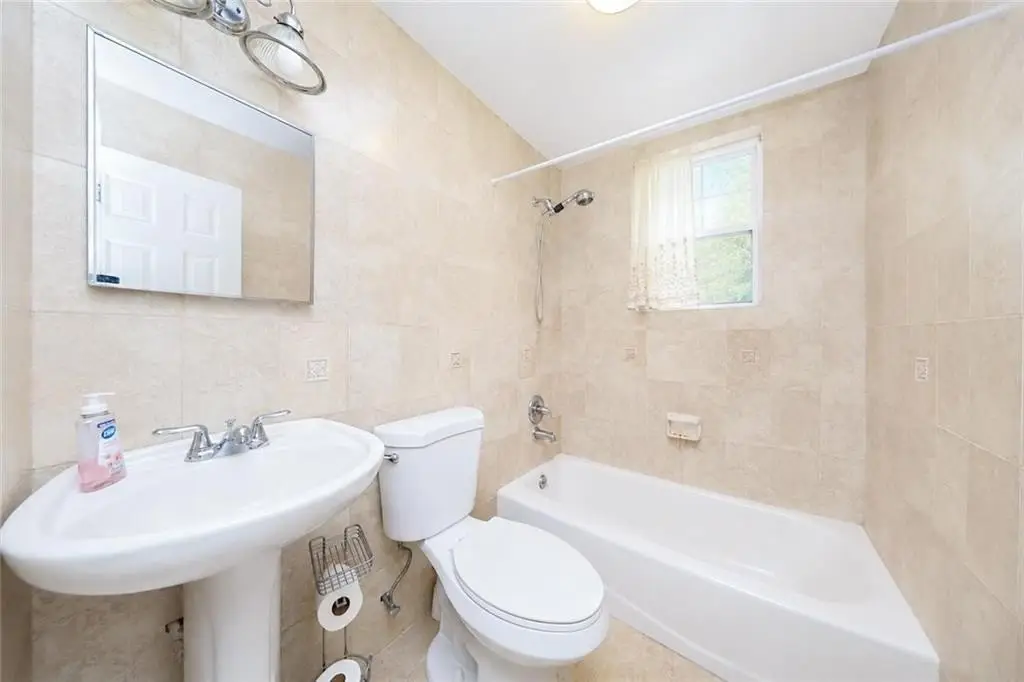
Bathrooms
3
Full bathrooms
2
Half bathrooms
1
Rooms
Bedroom 2, Bedroom 1, Bathroom 3, Bedroom 4, Bedroom 3, Bathroom 2, Bathroom 1
Interior features
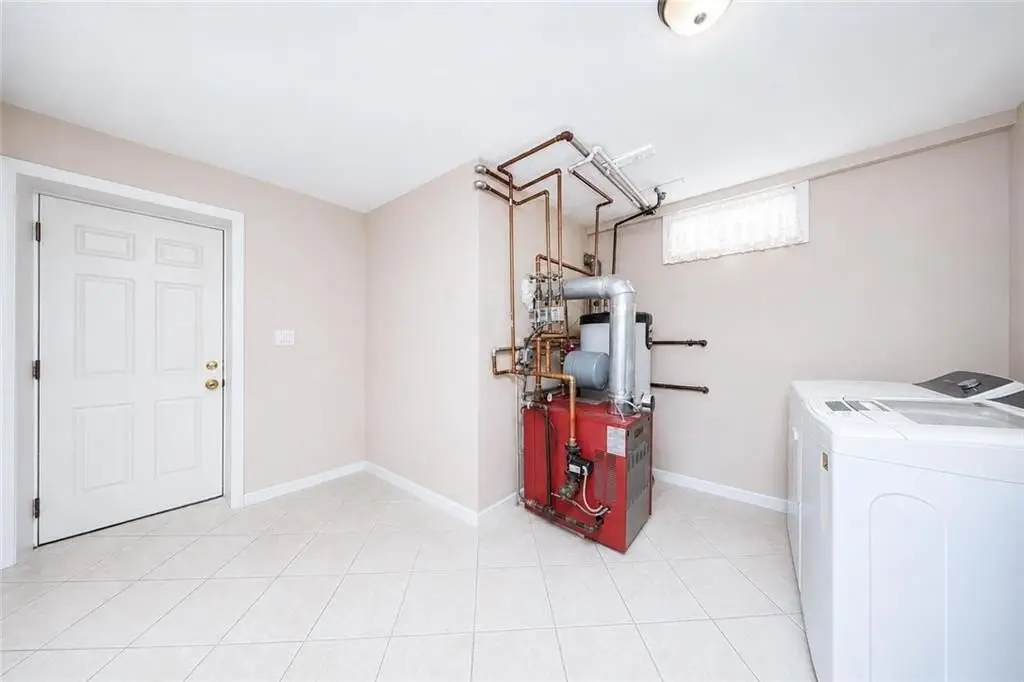
Central Air, Dishwasher, Dryer, Laundry Area, Microwave, Refrigerator, Stove, Washer
Basement
Finished, Full
Subdivision
Arrochar
Standard status
Active
Size
2,376 SF
Lot size
0.10 Acres
Taxes and HOA fees
Tax Annual Amount
4386
Building Details
Year built
1960
Floors in Building
1
Number of units
2
Flooring type
Tile, Hardwood
Building materials
Wood Frame
Architectural style
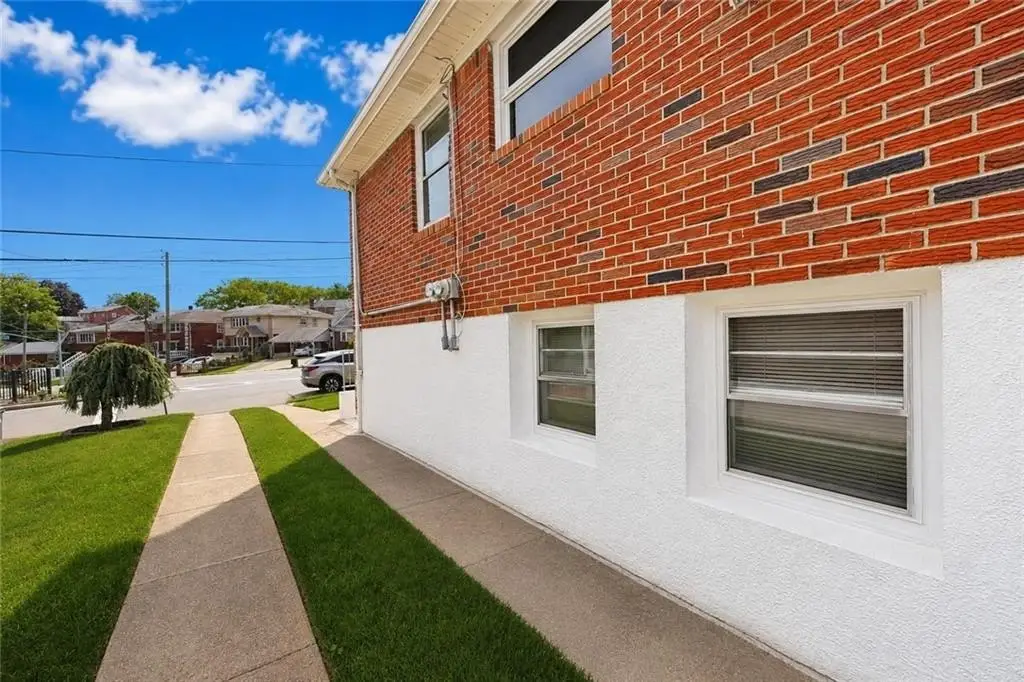
Ranch
Listing Agency:
RE/MAX Edge · RE/MAX International
(718) 612-3088
Listed By:
Jason Zhou · License #JZ1320
(347) 988-5318
Added: Aug 15
Changed: Oct 10
Last Checked: Oct 12 at 2:06PM
MLS# 503817
Copyright © 2026 Brooklyn New York Multiple Listing Service. All rights reserved. All information provided by the listing agent/broker is deemed reliable but is not guaranteed and should be independently verified.
Investment Insights
Based on property information with market context.
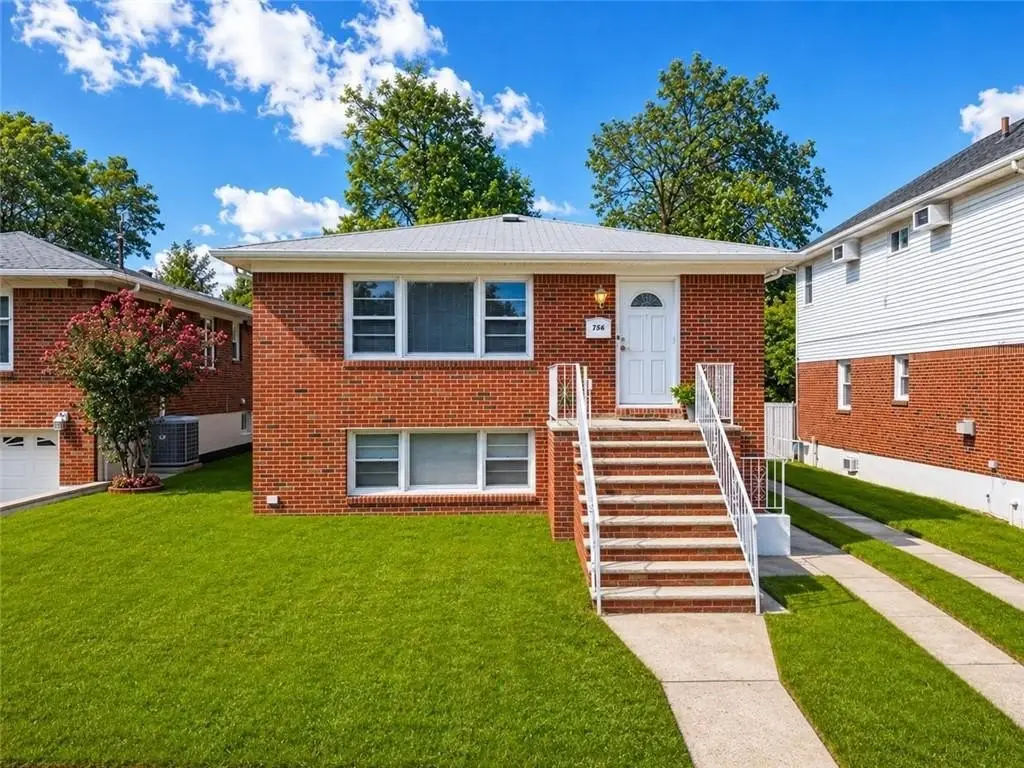
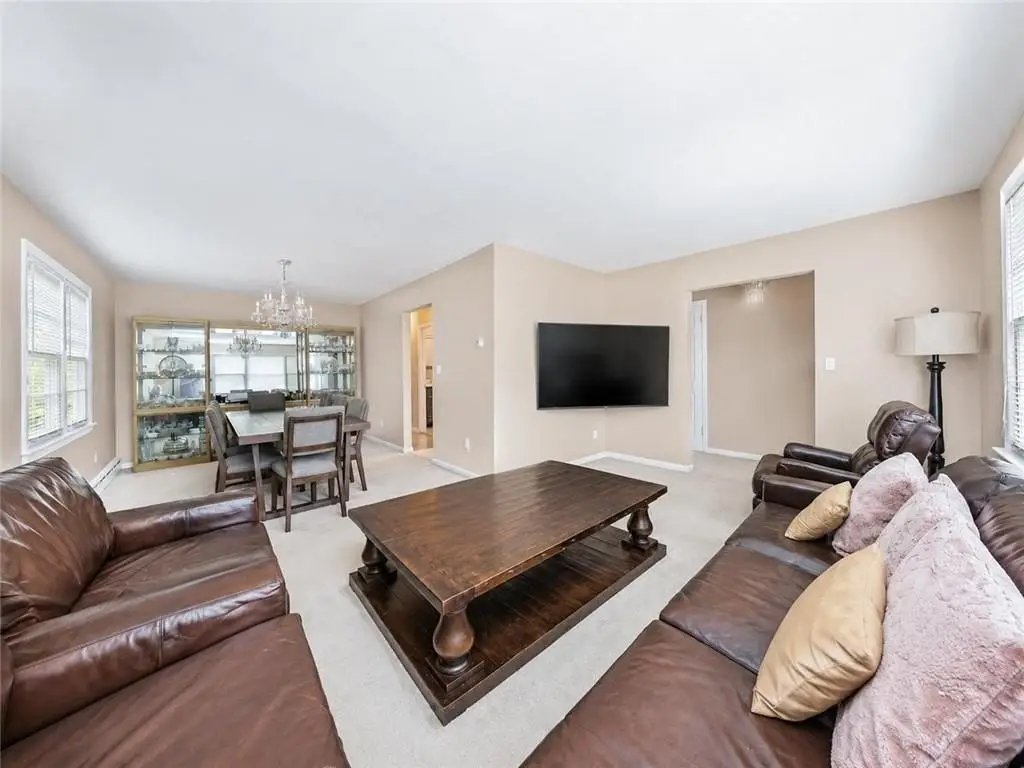
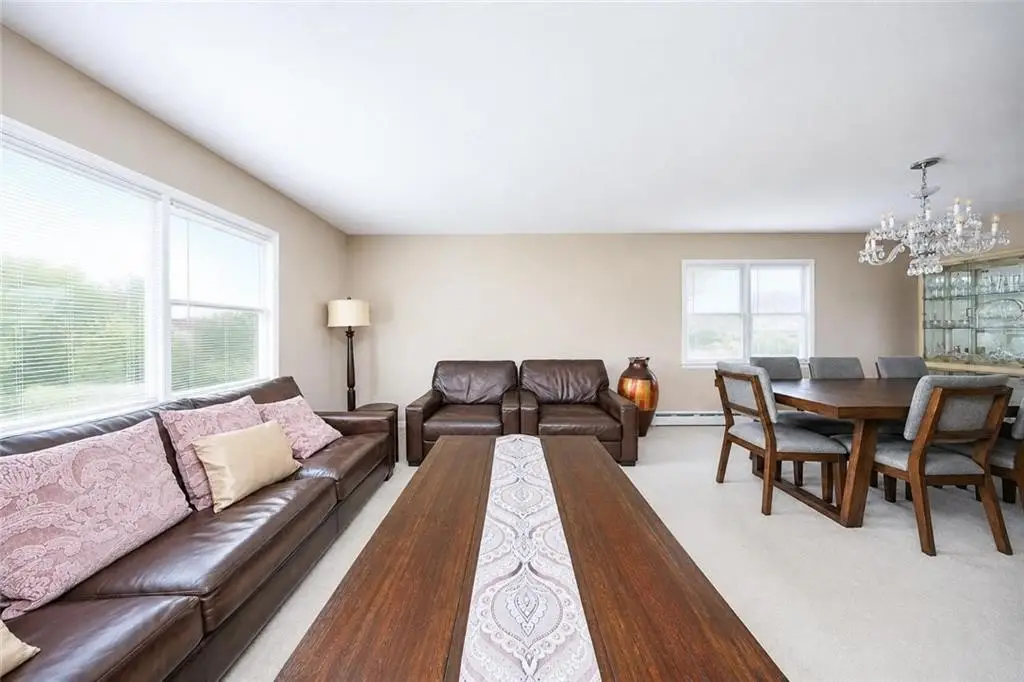
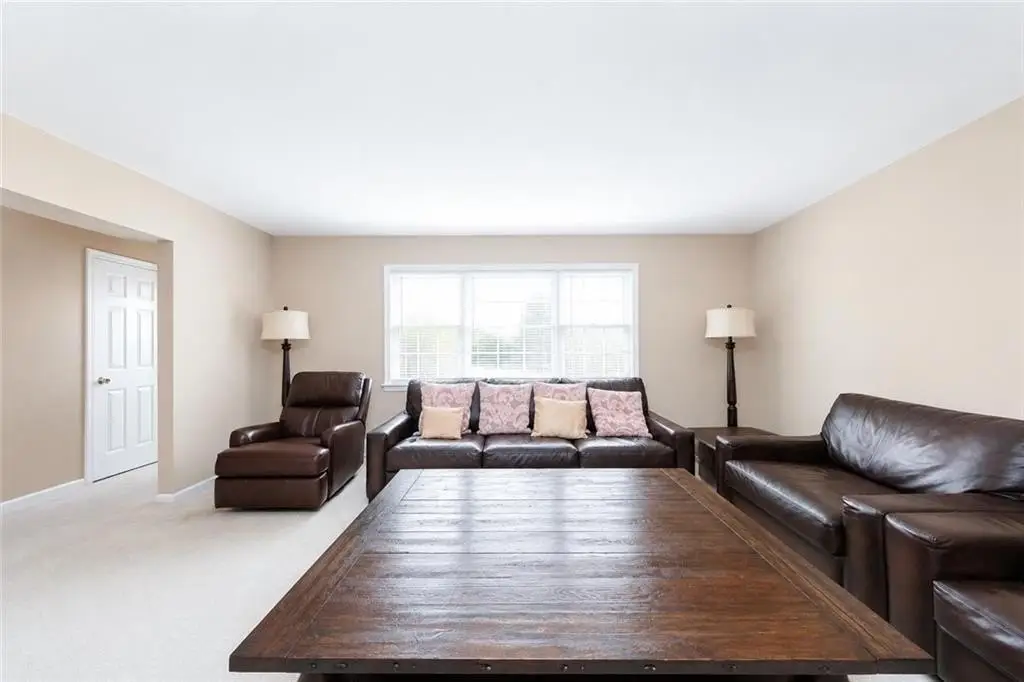
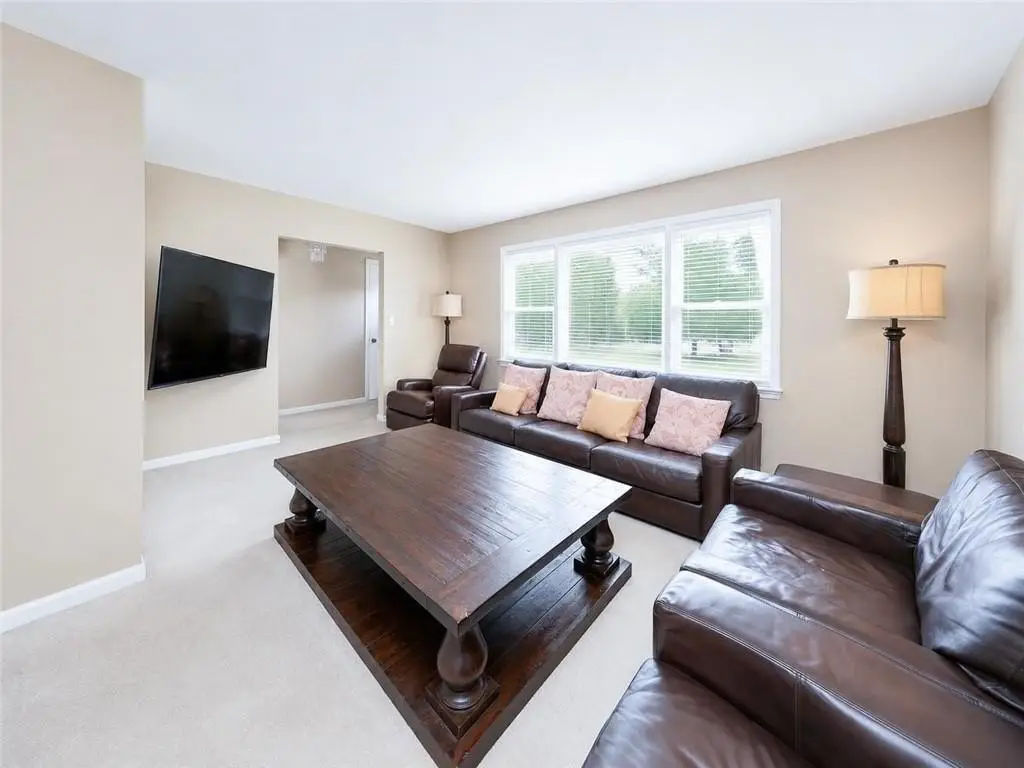
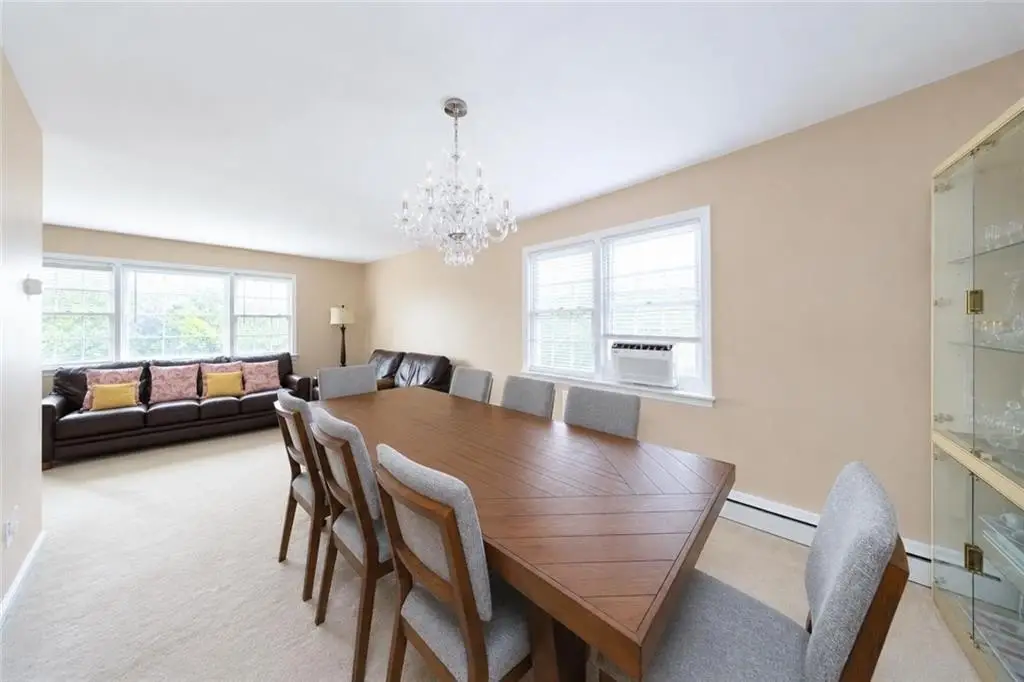
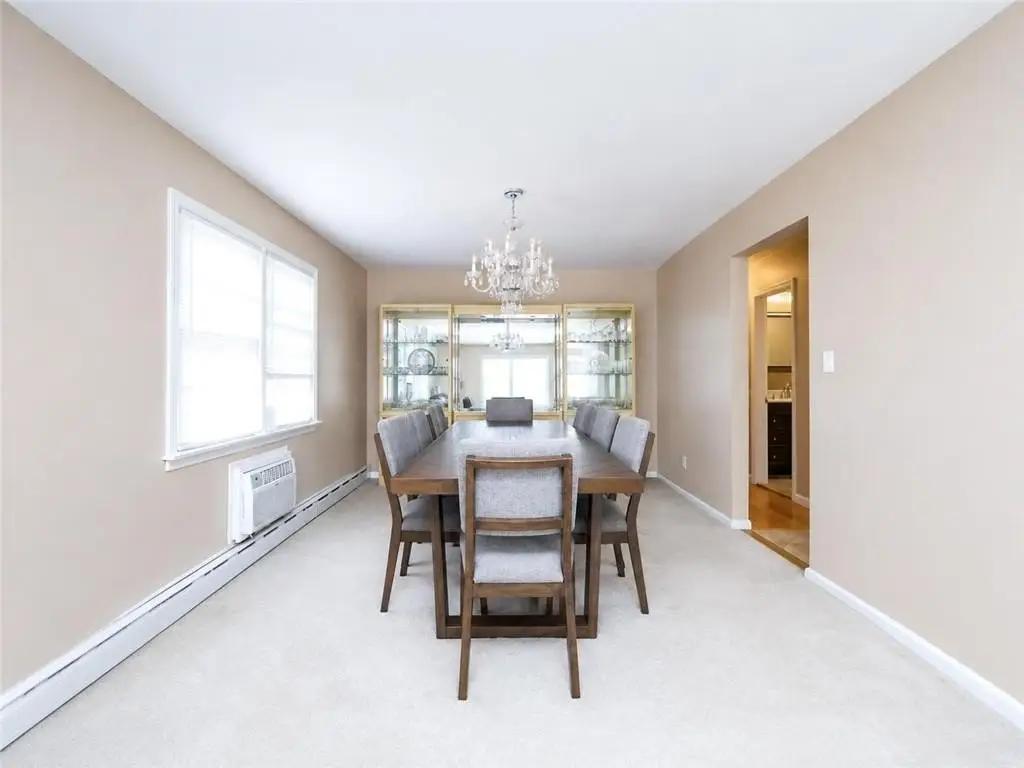
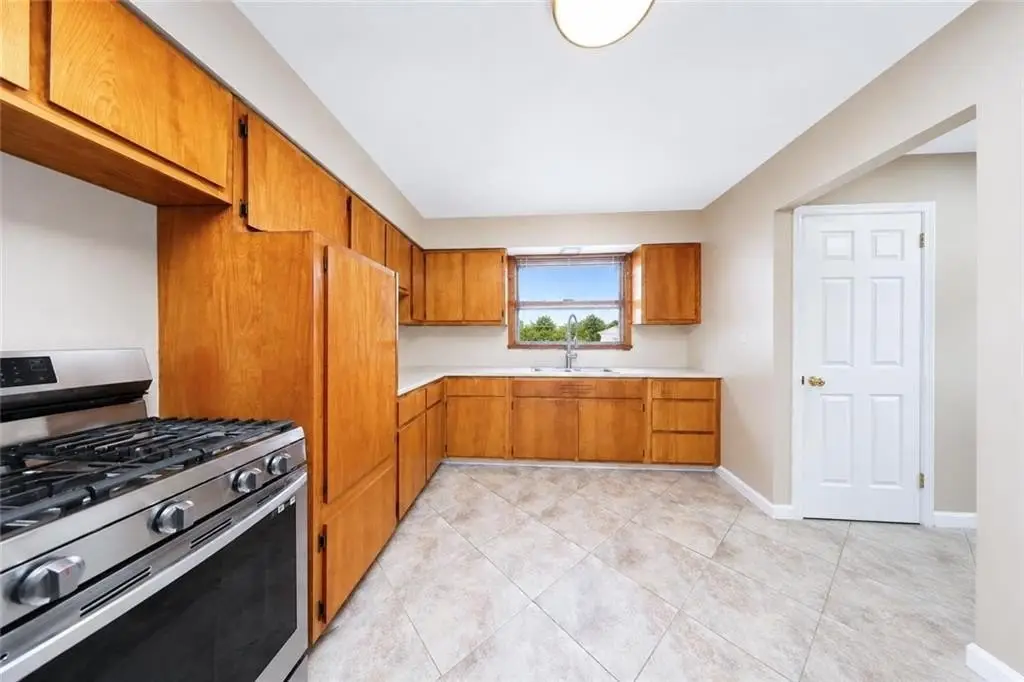
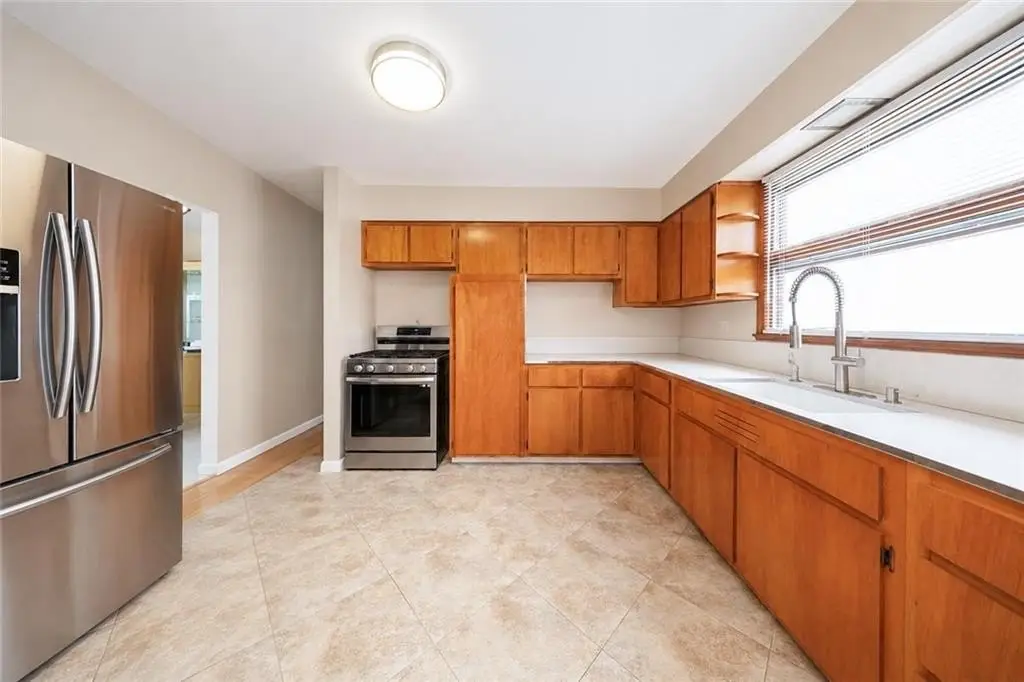
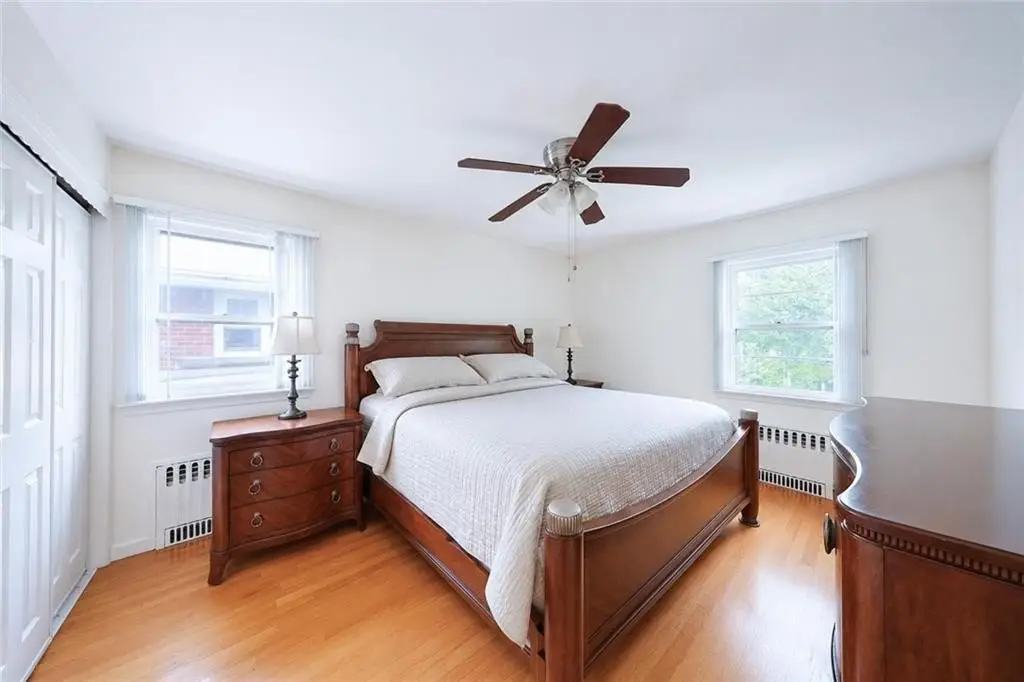
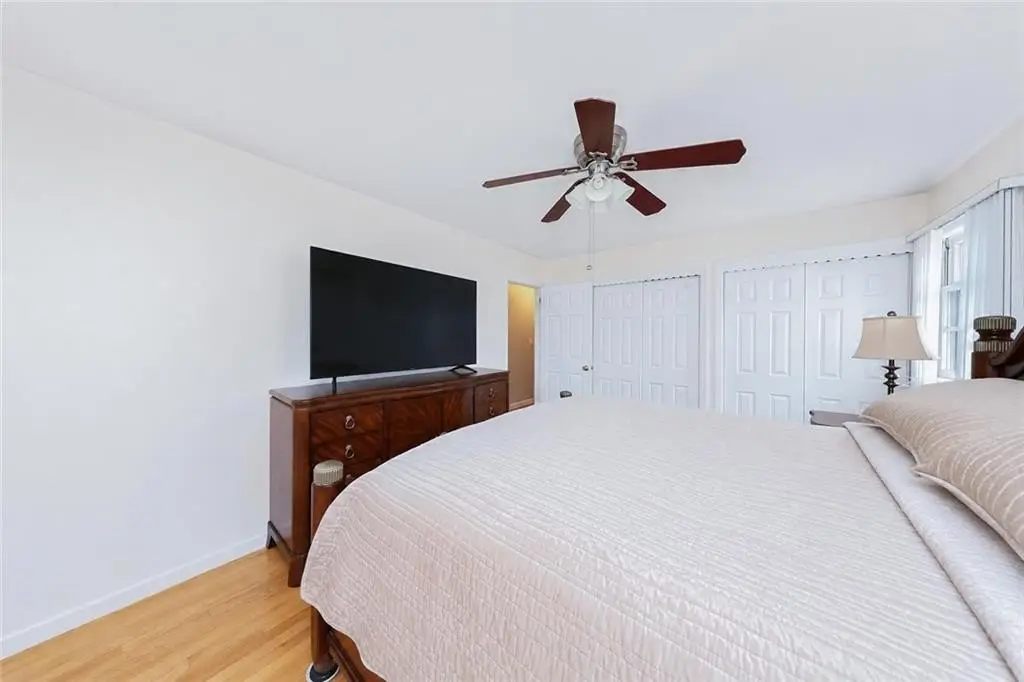
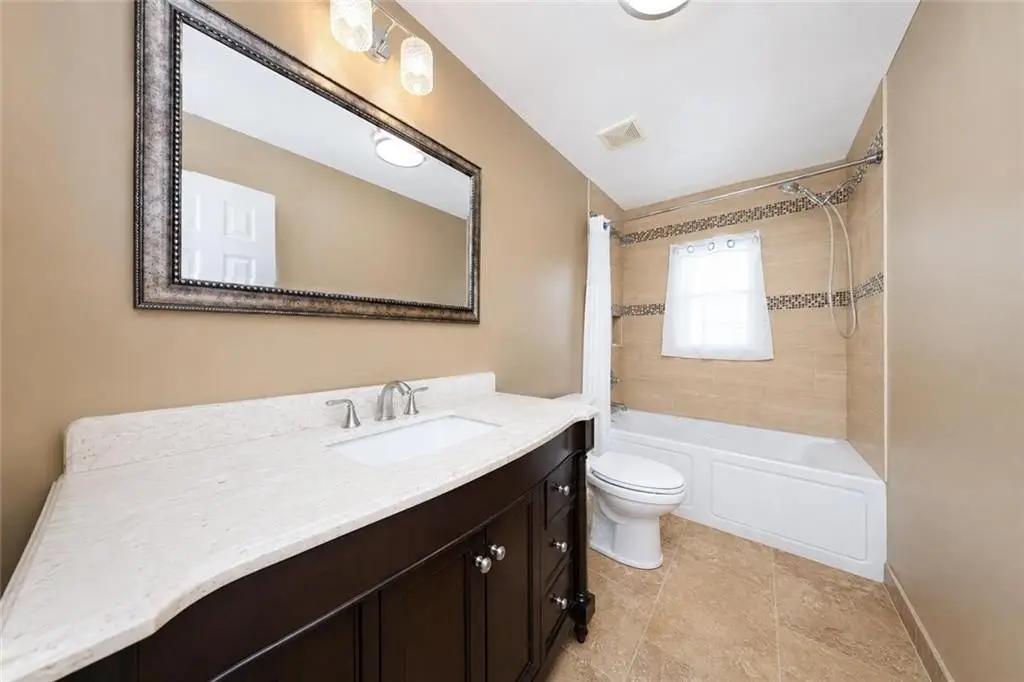
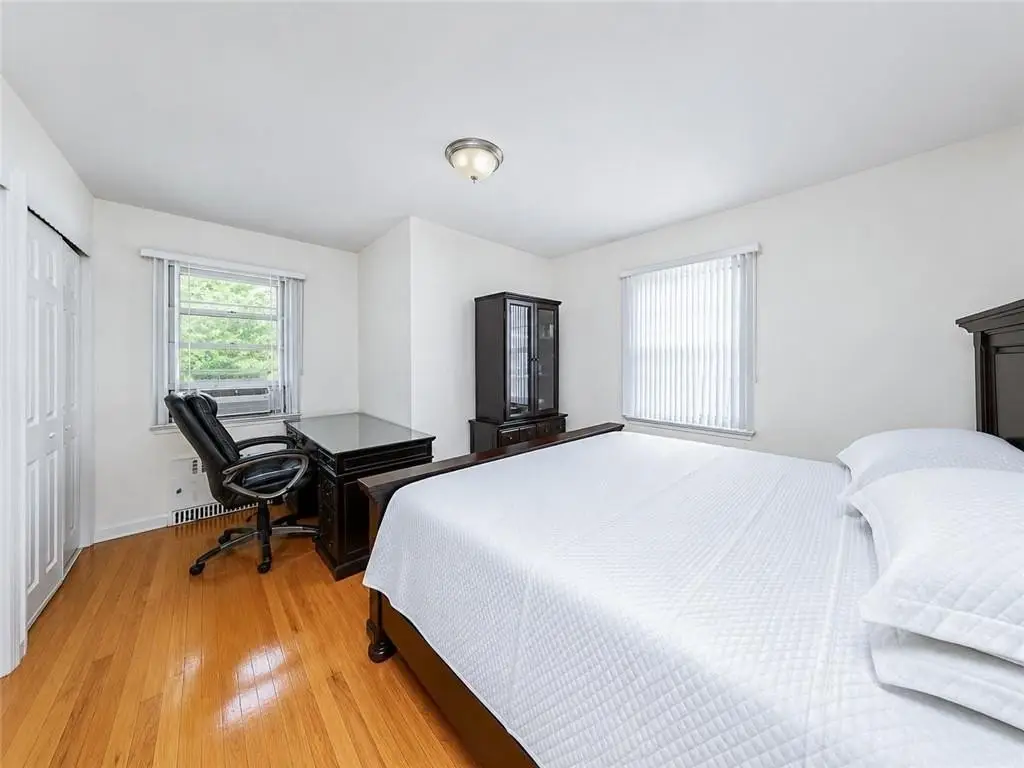
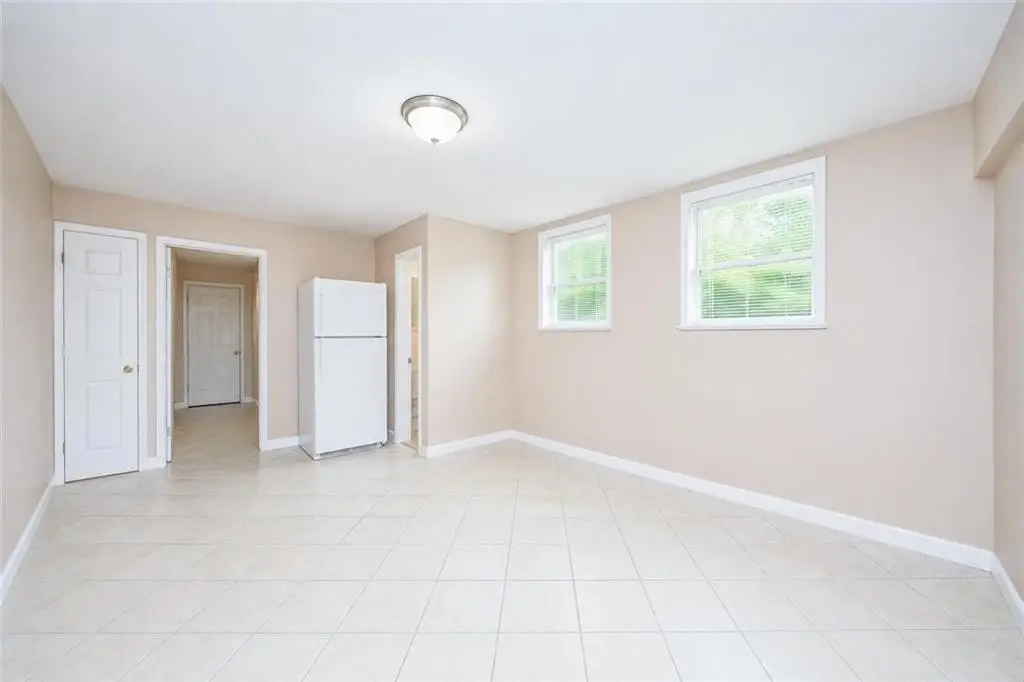
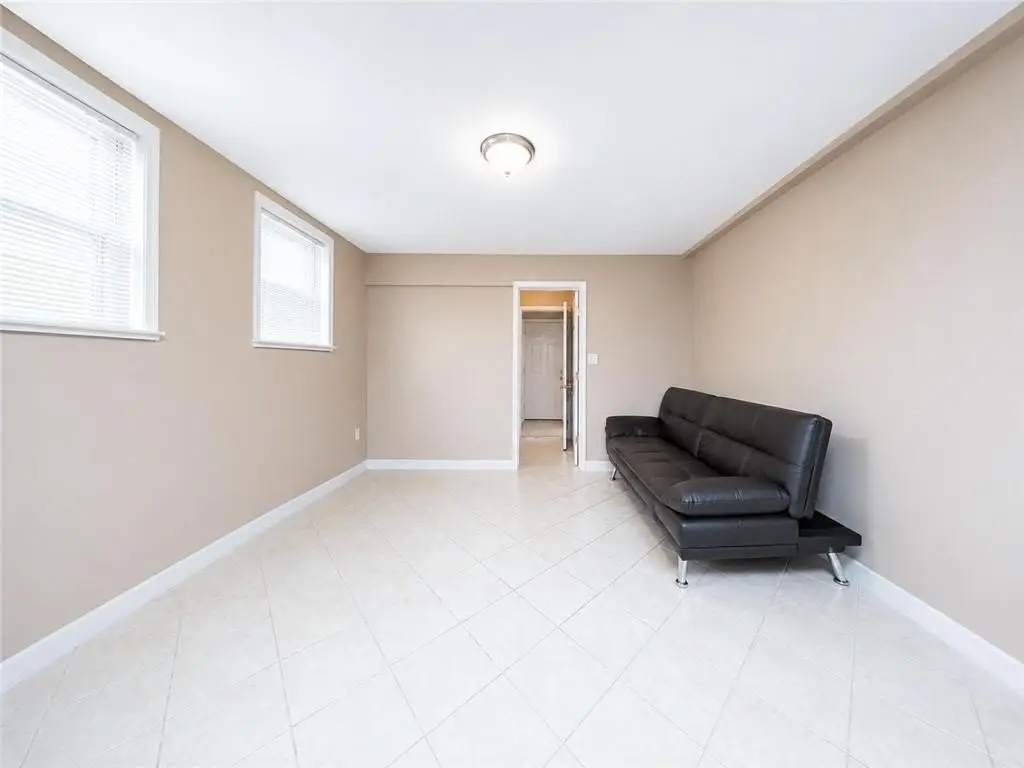
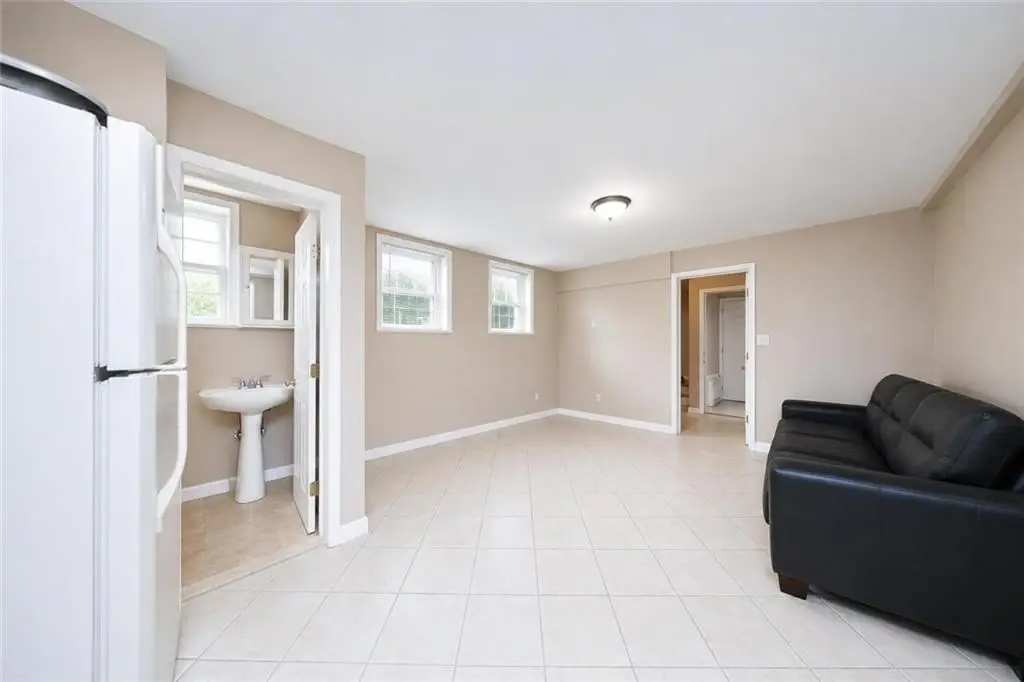
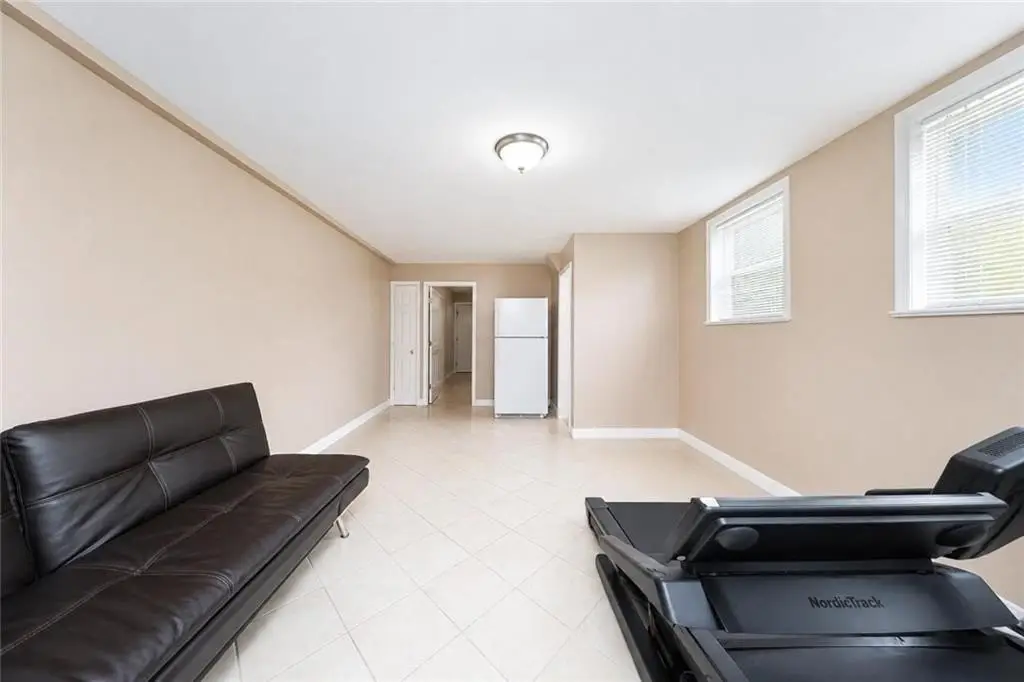
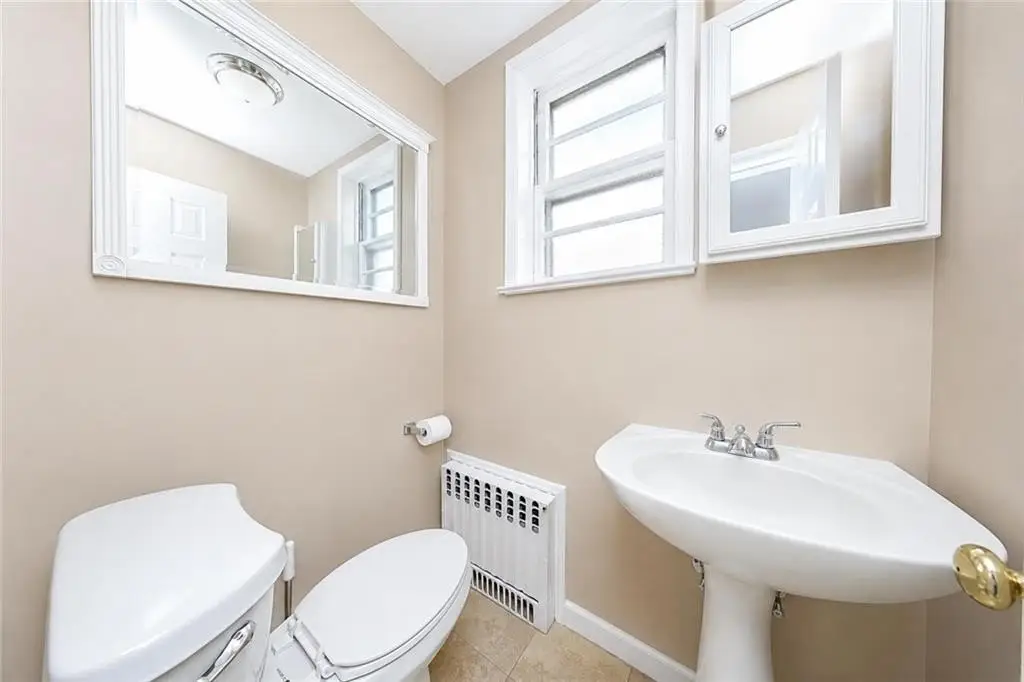
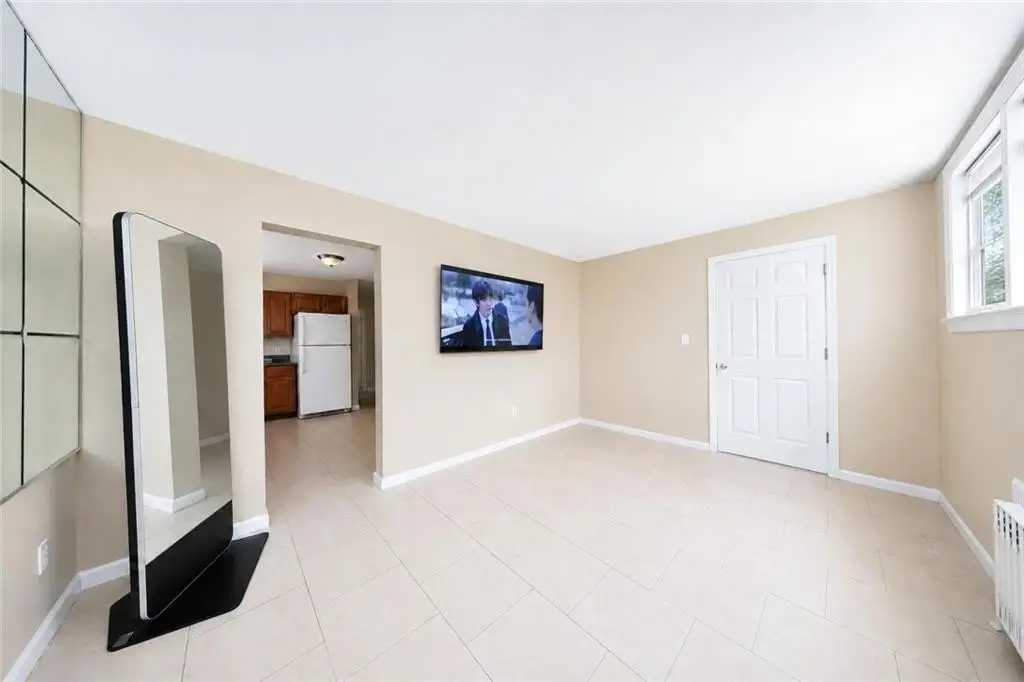
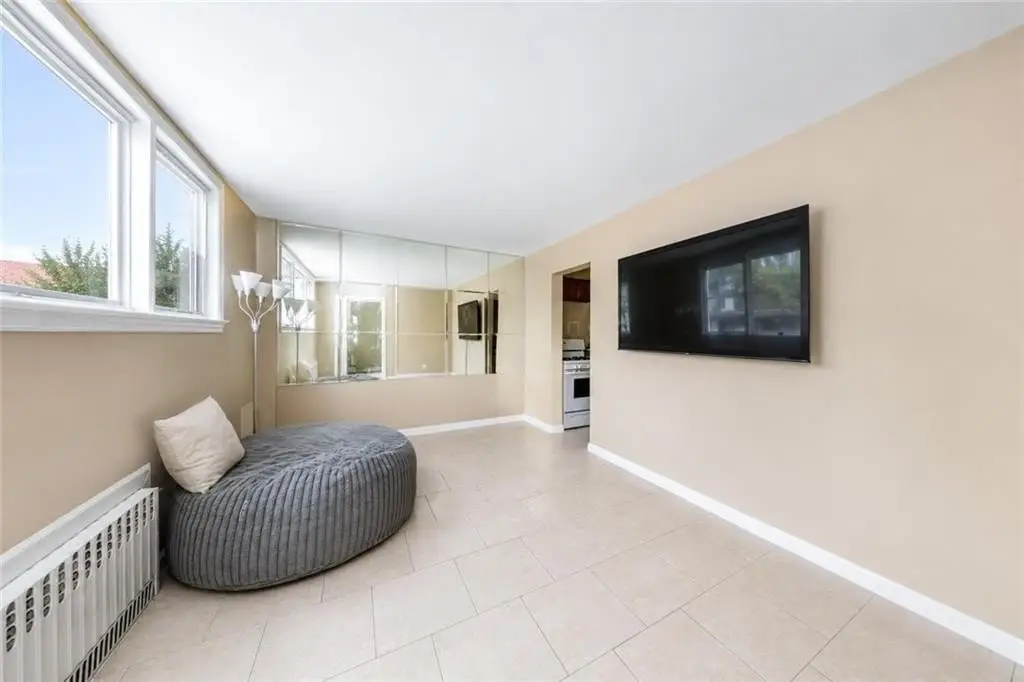
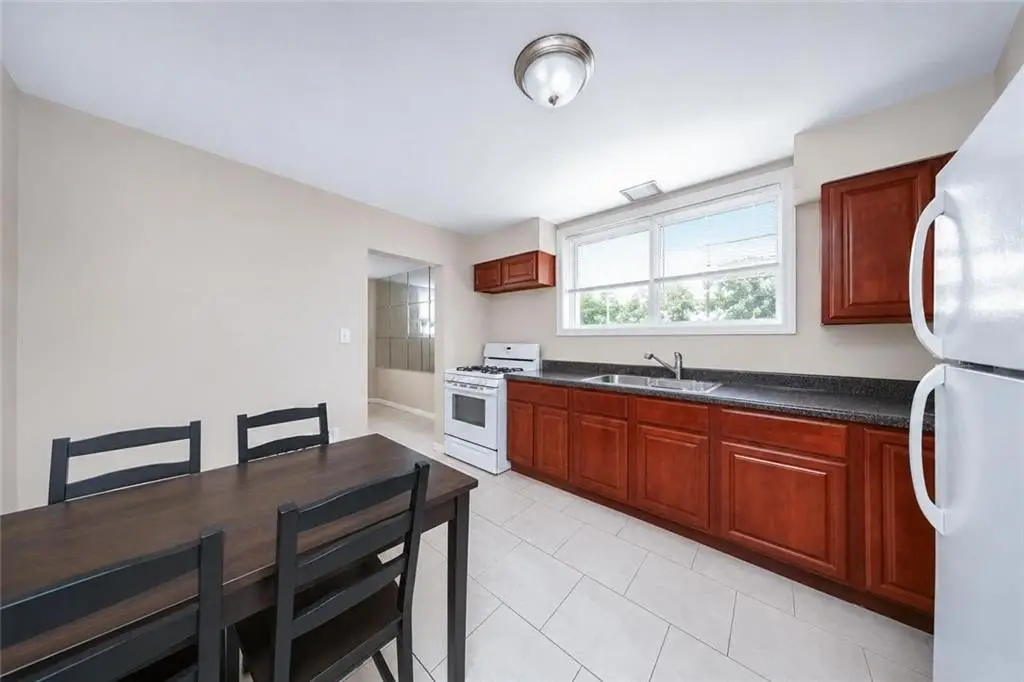
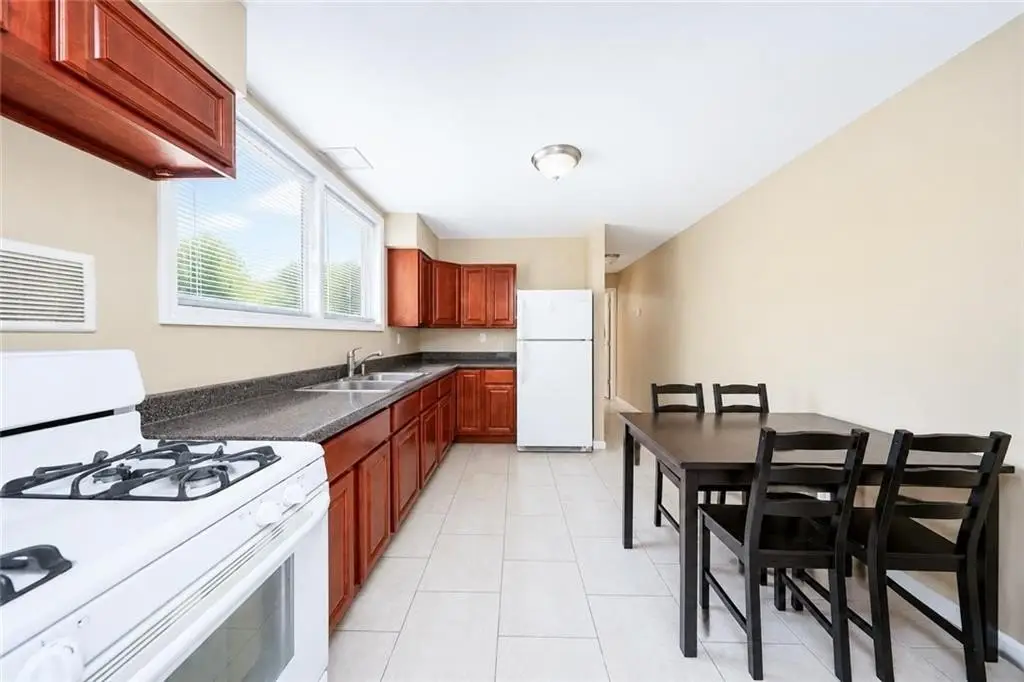
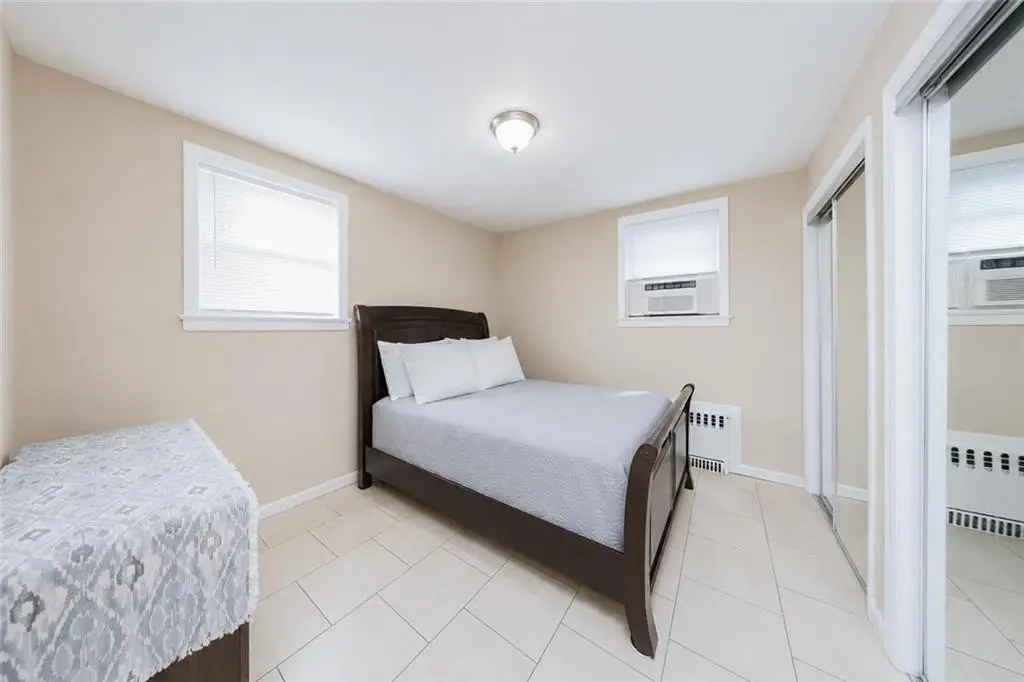
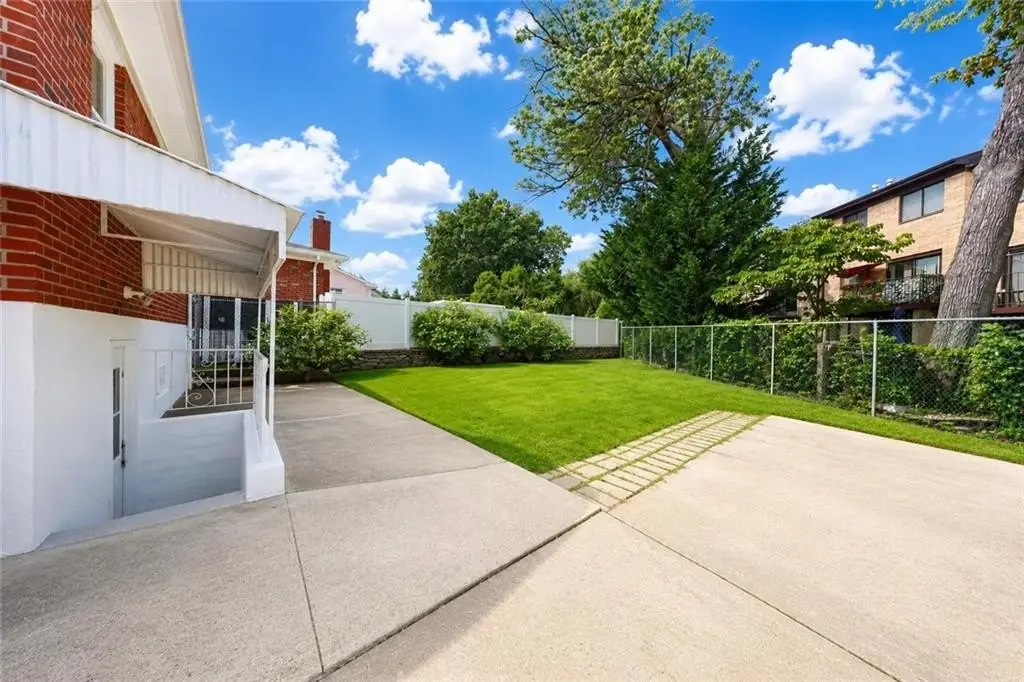
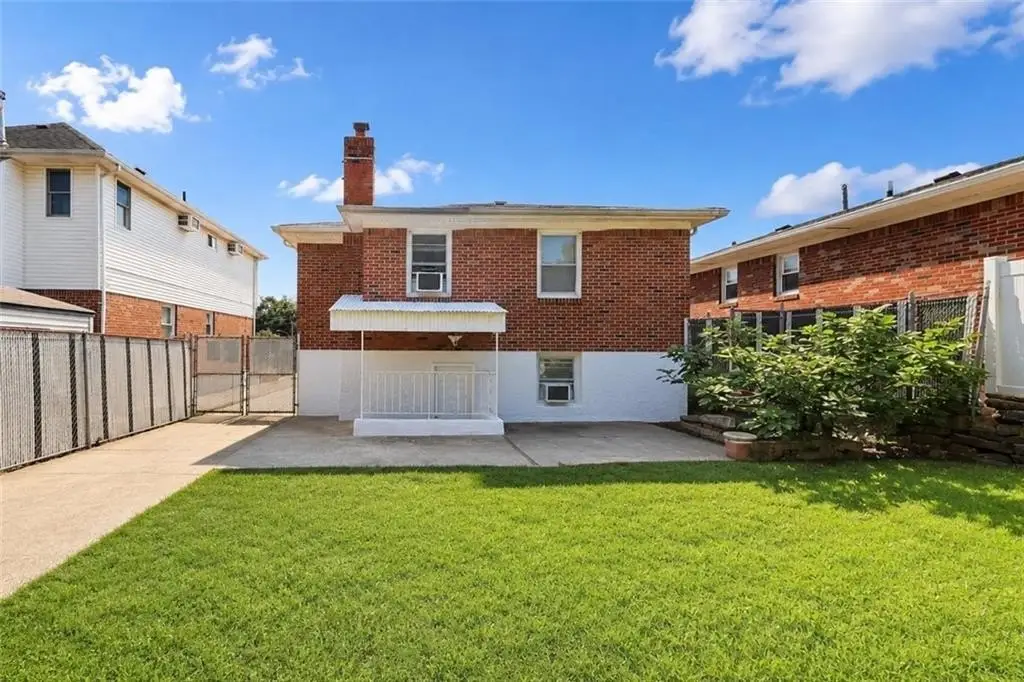
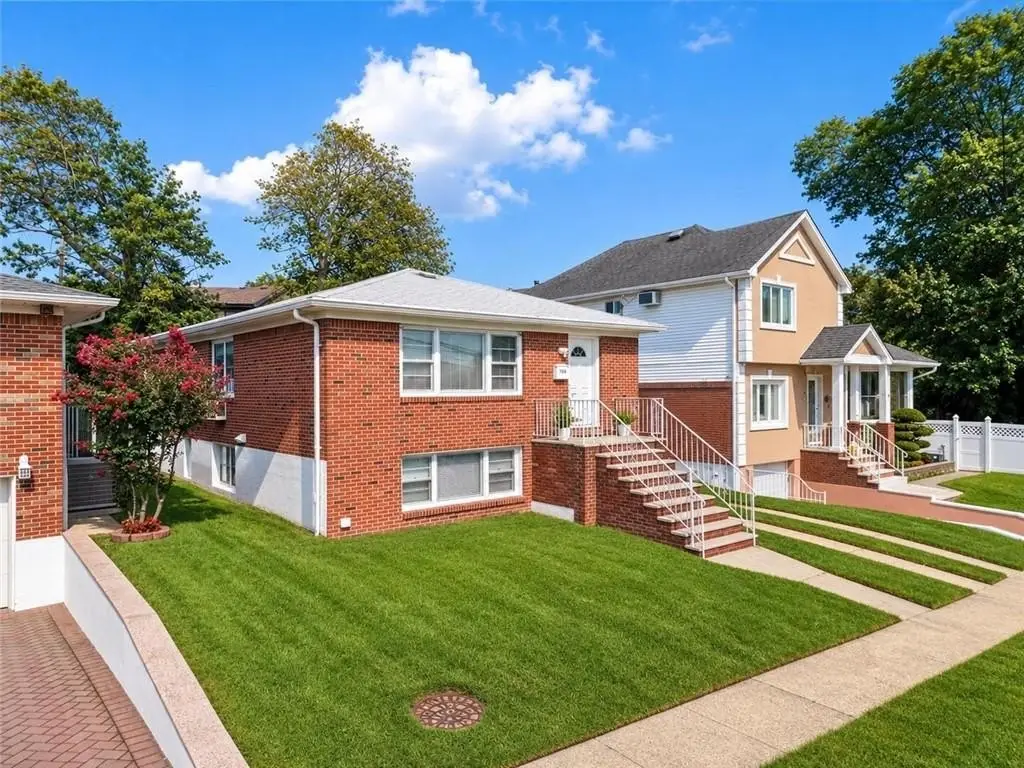
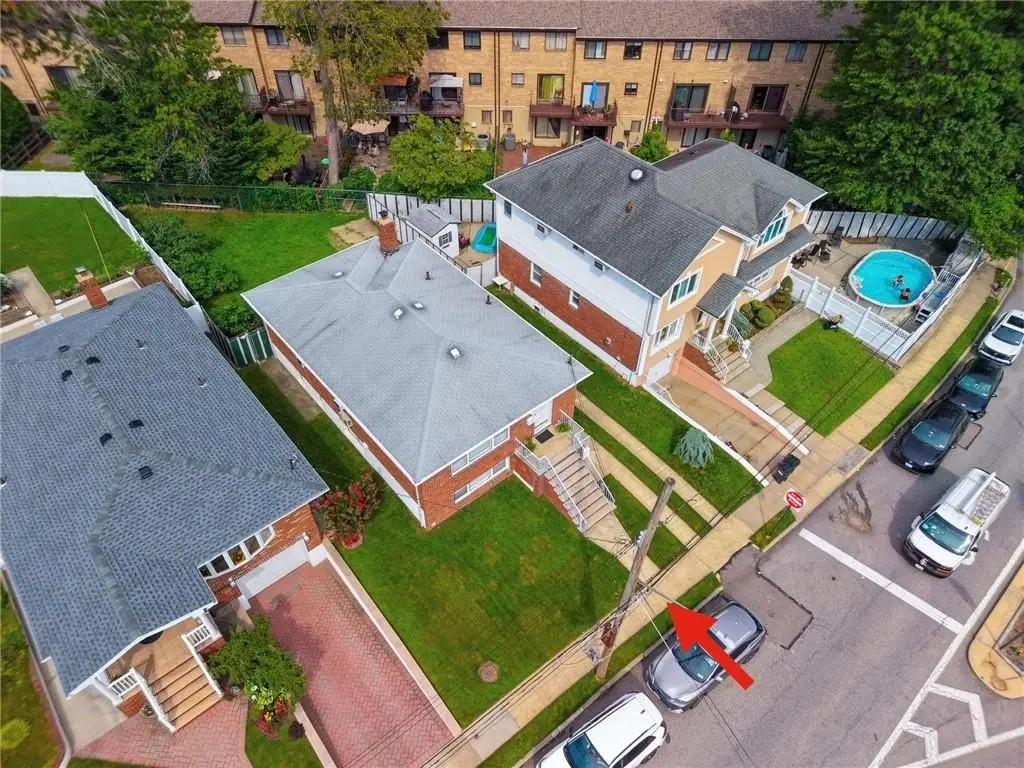
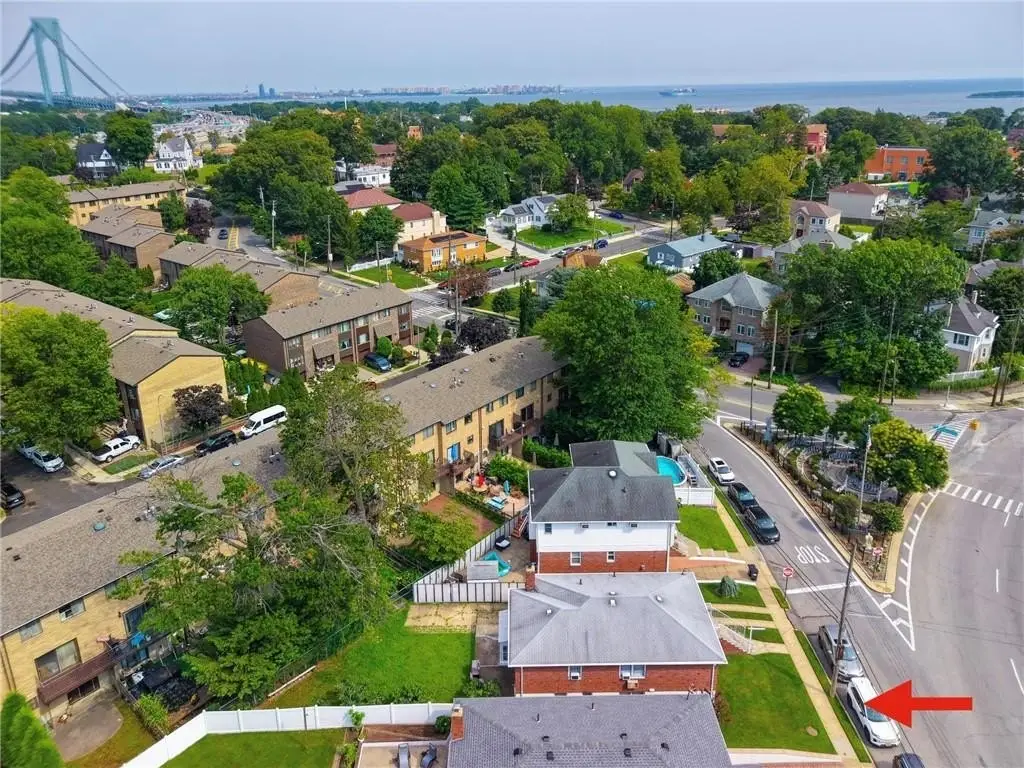
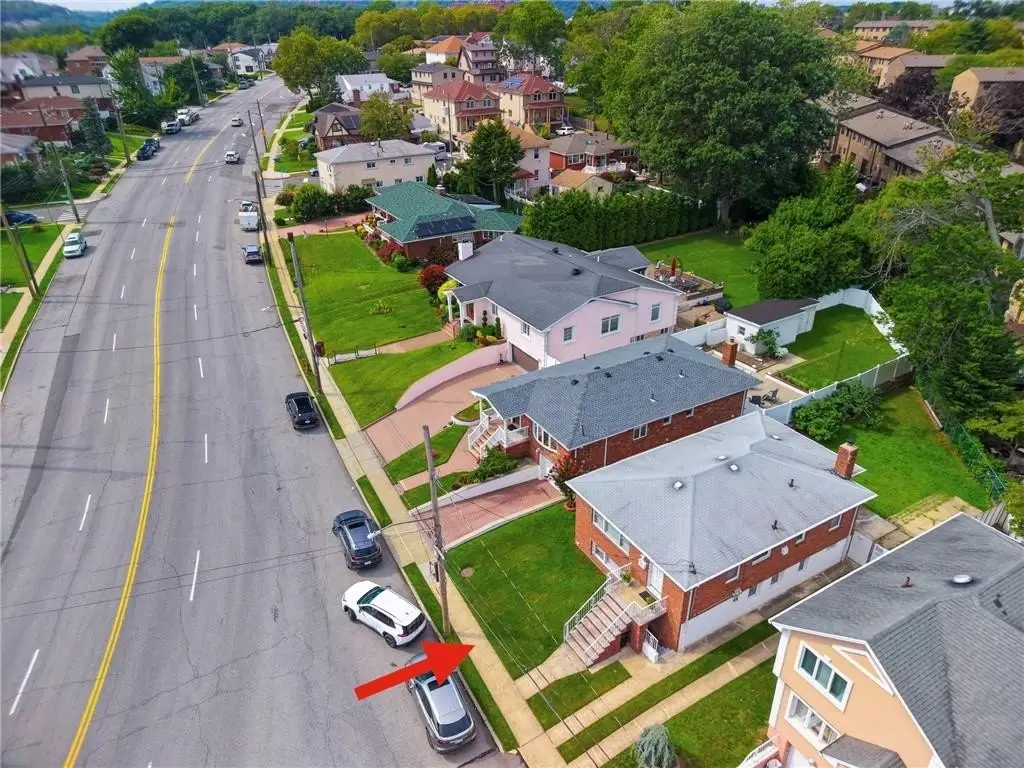
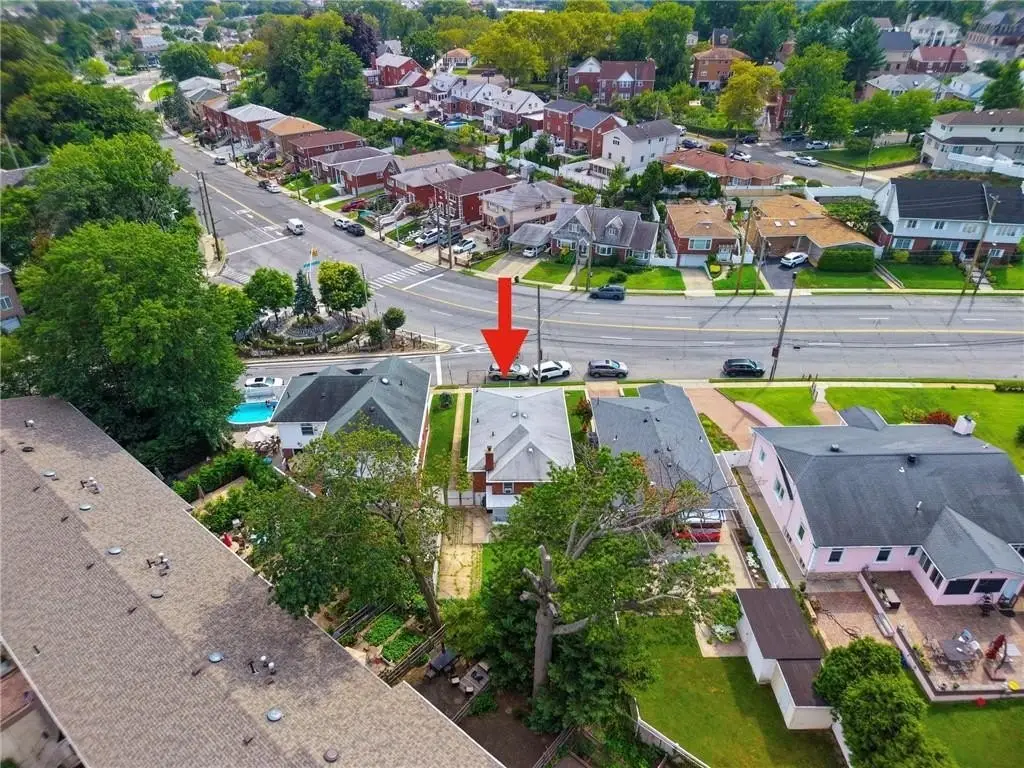
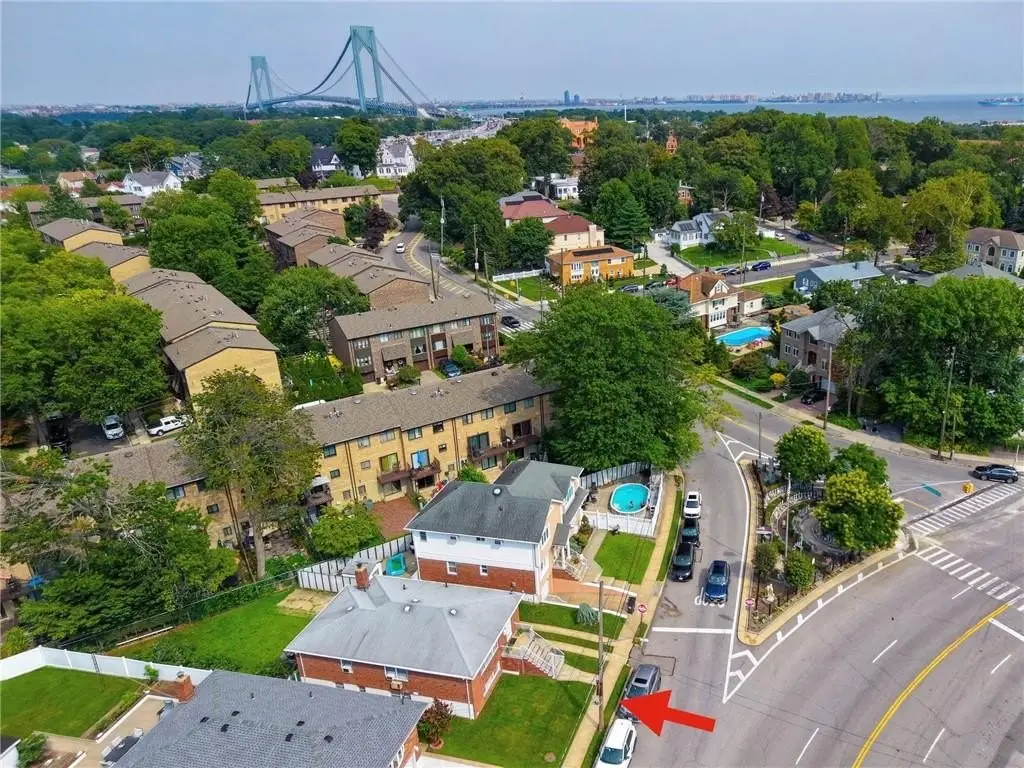
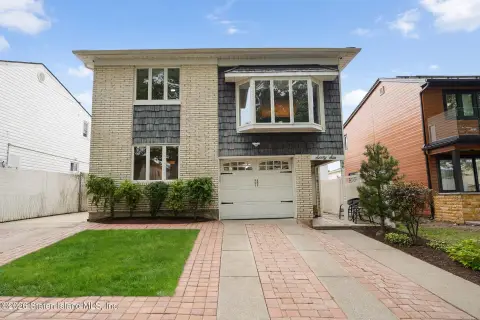
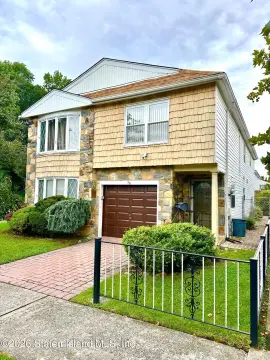
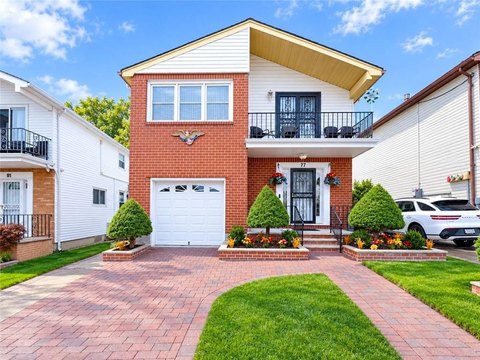
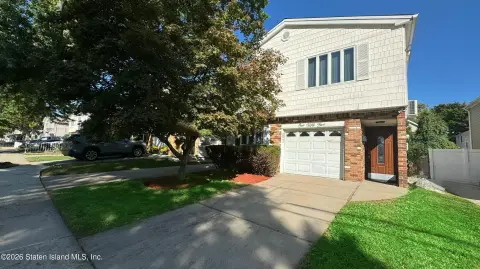
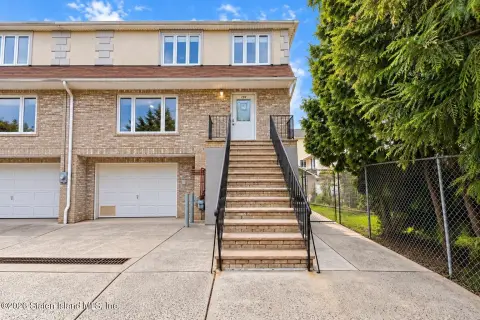
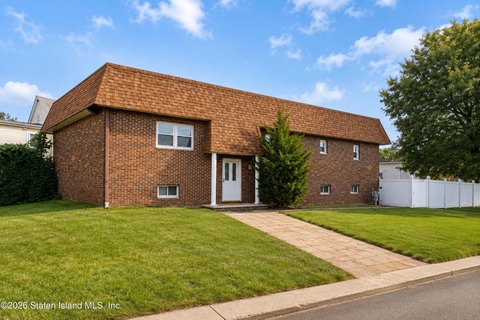
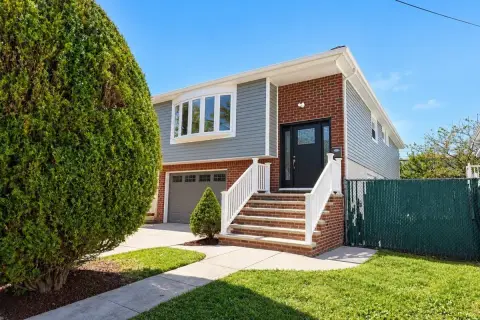
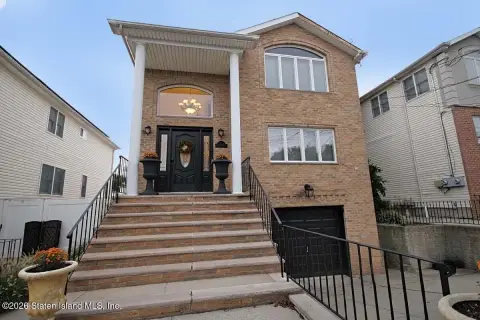
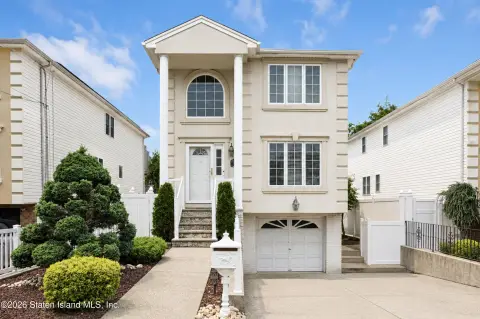
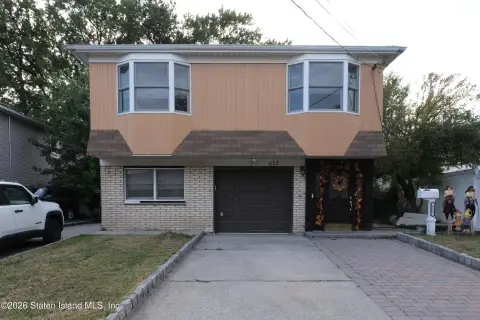
This fully detached legal two-family residence offers approximately 2,376 square feet of living space on a 0.0964-acre lot. The primary unit includes three bedrooms, 1.5 baths, hardwood flooring, a living and dining area, and an eat-in kitchen with substantial cabinetry and counter space. The second residence has one bedroom, a living room, kitchen, full bath, and its own entrance. Central air, laundry appliances, kitchen appliances, hardwood, and tile flooring are included. Built in 1960 with a ranch-style design, the home also provides multiple exposures for natural light and ventilation.
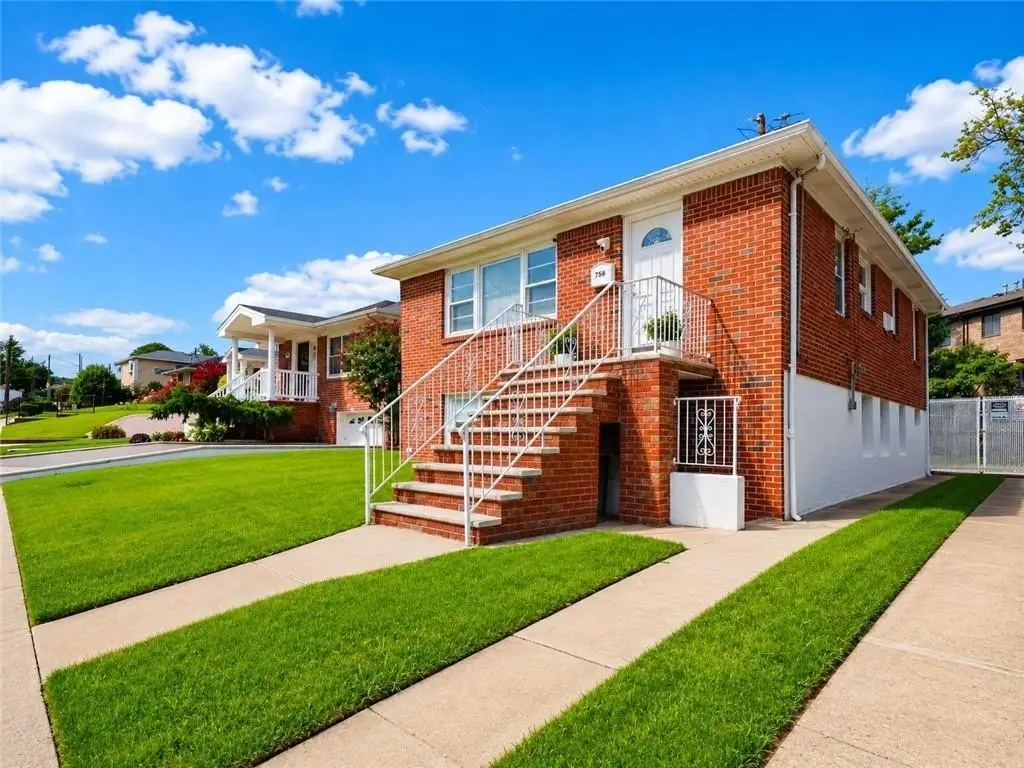
Exterior features include a private driveway, side access, separate front and rear entrances, and a spacious level backyard. The property is located at 756 Hylan Boulevard in Staten Island, minutes from the Verrazzano-Narrows Bridge, Staten Island Expressway, local and express bus service, shopping, restaurants, schools, and parks. R3-2 zoning supports the property's two-family configuration.
Exterior features include a private driveway, side access, separate front and rear entrances, and a spacious level backyard. The property is located at 756 Hylan Boulevard in Staten Island, minutes from the Verrazzano-Narrows Bridge, Staten Island Expressway, local and express bus service, shopping, restaurants, schools, and parks. R3-2 zoning supports the property's two-family configuration.
Key Highlights
- Legal two‑family detached residence with approximately 2,376 sq. ft. of living space
- Primary unit includes 3 bedrooms and 1.5 baths
- Separate 1‑bedroom unit with living room, kitchen, full bath, and private entrance
Financial Insights
Estimated NOI and Cap Rate
NOI / Yr
$62,382
Cap Rate
5.94%
Suggested Prices Based on Cap Rates
Cap Rate 5%
$1,247,640
$1.2M
Cap Rate 7%
$891,171
$891.2K
Cap Rate 9%
$693,133
$693.1K
Market Conditions
NOI Build-Up for 2,376 SF
Gross rent
$96.9K $40.80/SF
− Vacancy
−$7.8K −$3.29/SF
EGI
$89.1K $37.51/SF
− OpEx
−$26.7K −$11.25/SF
NOI
$62.4K $26.26/SF
Area
ZIP 10305
Vacancy
8.07%
Lease Rate
$40.80 /SF/Yr
Expense Ratio
30.00%
Simulate Cap Rate and NOI
Suggested Prices Based on Cap Rates
Cap Rate 5%
$1,247,640
Cap Rate 7%
$891,171
Cap Rate 9%
$693,133
Alternative Uses
Best Use
Multifamily LT 5
$891.2K
$779.8K – $1.04M
NOI $62,382 @ 7.0% cap · market cap 5.94%
Second Best
Apartment 5plus
$819.9K
$717.4K – $956.6K
NOI $57,395 @ 7.0% cap · market cap 5.47%
Theoretical Best
Office A
$1.13M
$992.0K – $1.32M
NOI $79,359 @ 7.0% cap · market cap 7.56%
Zoning and permitted uses should be independently verified with authorities.
How Realmo checks its estimates
Property Analytics
Unlock full access to Insights
Subscribe to Realmo Intelligence
Open Analytics
Current Use
Lease Details
2
Residential units
Yes
Highway access
Location Intelligence
Trade Area within ½ mile
731
Businesses Nearby
Explore this area
Business Placement
Demographics for 10305, NY
44,008
Population
16,850
Households
2.6
Avg Household Size
41
Median Age
32%
College-Educated
85%
High-School Grad
4.0 sq mi
ZIP Area
11,002
Density / Sq Mi
$86,294
Median Household Income
$52,183
Median Earnings
$1,656
Median Rent
$627,200
Median Home Value
Check the figures for this property
Cap Rate, Value Estimation, Potential NOI and more
View Realmo Analytics
Market
Vacancy Rate% for Multifamily in Northeast region

Questions? Ask Rey
Realmo’s AI knows this listing — price, zoning, demand, history. Ask anything.
Frequently Asked Questions
What type of property is this?
Duplex - Legal two-family residence with a private driveway, separate entrances, and a second unit suited for rental income.
Where is this duplex located?
The property is located at 756 Hylan Boulevard Staten Island, NY.
What is the asking price?
The asking price for this property is $1,050,000.
What are key features of this property?
This property features: Legal two‑family detached residence with approximately 2,376 sq. ft. of living space; Primary unit includes 3 bedrooms and 1.5 baths; Separate 1‑bedroom unit with living room, kitchen, full bath, and private entrance


