Two-Family Residential Income
For Sale
$1,395,000
75 Coolidge Ave, Stamford, CT 06906
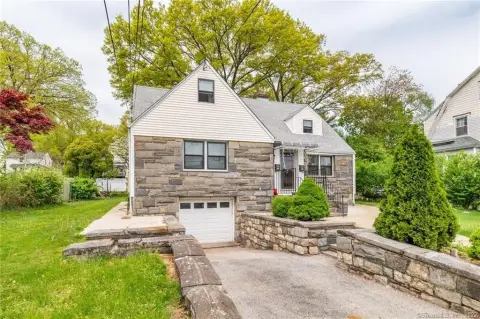
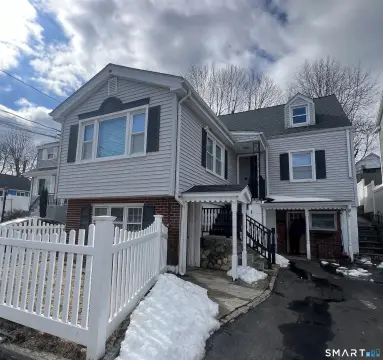
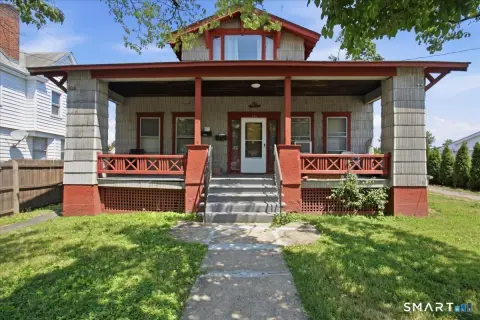
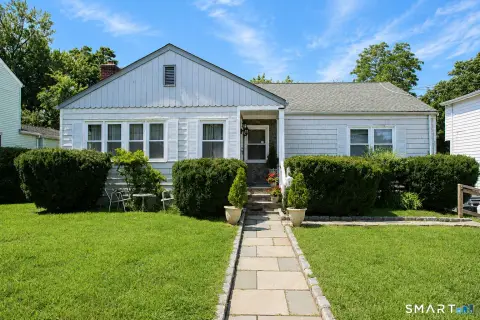
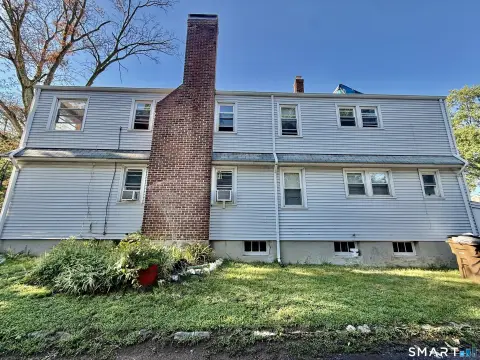
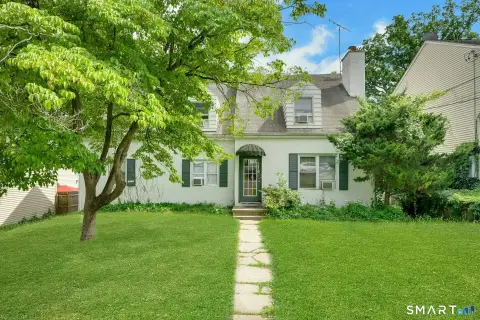
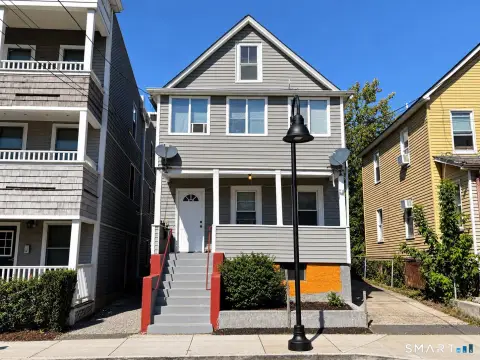
Newly rebuilt duplex offers flexible multi-level living with off-street parking and garage space for two cars.
Property Size5,530 SF
Price / SF$252.26
Days on Market116
Property Features for 75 Coolidge Ave
General Information
Standard status
Active
Size
5,530 SF
Total Parking Spaces
2
Property subtype
Commercial
Zoning
R6
Additional Details
Multifamily Units
2
Taxes and HOA fees
Annual Taxes
$20,945
Building Details
Year Built
1953
Year Renovated
2023
Listing Agency:
Berkshire Hathaway NE Prop
(203) 758-0264
Listed By:
Stefanie Lacoff
Source:
Davejonesrealty
Added: Jun 12
Changed: Sep 10
Last Checked: Oct 4 at 9:11AM
Displayed information is deemed reliable but is not guaranteed and should be independently verified. All listing content including descriptions, pricing, images are the copyrighted material of Berkshire Hathaway NE Prop
Investment Insights
Based on property information with market context.
This two-family duplex was newly rebuilt in 2023 and is designed to function like two spacious single-family homes. Each unit is laid out with four to five bedrooms and four full bathrooms, providing substantial room for household use or flexible space needs. Additional finished living areas include a large finished walk-up third floor in each unit, which can serve as an office, playroom, workout space, or a possible fifth bedroom. Unit 2 also includes a full finished basement that can be used for additional living and recreation space.
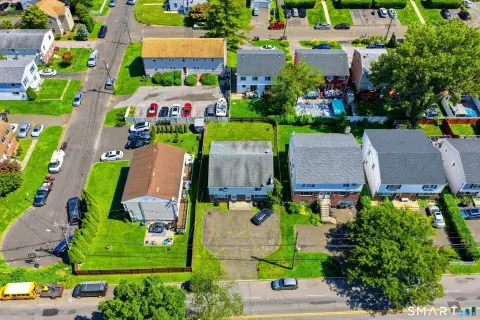
The property provides off-street parking with room for two cars, including one garage space, supporting day-to-day convenience for residents and visitors. The home is described as being in a very convenient location, with easy access for normal residential activities.
For buyers or owner-operators, the unit configuration and multi-level finished spaces offer practical flexibility for a range of tenant needs, including home office use or additional bedroom overflow. The combination of multiple bathrooms and finished third-floor space in each unit can be particularly useful for households seeking more room without sacrificing functionality. Off-street parking and a garage space add straightforward value for resident commuting and storage.
The property provides off-street parking with room for two cars, including one garage space, supporting day-to-day convenience for residents and visitors. The home is described as being in a very convenient location, with easy access for normal residential activities.
For buyers or owner-operators, the unit configuration and multi-level finished spaces offer practical flexibility for a range of tenant needs, including home office use or additional bedroom overflow. The combination of multiple bathrooms and finished third-floor space in each unit can be particularly useful for households seeking more room without sacrificing functionality. Off-street parking and a garage space add straightforward value for resident commuting and storage.
Key Highlights
- Newly rebuilt 2‑family home (duplex) built in 1953 with 5,530 sq ft total living space
- Each unit features 4–5 bedrooms and 4 full bathrooms, with flexible multi‑level room options
- Large finished walk‑up third floor in each unit, with possibilities for a 5th bedroom in each unit
Financial Insights
Estimated NOI and Cap Rate
NOI / Yr
$106,410
Cap Rate
7.63%
Suggested Prices Based on Cap Rates
Cap Rate 5%
$2,128,200
$2.1M
Cap Rate 7%
$1,520,143
$1.5M
Cap Rate 9%
$1,182,333
$1.2M
Market Conditions
NOI Build-Up for 5,530 SF
Gross rent
$162.6K $29.40/SF
− Vacancy
−$10.6K −$1.91/SF
EGI
$152.0K $27.49/SF
− OpEx
−$45.6K −$8.25/SF
NOI
$106.4K $19.24/SF
Area
Stamford, CT
Vacancy
6.50%
Lease Rate
$29.40 /SF/Yr
Expense Ratio
30.00%
Simulate Cap Rate and NOI
Suggested Prices Based on Cap Rates
Cap Rate 5%
$2,128,200
Cap Rate 7%
$1,520,143
Cap Rate 9%
$1,182,333
Alternative Uses
Best Use
Multifamily LT 5
$1.52M
$1.33M – $1.77M
NOI $106,410 @ 7.0% cap · market cap 7.63%
Second Best
Apartment 5plus
$1.36M
$1.19M – $1.59M
NOI $95,174 @ 7.0% cap · market cap 6.82%
Theoretical Best
Office A
$2.00M
$1.75M – $2.33M
NOI $139,965 @ 7.0% cap · market cap 10.03%
Zoning and permitted uses should be independently verified with authorities.
Property Analytics
Unlock full access to Insights
Subscribe to Realmo Intelligence
Open Analytics
Current Use
Lease Details
2
Residential units
Location Intelligence
Trade Area within ½ mile
1,679
Businesses Nearby
Explore this area
Business Placement
Demographics for 06906, CT
9,902
Population
3,727
Households
2.7
Avg Household Size
38
Median Age
47%
College-Educated
80%
High-School Grad
1.3 sq mi
ZIP Area
7,617
Density / Sq Mi
$91,710
Median Household Income
$45,518
Median Earnings
$2,207
Median Rent
$576,200
Median Home Value
Check the figures for this property
Cap Rate, Value Estimation, Potential NOI and more
View Realmo Analytics
Market
Vacancy Rate% for Multifamily in Northeast region

Questions? Ask Rey
Realmo’s AI knows this listing — price, zoning, demand, history. Ask anything.




Frequently Asked Questions
What type of property is this?
Duplex - Newly rebuilt duplex offers flexible multi-level living with off-street parking and garage space for two cars.
Where is this duplex located?
The property is located at 75 Coolidge Ave Stamford, CT.
What is the asking price?
The asking price for this property is $1,395,000.
What are key features of this property?
This property features: Newly rebuilt 2‑family home (duplex) built in 1953 with 5,530 sq ft total living space; Each unit features 4–5 bedrooms and 4 full bathrooms, with flexible multi‑level room options; Large finished walk‑up third floor in each unit, with possibilities for a 5th bedroom in each unit


