Residential Income Property with
For Sale
$719,990
Pending
736 WARBLER WAY Unit 2733, Chester, MD 21619
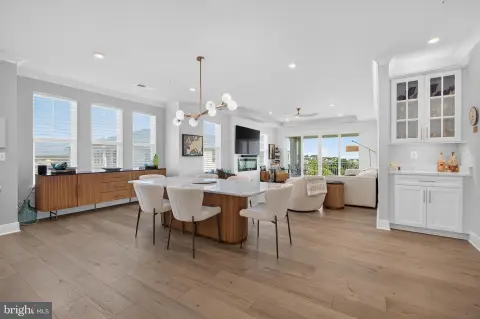
Two-bedroom home featuring a private office, entertaining area, and contemporary kitchen finishes.
Property Size1,900 SF
Days on Market53
Property Features for 736 WARBLER WAY Unit 2733
General Information
Standard status
Pending
Size
1,900 SF
Total Parking Spaces
1
Property subtype
Unit/Flat/Apartment
Units
Unit Mix
1 x 2BR/2.5BA
Multifamily Units
1
Building Details
Building Size
1,900 SF
Year Built
2026
Listing Agency:
Berkshire Hathaway HomeServices PenFed Realty - OP
Listed By:
David M Willman · License #97312
(443) 668-0535
Source:
Barnesrealestatecompany
Added: Aug 28
Changed: Oct 17
Last Checked: Oct 16 at 4:11PM
Displayed information is deemed reliable but is not guaranteed and should be independently verified. All listing content including descriptions, pricing, images are the copyrighted material of Berkshire Hathaway HomeServices PenFed Realty - OP

Ask AI about this property
Review the available facts, identify missing information and prepare questions for the agent.
Investment Insights
Based on property information with market context.
This residential income property is a two-bedroom, 2.5-bath home with a 1-car garage and a dedicated office enclosed by French doors. Interior features include an electric fireplace, dry bar, laminate flooring, and tile floors in both full bathrooms. The kitchen is equipped with a single oven, microwave, gas cooktop, range hood, dishwasher, pendant lighting, tile backsplash, and quartz countertops.
The primary bathroom includes a large shower with a built-in seat and handheld shower wand, along with a double-sink vanity topped with quartz. The home is identified with a 2026 year built and is scheduled for settlement in May 2027. It is located in Chester, Maryland, at 736 Warbler Way, Unit 2733.
The primary bathroom includes a large shower with a built-in seat and handheld shower wand, along with a double-sink vanity topped with quartz. The home is identified with a 2026 year built and is scheduled for settlement in May 2027. It is located in Chester, Maryland, at 736 Warbler Way, Unit 2733.
Key Highlights
- Two bedrooms and 2.5 baths
- 1‑car garage and dedicated office with French doors
- Kitchen with gas cooktop, quartz countertops, and tile backsplash
Financial Insights
Estimated NOI and Cap Rate
NOI / Yr
$25,017
Cap Rate
3.47%
Suggested Prices Based on Cap Rates
Cap Rate 5%
$500,340
$500.3K
Cap Rate 7%
$357,386
$357.4K
Cap Rate 9%
$277,967
$278.0K
Market Conditions
NOI Build-Up for 1,900 SF
Gross rent
$47.9K $25.20/SF
− Vacancy
−$2.4K −$1.26/SF
EGI
$45.5K $23.94/SF
− OpEx
−$20.5K −$10.77/SF
NOI
$25.0K $13.17/SF
Area
Queen Anne's County, MD
Vacancy
5.00%
Lease Rate
$25.20 /SF/Yr
Expense Ratio
45.00%
Simulate Cap Rate and NOI
Suggested Prices Based on Cap Rates
Cap Rate 5%
$500,340
Cap Rate 7%
$357,386
Cap Rate 9%
$277,967
Alternative Uses
Best Use
Apartment 5plus
$357.4K
$312.7K – $417.0K
NOI $25,017 @ 7.0% cap · market cap 3.47%
Second Best
—
—
no second resolved use
Theoretical Best
Office A
$455.2K
$398.3K – $531.1K
NOI $31,863 @ 7.0% cap · market cap 4.43%
Zoning and permitted uses should be independently verified with authorities.
How Realmo checks its estimates
Property Analytics
Current Use
Lease Details
1
Residential units
Location Intelligence
Trade Area within ½ mile
20
Businesses Nearby
Explore this area
Business Placement
Demographics for 21619, MD
6,598
Population
3,002
Households
2.2
Avg Household Size
48
Median Age
37%
College-Educated
92%
High-School Grad
9.3 sq mi
ZIP Area
709
Density / Sq Mi
$100,359
Median Household Income
$55,450
Median Earnings
$1,845
Median Rent
$459,100
Median Home Value


Frequently Asked Questions
What type of property is this?
Residential income property - Two-bedroom home featuring a private office, entertaining area, and contemporary kitchen finishes.
Where is this residential income property located?
The property is located at 736 WARBLER WAY Unit 2733 Chester, MD.
What is the asking price?
The asking price for this property is $719,990.
What are key features of this property?
This property features: Two bedrooms and 2.5 baths; 1‑car garage and dedicated office with French doors; Kitchen with gas cooktop, quartz countertops, and tile backsplash


