Corner-Lot
For Sale
$499,900
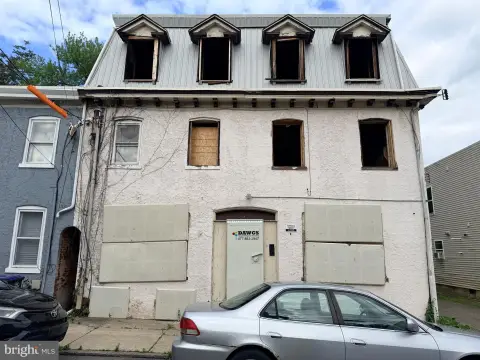
726-728 W 3RD ST, Chester, PA 19013
The facility received a new roof, concrete slab floor, and windows in 2019.
Property Size7,680 SF
Price / SF$65.09
Days on Market50
Property Features for 726-728 W 3RD ST
General Information
Standard status
Active
Size
7,680 SF
Additional Details
Warehouse Space
7,680 SF
Building Details
Year Renovated
2019
Building Size
7,680 SF
Listing Agency:
BHHS Fox & Roach-Media
(610) 566-3000
Listed By:
Charlotte Denise Martin
(610) 202-9558
Source:
Imanirealtors
Added: Aug 26
Changed: Oct 1
Last Checked: Oct 12 at 7:46PM
Displayed information is deemed reliable but is not guaranteed and should be independently verified. All listing content including descriptions, pricing, images are the copyrighted material of BHHS Fox & Roach-Media
Investment Insights
Based on property information with market context.
This 7,680-square-foot warehouse occupies a corner lot in Chester, Pennsylvania. Building improvements completed in 2019 include a new roof, concrete slab floor, and new windows. The owner will reinstall three garage doors: one measuring 10 X 12 feet at the rear and two measuring 8 X 8 feet at the front.
The property is located at 726-728 W 3RD ST and sits on a block described as quiet, with proximity to the city's main thoroughfares. Its warehouse configuration and planned garage-door installation support a range of commercial operating needs without relying on a specialized buildout.
The property is located at 726-728 W 3RD ST and sits on a block described as quiet, with proximity to the city's main thoroughfares. Its warehouse configuration and planned garage-door installation support a range of commercial operating needs without relying on a specialized buildout.
Key Highlights
- 7,680‑square‑foot warehouse on a corner lot
- 2019 improvements include a new roof, concrete slab floor, and new windows
- Owner will reinstall one 10 X 12‑foot rear garage door
Financial Insights
Estimated NOI and Cap Rate
NOI / Yr
$35,800
Cap Rate
7.16%
Suggested Prices Based on Cap Rates
Cap Rate 5%
$716,000
$716.0K
Cap Rate 7%
$511,429
$511.4K
Cap Rate 9%
$397,778
$397.8K
Market Conditions
NOI Build-Up for 7,680 SF
Gross rent
$46.1K $6.00/SF
− Vacancy
−$4.0K −$0.52/SF
EGI
$42.1K $5.48/SF
− OpEx
−$6.3K −$0.82/SF
NOI
$35.8K $4.66/SF
Area
Delaware County, PA
Vacancy
8.60%
Lease Rate
$6.00 /SF/Yr
Expense Ratio
15.00%
Simulate Cap Rate and NOI
Suggested Prices Based on Cap Rates
Cap Rate 5%
$716,000
Cap Rate 7%
$511,429
Cap Rate 9%
$397,778
Alternative Uses
Best Use
Warehouse
$511.4K
$447.5K – $596.7K
NOI $35,800 @ 7.0% cap · market cap 7.16%
Second Best
—
—
no second resolved use
Theoretical Best
Office A
$2.33M
$2.04M – $2.72M
NOI $162,995 @ 7.0% cap · market cap 32.61%
Zoning and permitted uses should be independently verified with authorities.
How Realmo checks its estimates
Property Analytics
Unlock full access to Insights
Subscribe to Realmo Intelligence
Open Analytics
Current Use
Location Intelligence
Trade Area within ½ mile
697
Businesses Nearby
Under-served
Demand for This Use
Explore this area
Business Placement
Demographics for 19013, PA
34,252
Population
15,664
Households
2.2
Avg Household Size
34
Median Age
13%
College-Educated
86%
High-School Grad
5.6 sq mi
ZIP Area
6,116
Density / Sq Mi
$39,416
Median Household Income
$31,668
Median Earnings
$1,083
Median Rent
$85,200
Median Home Value
Check the figures for this property
Cap Rate, Value Estimation, Potential NOI and more
View Realmo Analytics
Market
Vacancy Rate% for Industrial in Northeast region

Questions? Ask Rey
Realmo’s AI knows this listing — price, zoning, demand, history. Ask anything.




Frequently Asked Questions
What type of property is this?
Warehouse - The facility received a new roof, concrete slab floor, and windows in 2019.
Where is this warehouse located?
The property is located at 726-728 W 3RD ST Chester, PA.
What is the asking price?
The asking price for this property is $499,900.
What are key features of this property?
This property features: 7,680‑square‑foot warehouse on a corner lot; 2019 improvements include a new roof, concrete slab floor, and new windows; Owner will reinstall one 10 X 12‑foot rear garage door


