Baltimore Multifamily Investment
For Sale
Contact for pricing
723 S CHARLES, Baltimore, MD 21230
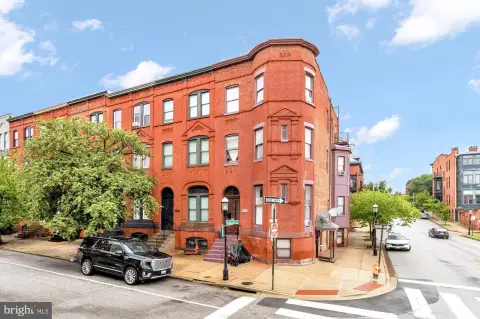
Five-unit multifamily property in Baltimore's Federal Hill neighborhood.
Property Size4,685 SF
Price / SF$192.10
Days on Market299
Property Features for 723 S CHARLES
General Information
Standard status
Active
Size
4,685 SF
Property subtype
Multifamily
Zoning
R8 with OP Permitted
Building Details
Year Built
1985
Units
5
Listing Agency:
Coldwell Banker Commercial NRT Potomac
Listed By:
Omar Aizaz · License #575005
Source:
Crexi
Added: Dec 10, 2025
Changed: Aug 8
Last Checked: Aug 8 at 6:34AM
Displayed information is deemed reliable but is not guaranteed and should be independently verified. All listing content including descriptions, pricing, images are the copyrighted material of Coldwell Banker Commercial NRT Potomac
Investment Insights
Based on property information with market context.
Located in the vibrant Baltimore area, this multifamily property presents an exceptional investment opportunity. Constructed in 1985, the property features 5 units totaling 4,685 square feet and is zoned R8 with OR Permitted. The property is ideally suited for an office or multifamily investment. Situated at the southeast corner of Charles and Hughes Streets, the location in Federal Hill provides unmatched convenience and walkability. The property is one block west of the Inner Harbor, offering immediate access to the Downtown business district and major public transportation routes. Camden Yards and M&T Bank Stadium are within a 10-minute walk. This property is suitable for commercial use or urban residence, delivering accessibility and proximity to attractions, dining, and the energy of Federal Hill.
Key Highlights
- Prime location in Federal Hill, one block west of the Inner Harbor, offering unmatched convenience and walkability.
- Zoned R8 with OR Permitted, suitable for office/multifamily investment and potential development.
- Five units totaling 4,685 SF, providing a substantial investment opportunity.
Financial Insights
Estimated NOI and Cap Rate
NOI / Yr
$61,038
Cap Rate
6.78%
Suggested Prices Based on Cap Rates
Cap Rate 5%
$1,220,760
$1.2M
Cap Rate 7%
$871,971
$872.0K
Cap Rate 9%
$678,200
$678.2K
Market Conditions
NOI Build-Up for 4,685 SF
Gross rent
$118.1K $25.20/SF
− Vacancy
−$7.1K −$1.51/SF
EGI
$111.0K $23.69/SF
− OpEx
−$49.9K −$10.66/SF
NOI
$61.0K $13.03/SF
Area
Baltimore, MD
Vacancy
6.00%
Lease Rate
$25.20 /SF/Yr
Expense Ratio
45.00%
Simulate Cap Rate and NOI
Suggested Prices Based on Cap Rates
Cap Rate 5%
$1,220,760
Cap Rate 7%
$871,971
Cap Rate 9%
$678,200
Alternative Uses
Best Use
Apartment 5plus
$872.0K
$763.0K – $1.02M
NOI $61,038 @ 7.0% cap · market cap 6.78%
Second Best
—
—
no second resolved use
Theoretical Best
Office A
$1.12M
$982.1K – $1.31M
NOI $78,568 @ 7.0% cap · market cap 8.73%
Zoning and permitted uses should be independently verified with authorities.
Property Analytics
Unlock full access to Insights
Subscribe to Realmo Intelligence
Open Analytics
Current Use
Location Intelligence
Trade Area within ½ mile
6,994
Businesses Nearby
Explore this area
Business Placement
Demographics for 21230, MD
36,660
Population
18,070
Households
2
Avg Household Size
33
Median Age
59%
College-Educated
88%
High-School Grad
6.3 sq mi
ZIP Area
5,819
Density / Sq Mi
$94,164
Median Household Income
$69,973
Median Earnings
$1,771
Median Rent
$327,700
Median Home Value
Check the figures for this property
Cap Rate, Value Estimation, Potential NOI and more
View Realmo Analytics
Market
Vacancy Rate% for Multifamily in South region

Questions? Ask Rey
Realmo’s AI knows this listing — price, zoning, demand, history. Ask anything.




Frequently Asked Questions
What type of property is this?
Apartment building - Five-unit multifamily property in Baltimore's Federal Hill neighborhood.
Where is this apartment building located?
The property is located at 723 S CHARLES Baltimore, MD.
What is the asking price?
The asking price for this property is $900,000.
What are key features of this property?
This property features: Prime location in Federal Hill, one block west of the Inner Harbor, offering unmatched convenience and walkability.; Zoned R8 with OR Permitted, suitable for office/multifamily investment and potential development.; Five units totaling 4,685 SF, providing a substantial investment opportunity.



