Leased Oregon City
715 S MCLOUGHLIN BLVD Oregon City, OR 97045
For Sale
Contact for pricing
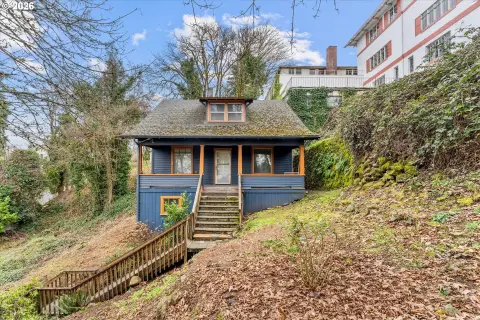
Fully leased two-unit duplex with interior upgrades, a finished basement, and Willamette River views.
Property Size1,980 SF
Price / SF$201.97
Days on Market57
Property Features for 715 S MCLOUGHLIN BLVD
General Information
- Standard status
- Active
- Size
- 1,980 SF
- Property subtype
- Multifamily
Building Details
- Year Built
- 1900
Listing Agency:
Keller Williams Realty Portland Premiere
(503) 597-2444
Listed By:
Darryl Bodle · License #199910100
Source:
Crexi
Added: Jun 1
Changed: Jul 10
Last Checked: Jul 26 at 2:32PM
Displayed information is deemed reliable but is not guaranteed and should be independently verified. All listing content including descriptions, pricing, images are the copyrighted material of Keller Williams Realty Portland Premiere
Investment Insights
Based on property information with market context.
This leased duplex offers a two-unit income opportunity with completed interior improvements. The main level provides two units totaling approximately 1,100 square feet, plus an additional approximately 880 square feet of basement area for an estimated total of about 1,980 square feet; the buyer should verify. Unit A was rehabbed at the time of the seller’s purchase with kitchen appliance updates, pantry improvements, plumbing updates as needed, updated lighting, and fresh interior paint. Unit B underwent a complete rehab, including a new kitchen and bathroom, plumbing and heating improvements, fresh interior paint, and broad interior updates. The basement features a full bathroom, a washer and dryer area, utility improvements, a water heater, and some lighting updates, along with flexible storage and potential for future use subject to due diligence.
Located on S McLoughlin Blvd in Oregon City, the property is described as having views toward the Willamette River. Nearby amenities and access points cited in the remarks include downtown Oregon City and Canemah, Willamette Falls viewpoints, Clackamette Park, McLoughlin Promenade, local transit, and access to Hwy 99E and I-205.
The asset is well suited to an investor seeking a leased two-unit property with in-place rental income and recent interior upgrades. It may also appeal to an owner-occupant scenario for a buyer interested in potentially occupying one unit and supplementing with the second unit, subject to lease timing, lender approval, and buyer due diligence.
Located on S McLoughlin Blvd in Oregon City, the property is described as having views toward the Willamette River. Nearby amenities and access points cited in the remarks include downtown Oregon City and Canemah, Willamette Falls viewpoints, Clackamette Park, McLoughlin Promenade, local transit, and access to Hwy 99E and I-205.
The asset is well suited to an investor seeking a leased two-unit property with in-place rental income and recent interior upgrades. It may also appeal to an owner-occupant scenario for a buyer interested in potentially occupying one unit and supplementing with the second unit, subject to lease timing, lender approval, and buyer due diligence.
Key Highlights
- Fully leased Oregon City duplex with existing in‑place rental income (2 units).
- Year built 1900; total interior area includes ~1,100 SF on the main level plus ~880 SF basement area (~1,980 SF total, buyer to verify).
- Unit A: rehab at seller’s purchase with kitchen appliance updates, pantry improvements, plumbing updates as needed, lighting, and fresh interior paint.
Financial Insights For Apartment 5plus
Simulate Cap Rate and NOI
NOI Build-Up
- Vacancy
- income lost from leasable area expected to sit empty during the year — subtracted from gross rent.
- EGI (Effective Gross Income)
- gross rent minus vacancy losses — the realistic income before paying operating costs.
- OpEx (Operating Expenses)
- recurring costs to operate the property (property tax, insurance, utilities, maintenance, management) — excludes financing and capital improvements.
- NOI (Net Operating Income)
- income a property generates after operating costs but before financing and taxes.
| Component | $ | $/SF |
|---|---|---|
| Gross rent | $48.7k | $24.60 |
| − Vacancy | −$2.5k | −$1.25 |
| EGI | $46.2k | $23.35 |
| − OpEx | −$20.8k | −$10.51 |
| NOI | $25.4k | $12.84 |
1,980 SF · lease $24.60/SF/yr · vacancy 5.10% · expense 45.00%
Alternative Uses
Best Use
Apartment 5plus
$363.2K
$317.8K – $423.7K
NOI $25,423 @ 7.0% cap · market cap 6.36%
Second Best
Multifamily LT 5
$355.3K
$310.9K – $414.5K
NOI $24,871 @ 7.0% cap · market cap 6.22%
Theoretical Best
Office A
$534.5K
$467.7K – $623.5K
NOI $37,412 @ 7.0% cap · market cap 9.36%
Zoning and permitted uses should be independently verified with local authorities.
Property Analytics
Property Profile
Location Intelligence
Current Use by Public Records
Duplexes






FAQs
What type of property is this?
Duplex - Fully leased two-unit duplex with interior upgrades, a finished basement, and Willamette River views.
Where is this duplex located?
The property is located at 715 S MCLOUGHLIN BLVD Oregon City, OR.
What is the asking price?
The asking price for this property is $399,900.
What are key features of this property?
This property features: Fully leased Oregon City duplex with existing in‑place rental income (2 units).; Year built 1900; total interior area includes ~1,100 SF on the main level plus ~880 SF basement area (~1,980 SF total, buyer to verify).; Unit A: rehab at seller’s purchase with kitchen appliance updates, pantry improvements, plumbing updates as needed, lighting, and fresh interior paint.



