Restaurant Building with
For Sale
$1,090,000
714 Broad St, New Bern, NC 28562
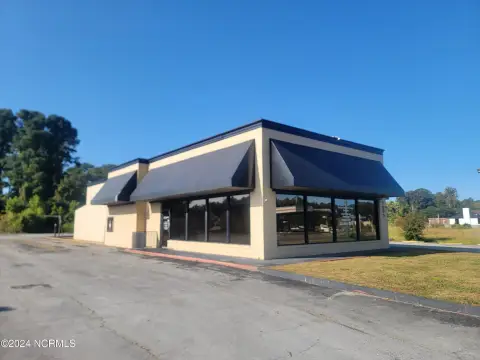
The property combines restaurant space, drive-through service, and ample on-site parking.
Property Size3,322 SF
Lot Size0.96 Acres
Price / SF$328.12
Days on Market87
Property Features for 714 Broad St
General Information
Standard status
Active
Size
3,322 SF
Lot size
0.96 Acres
Additional Details
Drive-Thru
Yes
Building Details
Year Built
1979
Listing Agency:
CENTURY 21 ZAYTOUN RAINES
Listed By:
Melinda Jane Bianchi · License #302826
(908) 482-1395
Source:
Ibxcoastalliving
Added: Jul 20
Changed: Sep 15
Last Checked: Oct 7 at 3:45PM
Displayed information is deemed reliable but is not guaranteed and should be independently verified. All listing content including descriptions, pricing, images are the copyrighted material of CENTURY 21 ZAYTOUN RAINES
Investment Insights
Based on property information with market context.
Located at 714 Broad St in New Bern, this restaurant property contains 3,322 square feet within a 0.96-acre site. The building includes a drive-through and more than ample parking, supporting a range of restaurant or retail configurations. Constructed in 1979, the property previously operated as a Hardee’s and later as Jim Bob’s Restaurant.
The site is positioned near county offices, other restaurants, waterfront destinations, and Union Park. Its Broad Street location provides access to an established downtown setting with surrounding civic, dining, and recreational uses.
The site is positioned near county offices, other restaurants, waterfront destinations, and Union Park. Its Broad Street location provides access to an established downtown setting with surrounding civic, dining, and recreational uses.
Key Highlights
- 3,322‑square‑foot restaurant building
- 0.96‑acre site at 714 Broad St
- Drive‑through configuration
Financial Insights
Estimated NOI and Cap Rate
NOI / Yr
$65,635
Cap Rate
6.02%
Suggested Prices Based on Cap Rates
Cap Rate 5%
$1,312,700
$1.3M
Cap Rate 7%
$937,643
$937.6K
Cap Rate 9%
$729,278
$729.3K
Market Conditions
NOI Build-Up for 3,322 SF
Gross rent
$100.1K $30.12/SF
− Vacancy
−$6.3K −$1.89/SF
EGI
$93.8K $28.23/SF
− OpEx
−$28.1K −$8.47/SF
NOI
$65.6K $19.76/SF
Area
Craven County, NC
Vacancy
6.29%
Lease Rate
$30.12 /SF/Yr
Expense Ratio
30.00%
Simulate Cap Rate and NOI
Suggested Prices Based on Cap Rates
Cap Rate 5%
$1,312,700
Cap Rate 7%
$937,643
Cap Rate 9%
$729,278
Alternative Uses
Best Use
Retail
$937.6K
$820.4K – $1.09M
NOI $65,635 @ 7.0% cap · market cap 6.02%
Second Best
Specialty Retail
$613.8K
$537.0K – $716.1K
NOI $42,963 @ 7.0% cap · market cap 3.94%
Theoretical Best
Office A
$1.10M
$958.4K – $1.28M
NOI $76,668 @ 7.0% cap · market cap 7.03%
Zoning and permitted uses should be independently verified with authorities.
How Realmo checks its estimates
Property Analytics
Unlock full access to Insights
Subscribe to Realmo Intelligence
Open Analytics
Current Use
Location Intelligence
Trade Area within ½ mile
1,043
Businesses Nearby
Under-served
Demand for This Use
Explore this area
Business Placement
Demographics for 28562, NC
39,375
Population
18,812
Households
2.1
Avg Household Size
45
Median Age
33%
College-Educated
93%
High-School Grad
151.7 sq mi
ZIP Area
260
Density / Sq Mi
$74,620
Median Household Income
$40,215
Median Earnings
$1,131
Median Rent
$246,400
Median Home Value
Check the figures for this property
Cap Rate, Value Estimation, Potential NOI and more
View Realmo Analytics
Market
Vacancy Rate% for Retail in South region

Questions? Ask Rey
Realmo’s AI knows this listing — price, zoning, demand, history. Ask anything.



Frequently Asked Questions
What type of property is this?
Conventional restaurant - The property combines restaurant space, drive-through service, and ample on-site parking.
Where is this conventional restaurant located?
The property is located at 714 Broad St New Bern, NC.
What is the asking price?
The asking price for this property is $1,090,000.
What are key features of this property?
This property features: 3,322‑square‑foot restaurant building; 0.96‑acre site at 714 Broad St; Drive‑through configuration


