Automotive Shop With Secondary
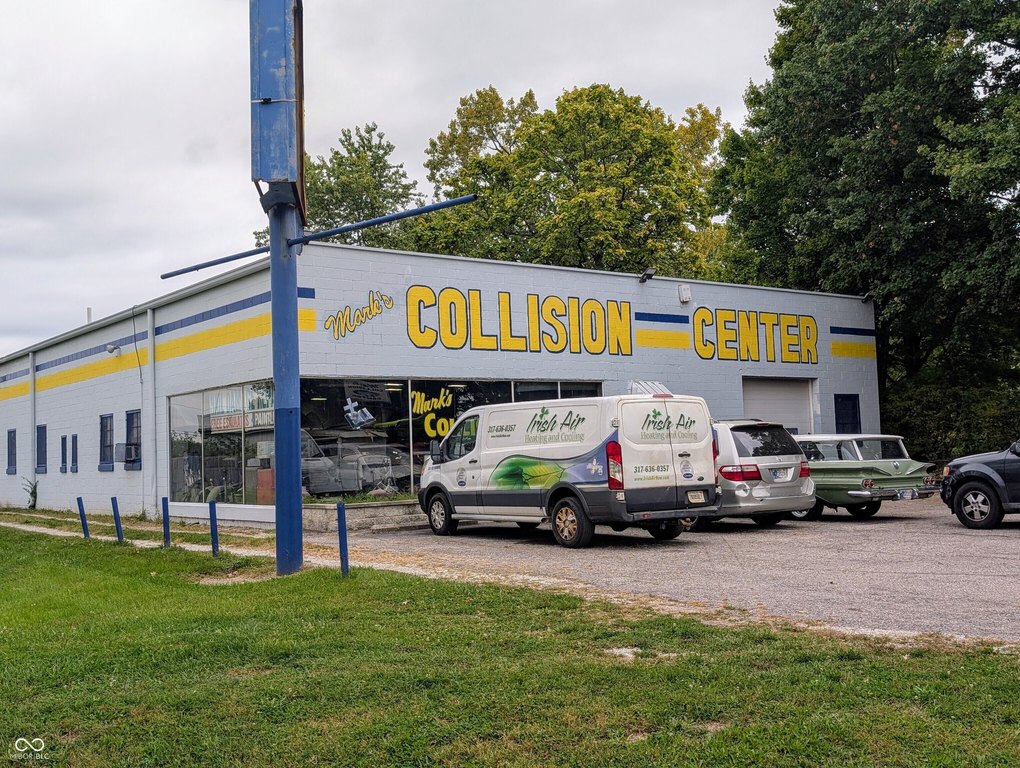
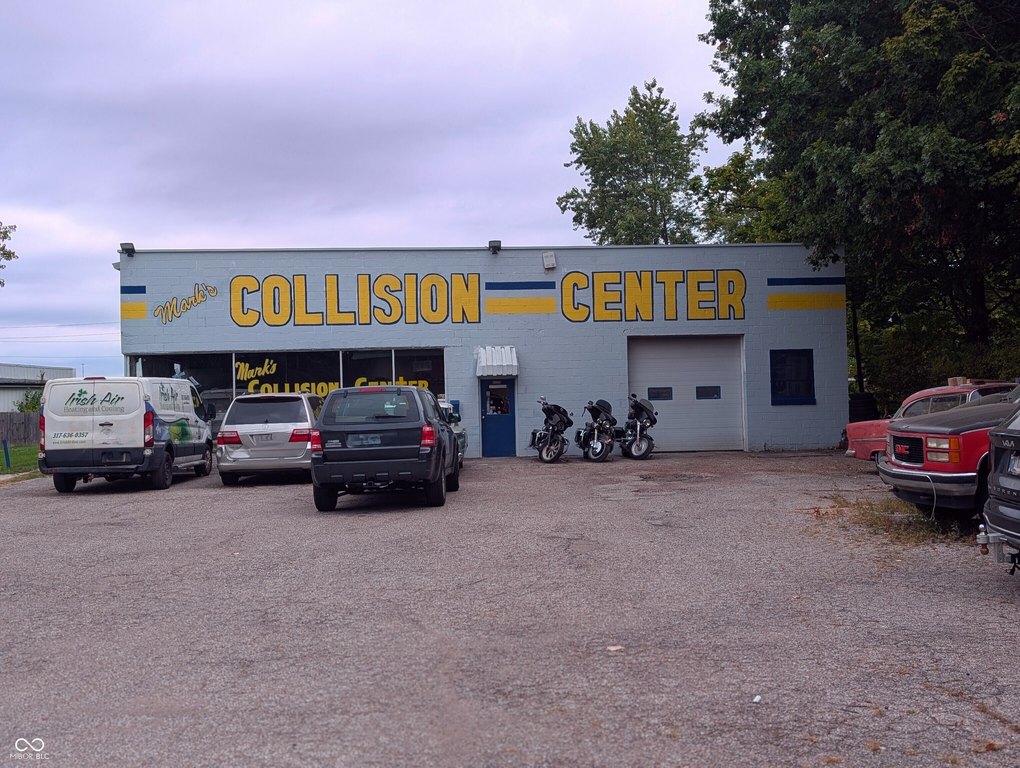
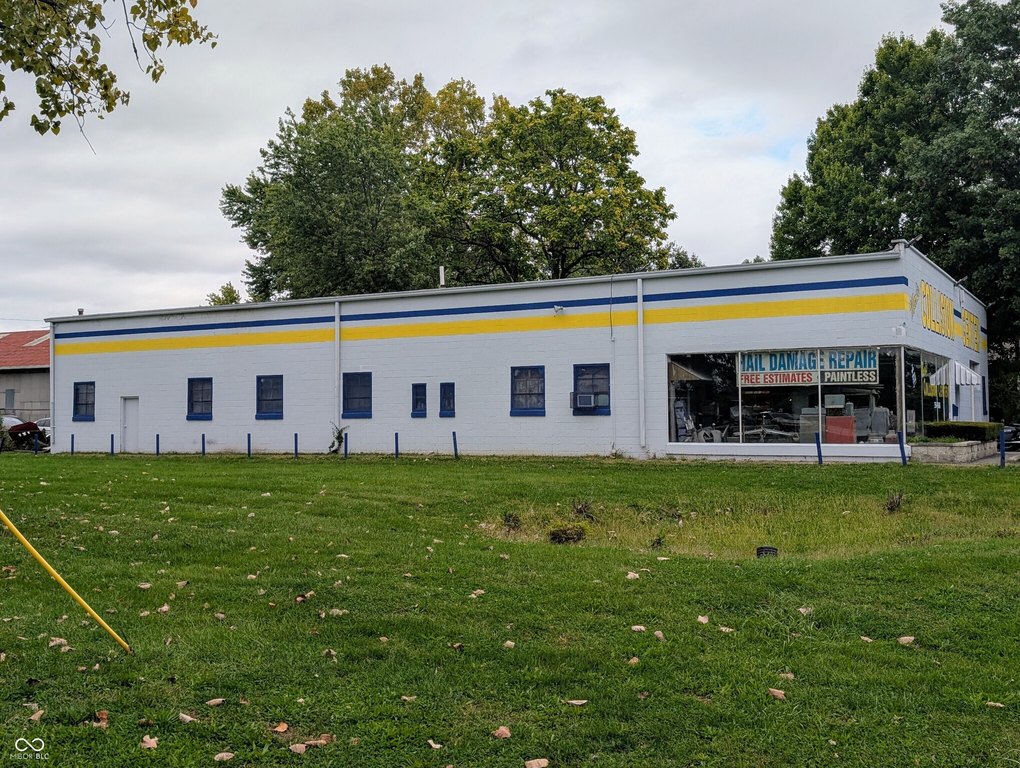
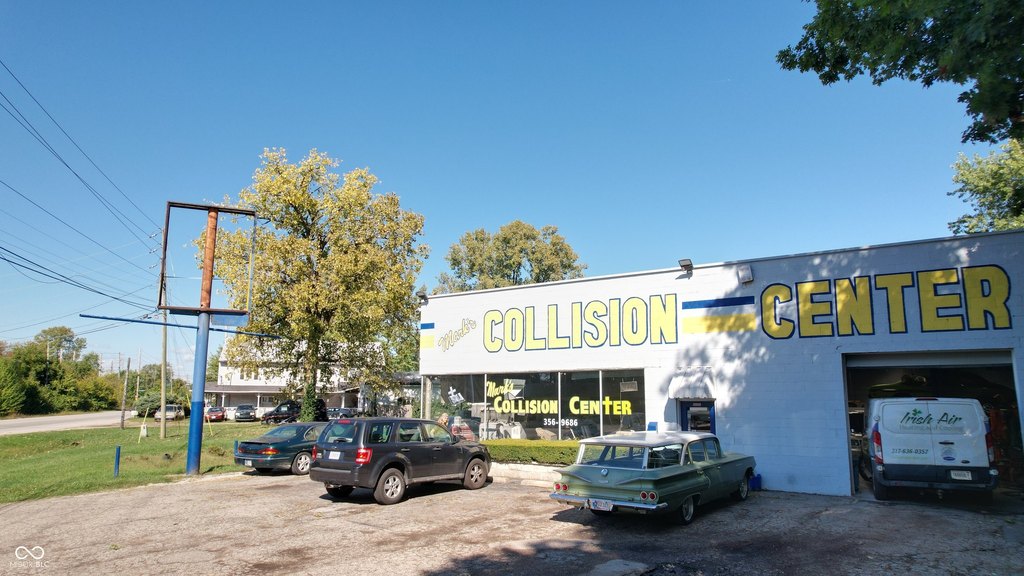
For Sale
$1,100,000
7086 Southeastern Avenue, Indianapolis, IN 46239
Commercial Sale, Indianapolis, IN
Property SizeContact for details
Lot Size0.30 Acres
Days on Market364
Property Features for 7086 Southeastern Avenue
General Information
Property type
Commercial Sale
Property subtype
Other
Zoning
C4
Parking features
Guest, Open, Garage
Security features
Security Lighting
Middle school
Franklin Central Junior High
Elementary school district
Franklin Township Com Sch Corp
Middle school district
Franklin Township Com Sch Corp
High school district
Franklin Township Com Sch Corp
Directions
GPS Friendly
Subdivision
4906 - Marion - Franklin
Standard status
Active
APN
491025128176000300
Lot size
0.30 Acres
Taxes and HOA fees
Tax Year
2024
Tax Description
Suncrest Add Block 1 Lot 29 & E1/2 Lot 30
Legal Description
Suncrest Add Block 1 Lot 29 & E1/2 Lot 30
Utilities
Heating system
Forced Air, Natural Gas
Cooling system
Window Unit(s)
Water source
Well
Amenities
office
two bathrooms
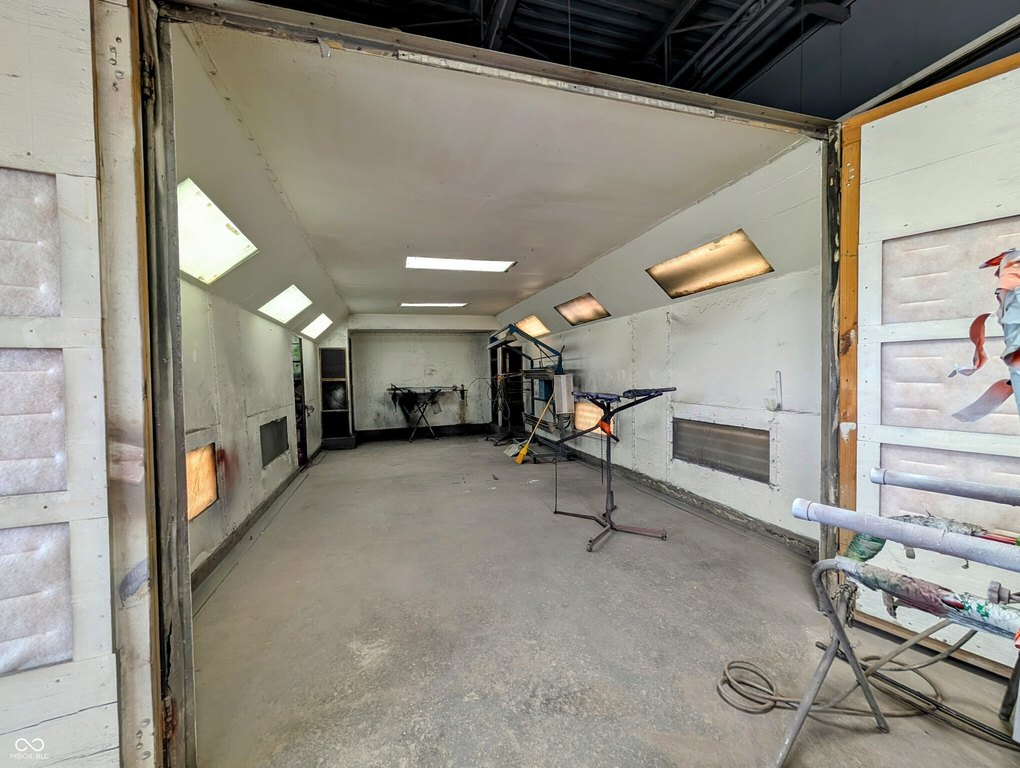
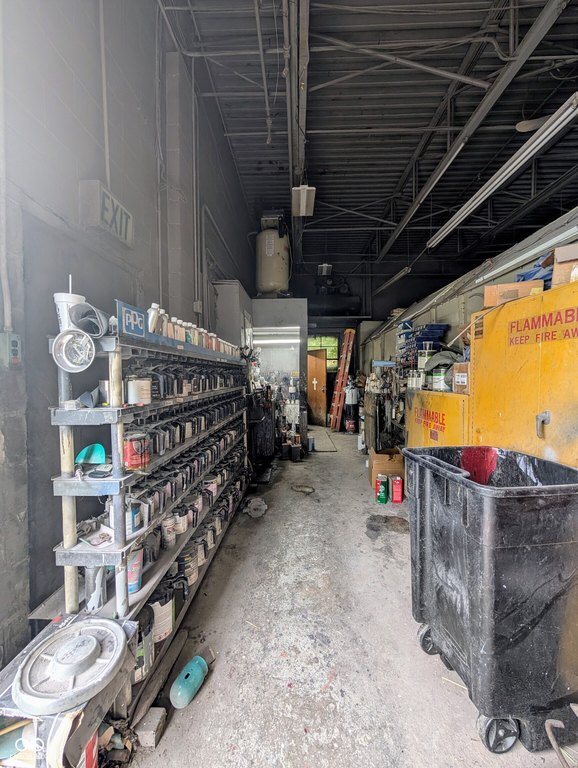
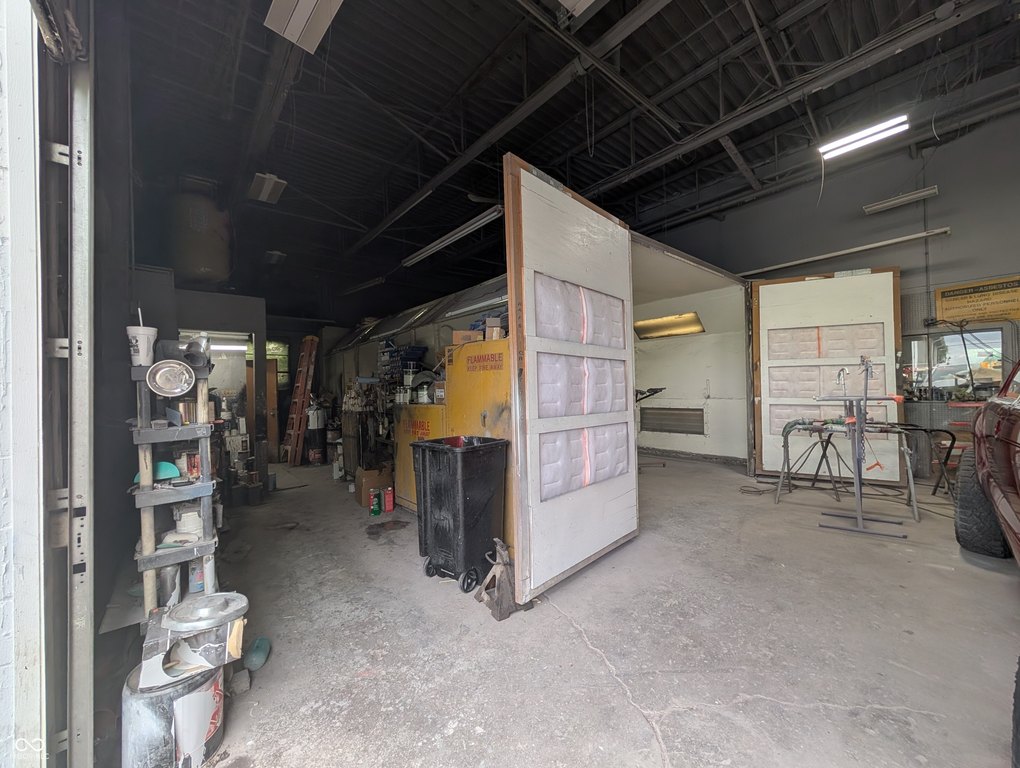
custom-built paint booth
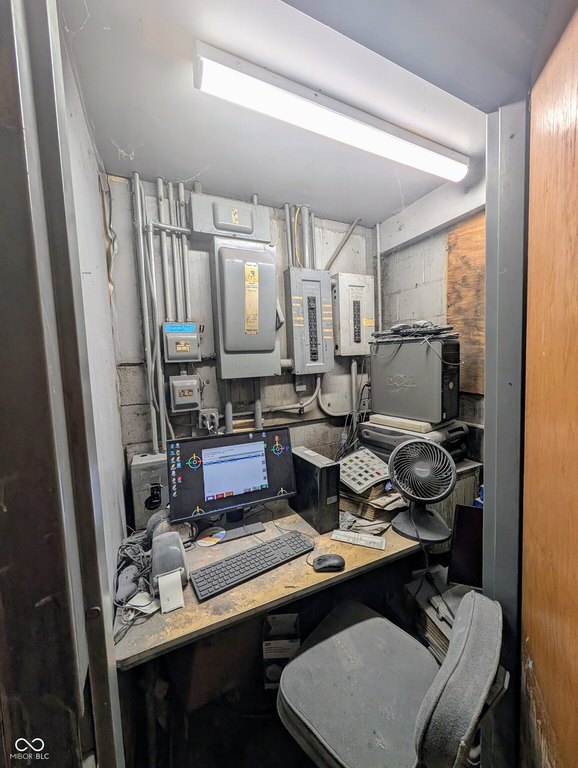
computer room
pole barn
two post automotive lifts
Building Details
Roof type
Metal, Rubber
Listing Agency:
Blooming Wilderness Cedar Real Estate Brokerage LLC
(317) 659-1150
Listed By:
Leah Mencke · License #RB14041750
(317) 389-1770
Added: Oct 8, 2025
Changed: Sep 17
Last Checked: Oct 6 at 12:06PM
MLS# 22066888
Copyright © 2026 Broker Listing Cooperative®. All rights reserved. All information provided by the listing agent/broker is deemed reliable but is not guaranteed and should be independently verified.
Investment Insights
Based on property information with market context.
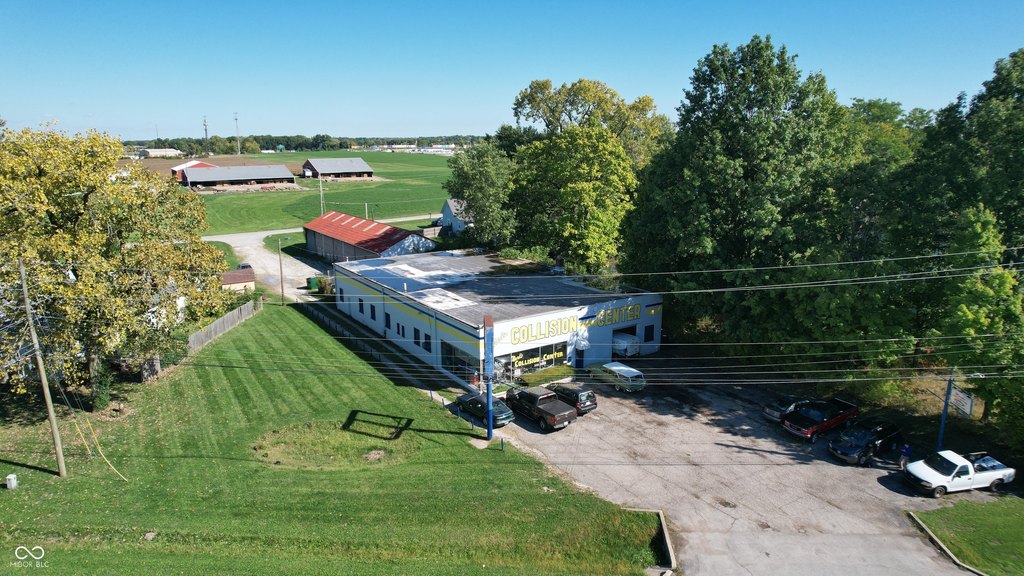
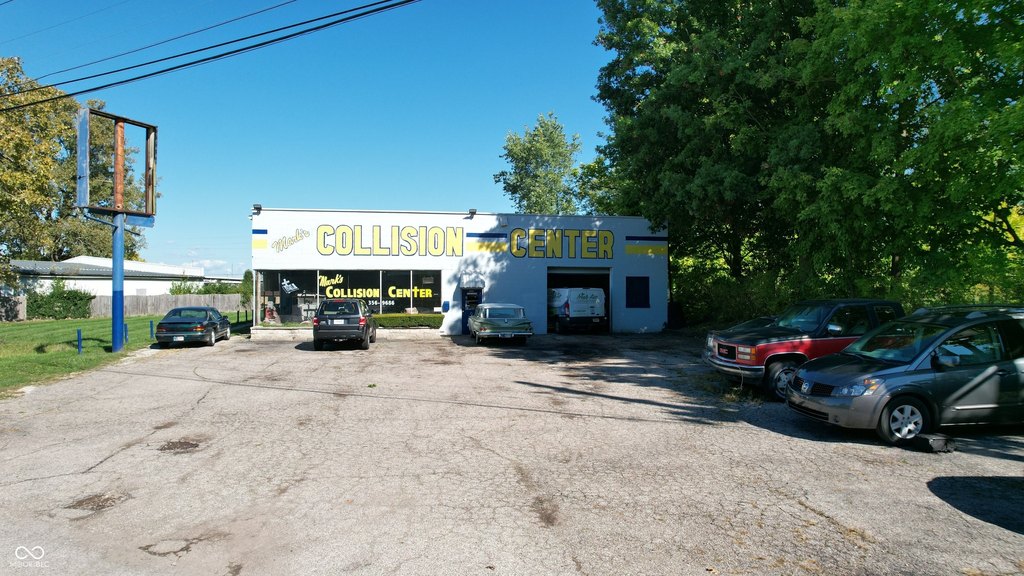
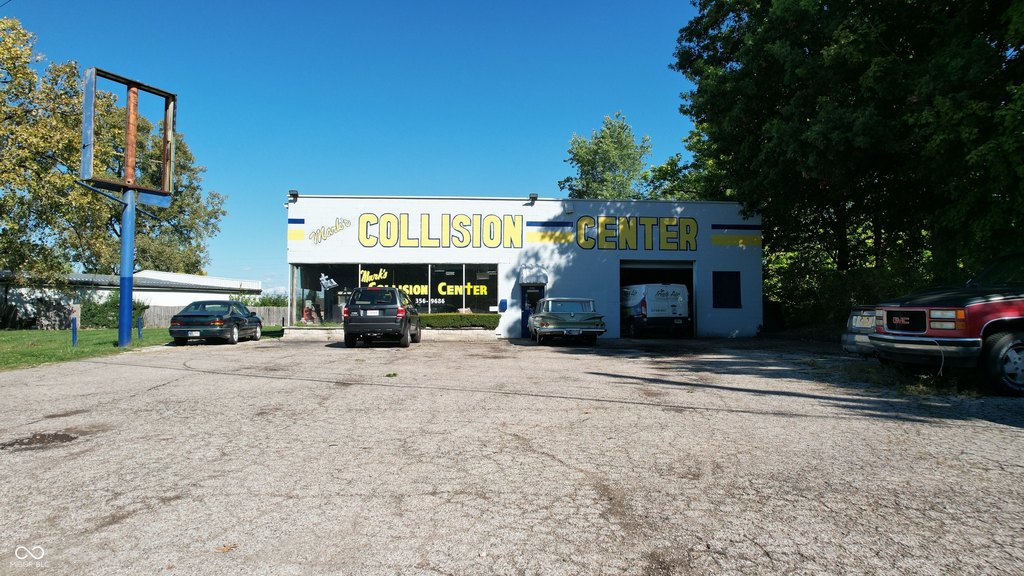
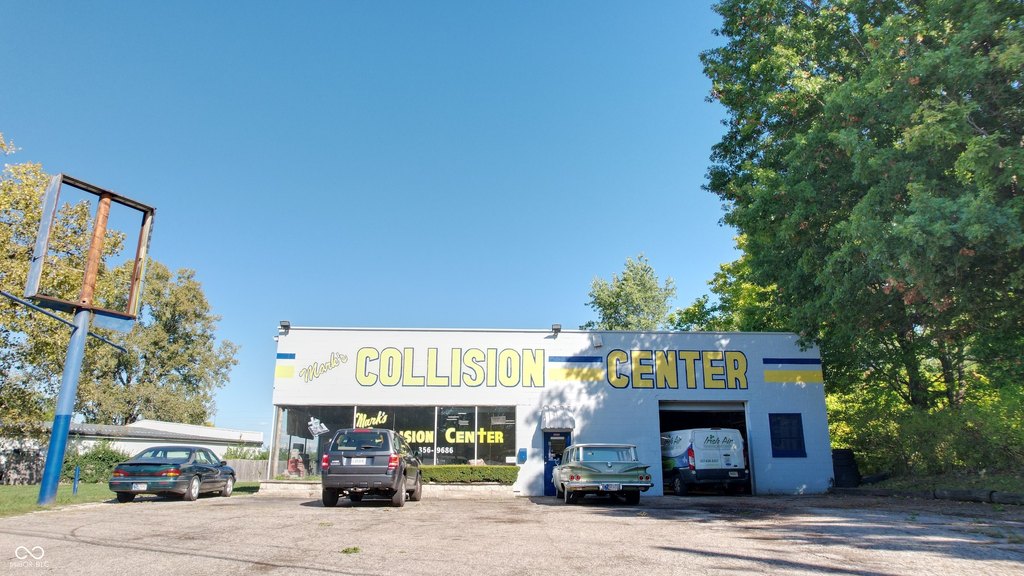
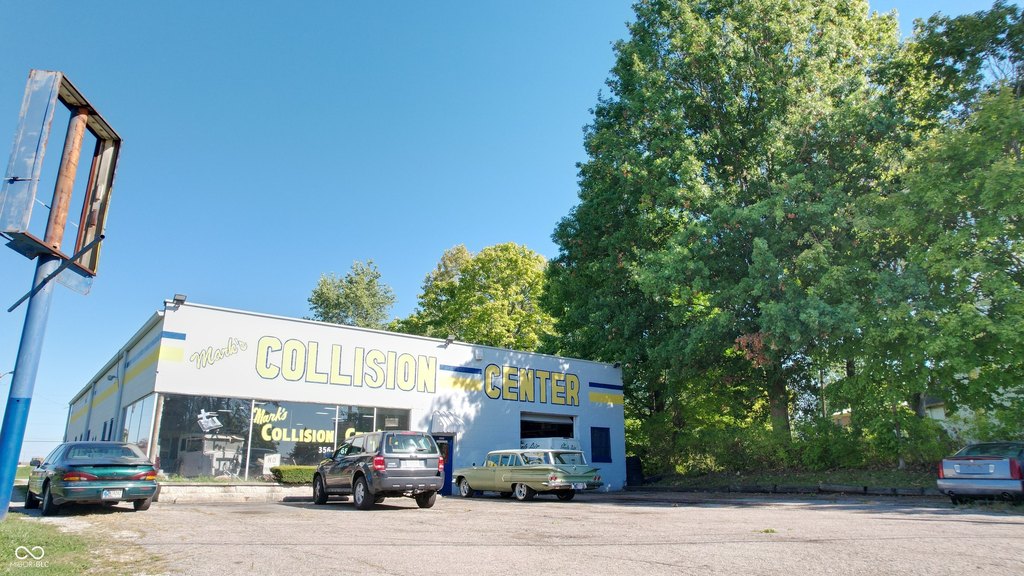
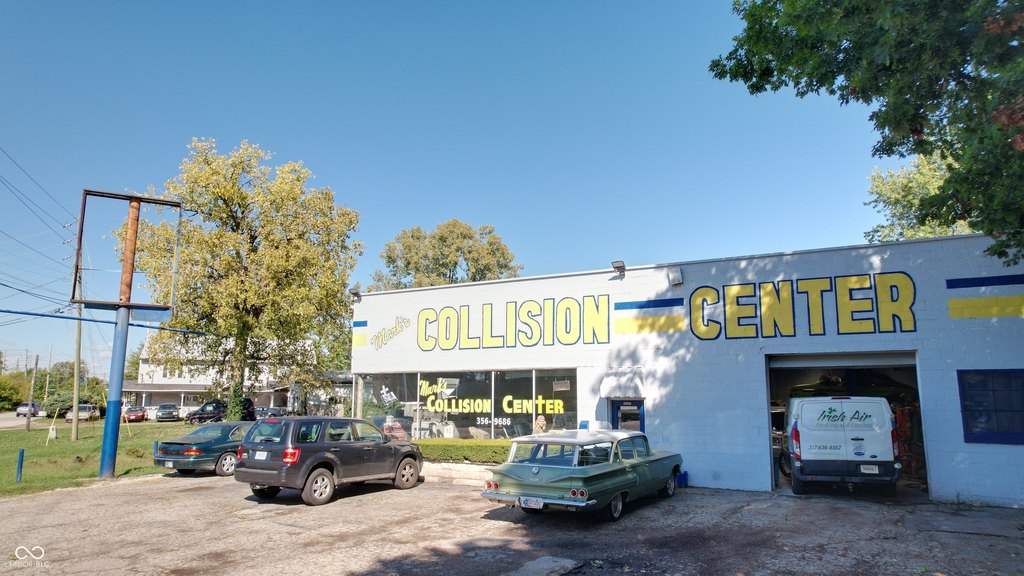
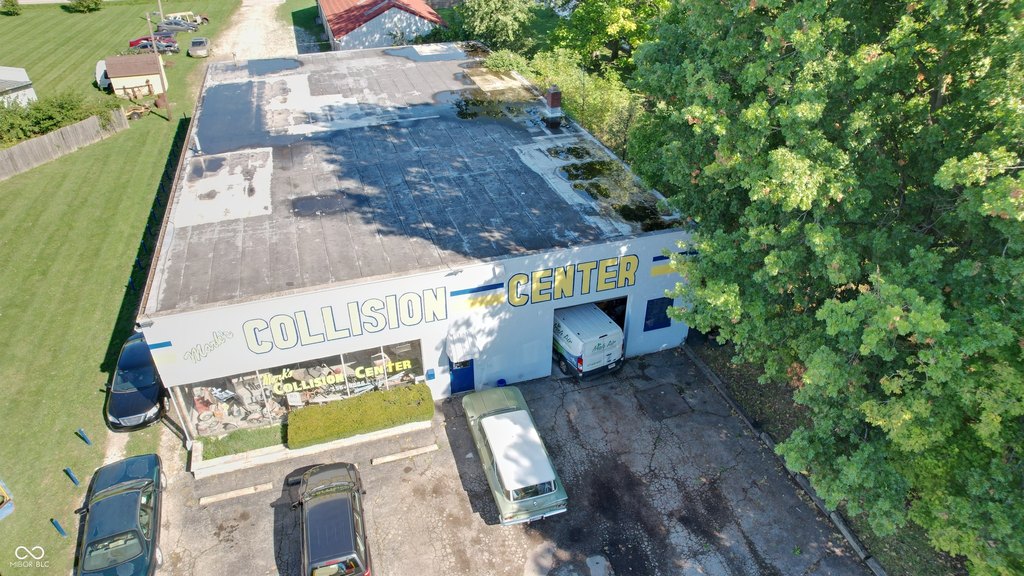
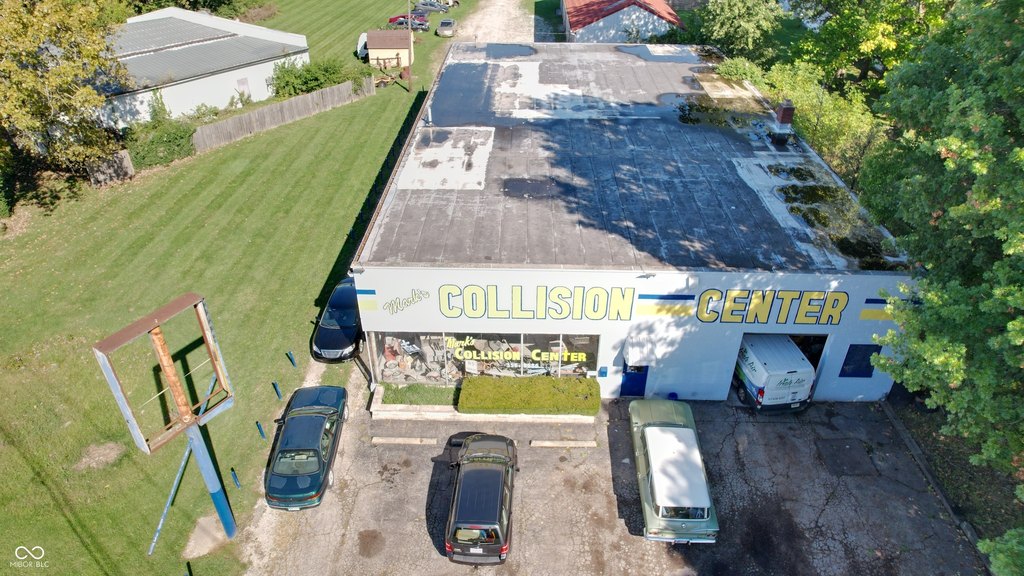
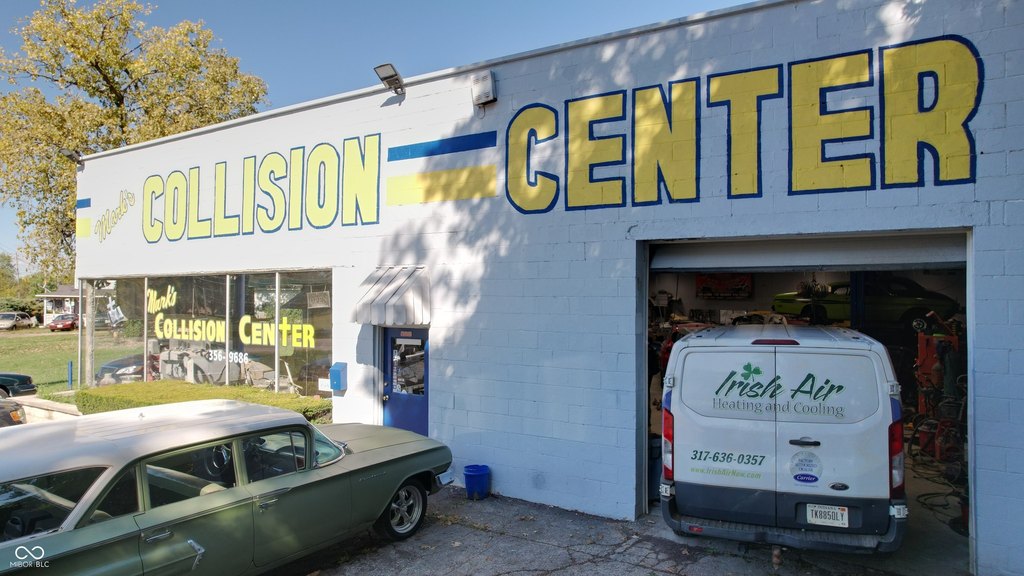
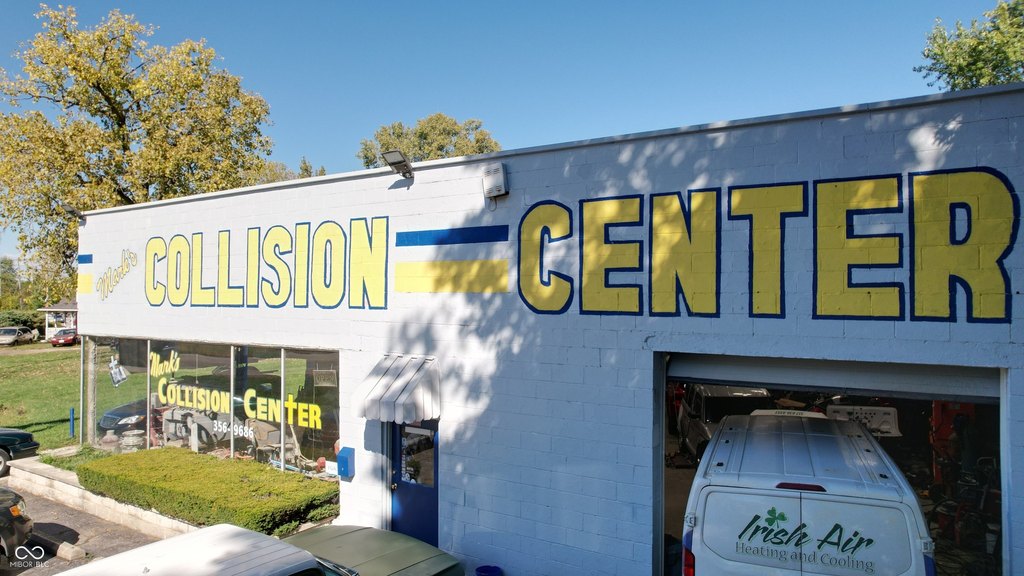
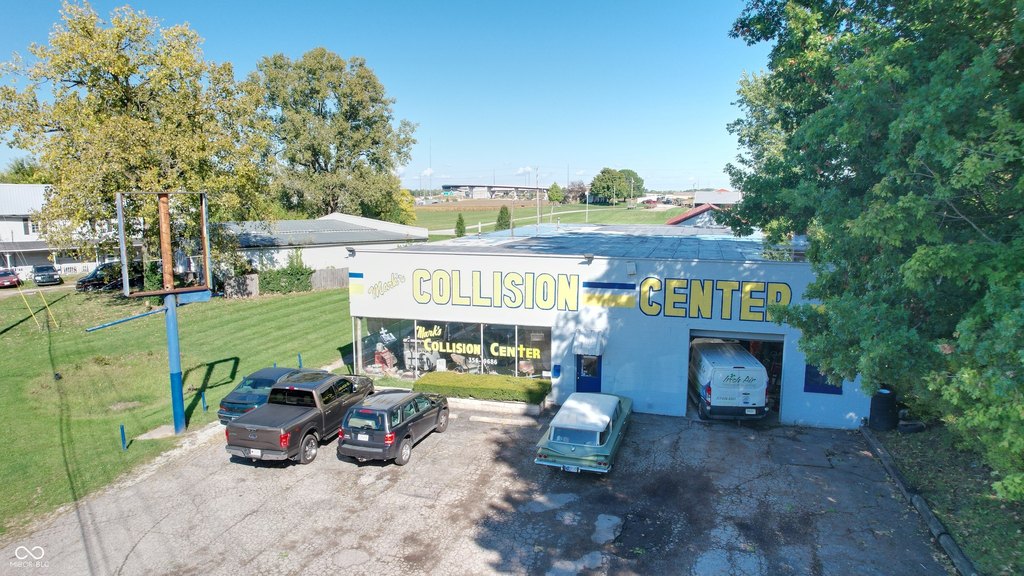
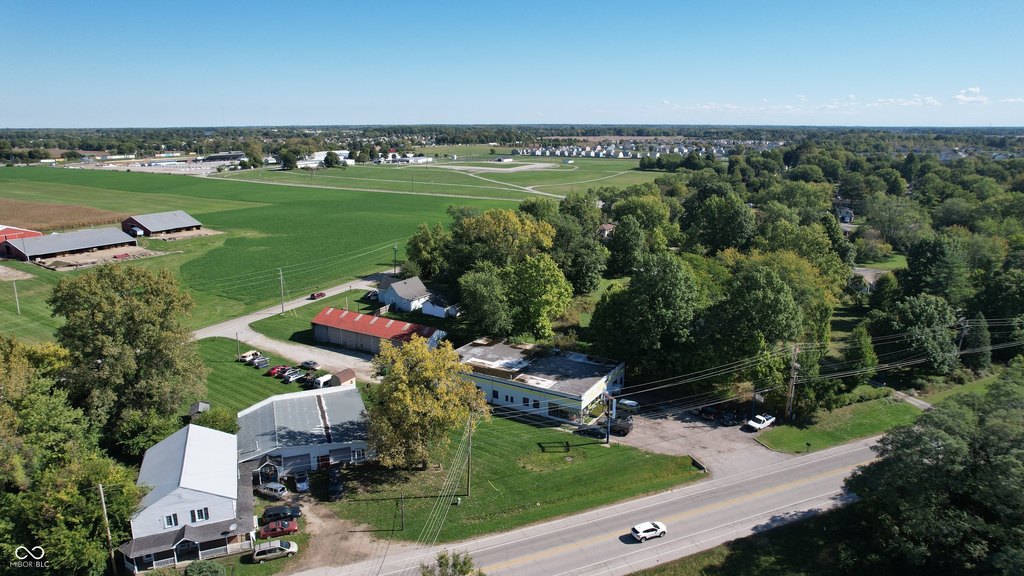
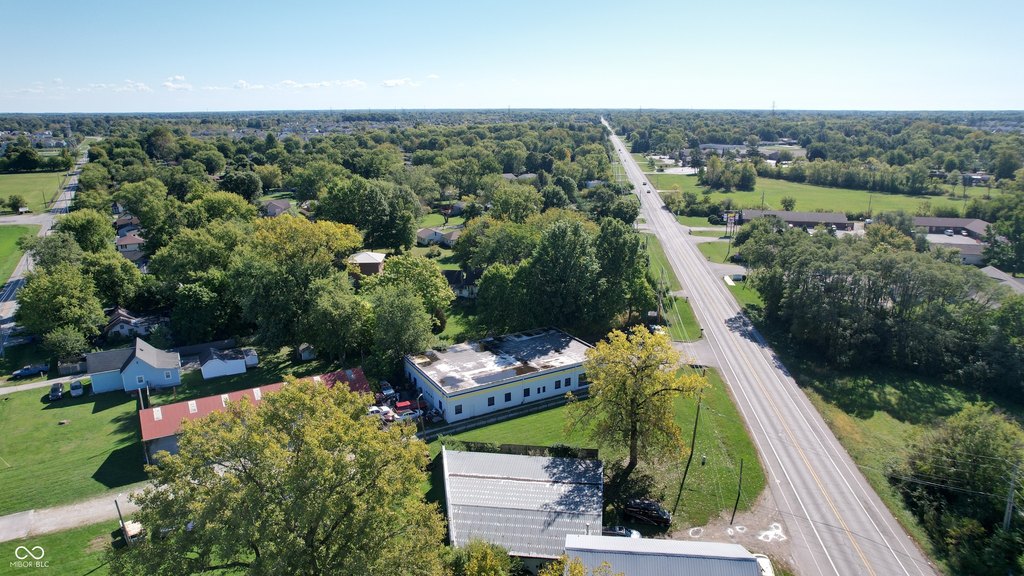
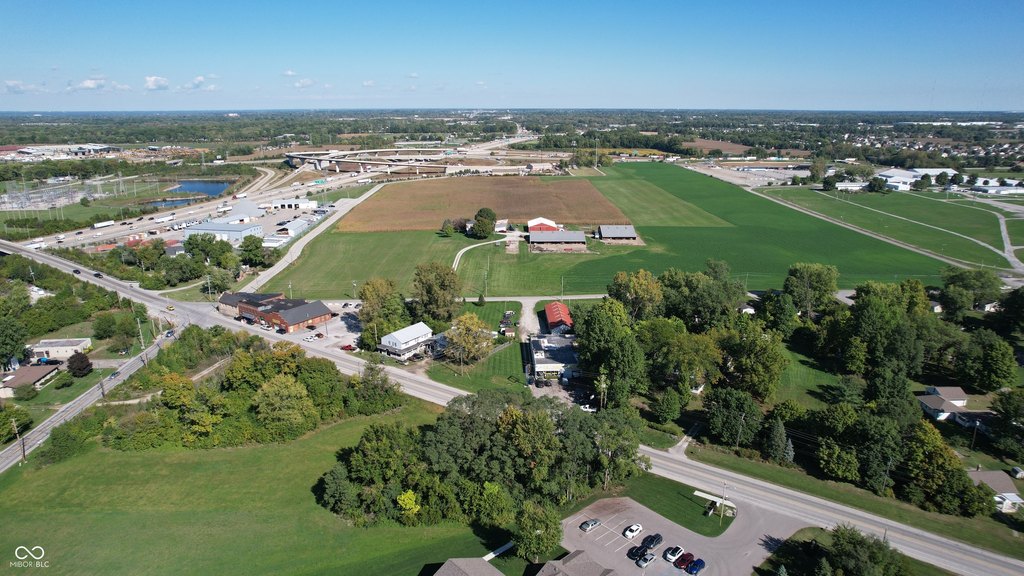
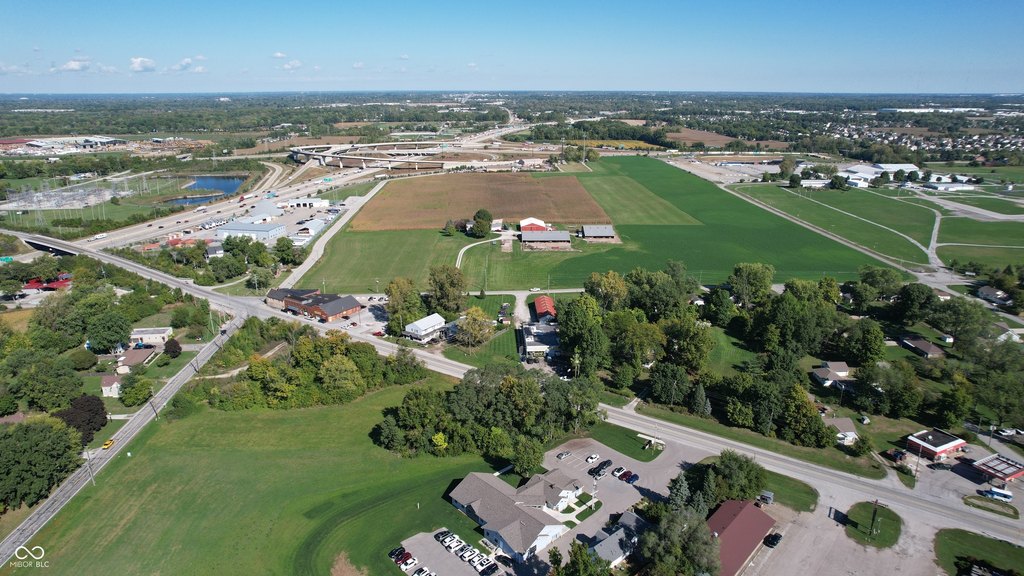
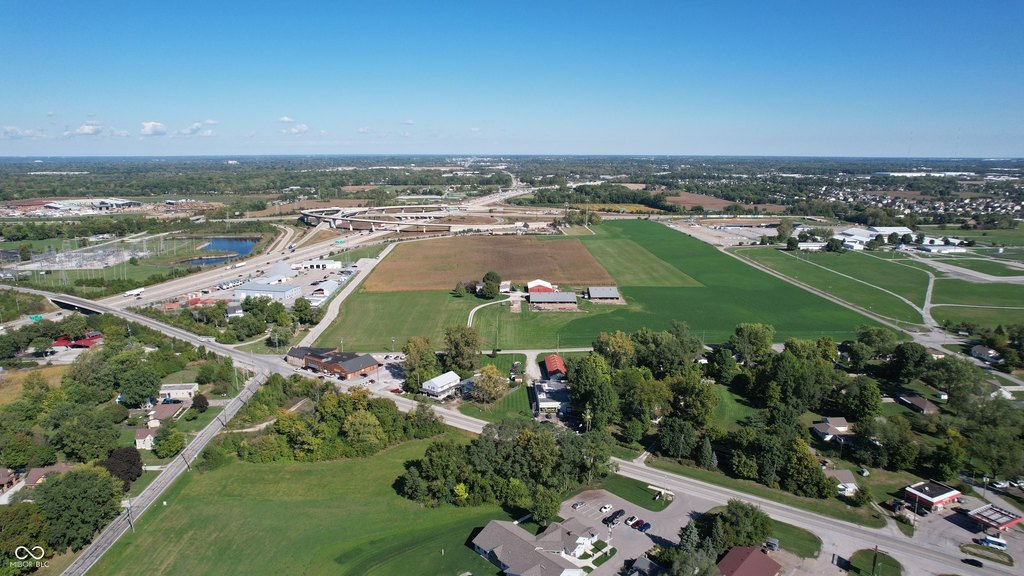
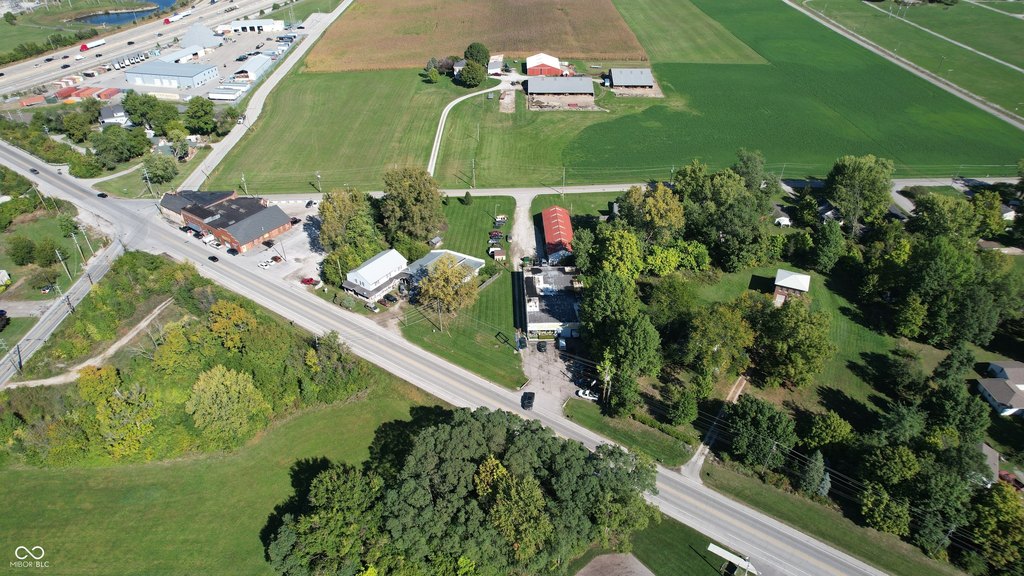
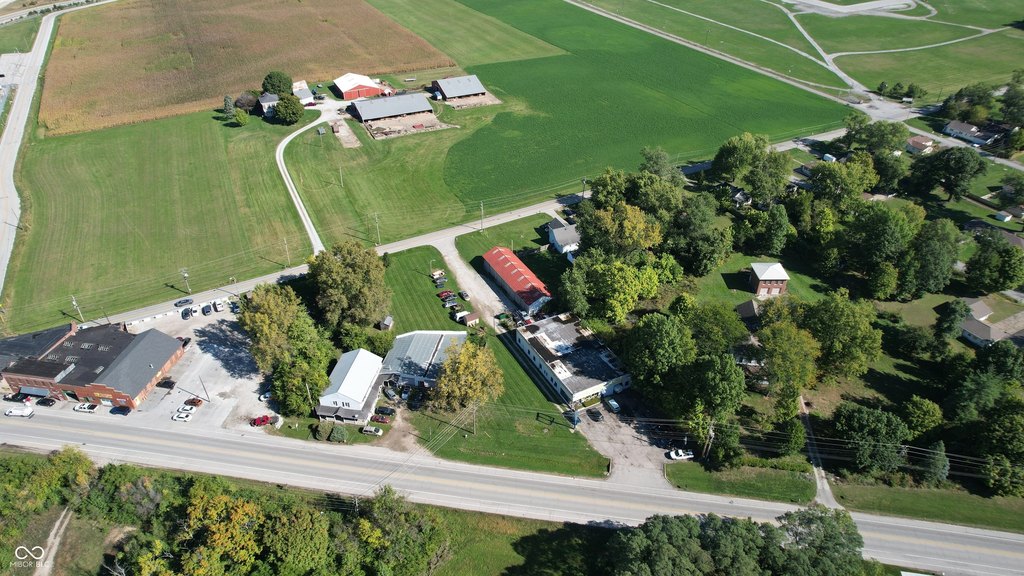
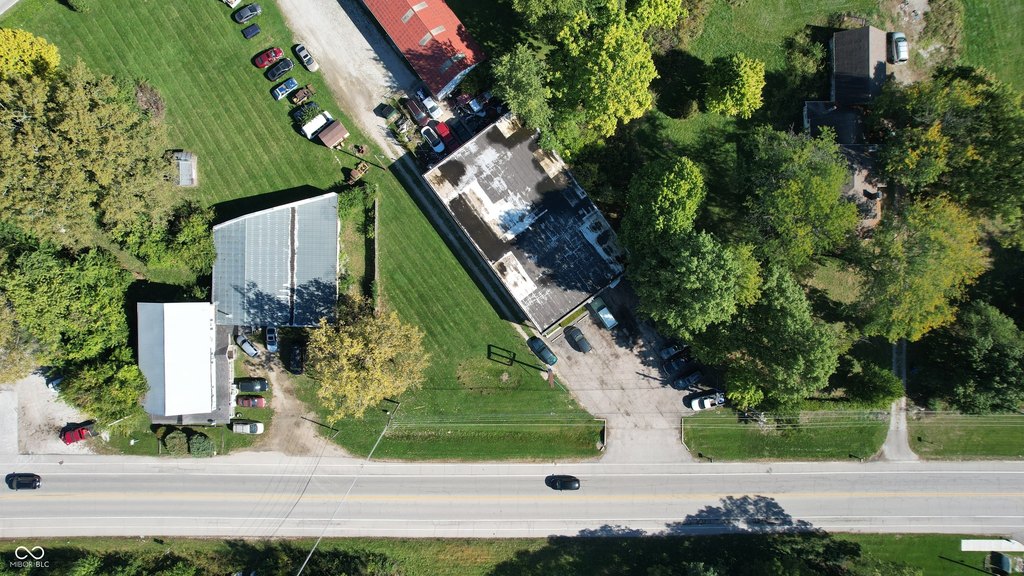
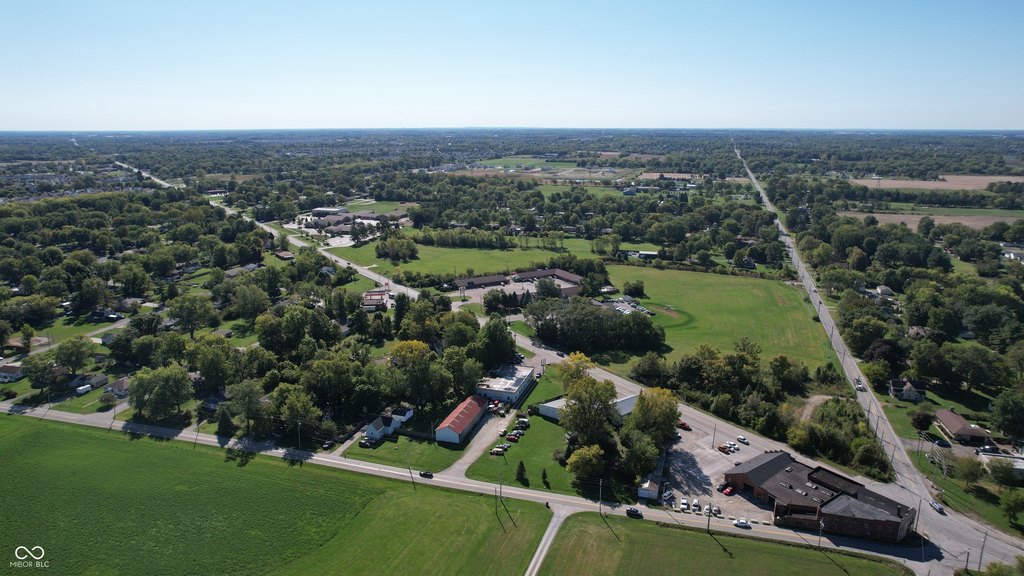
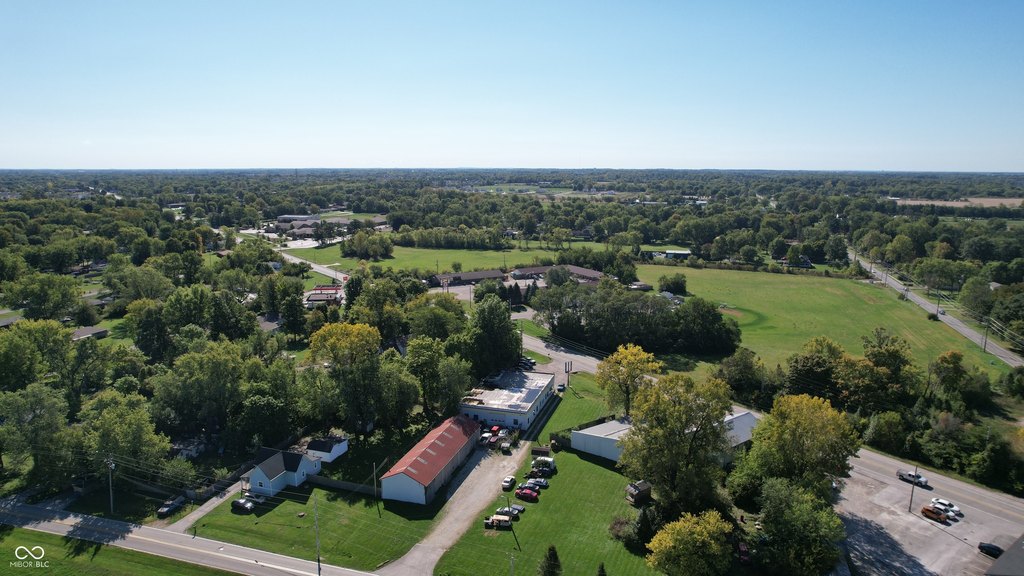
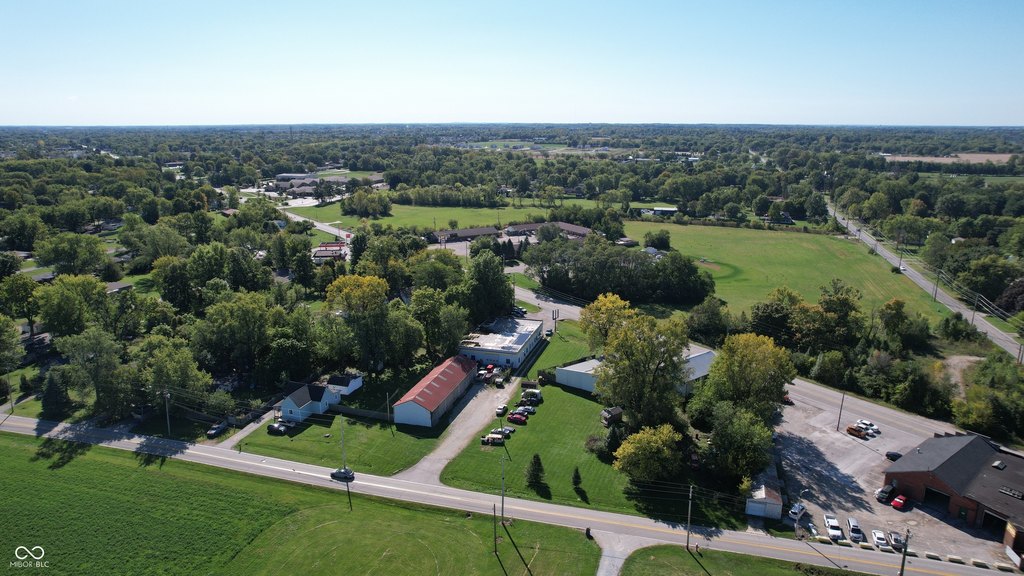
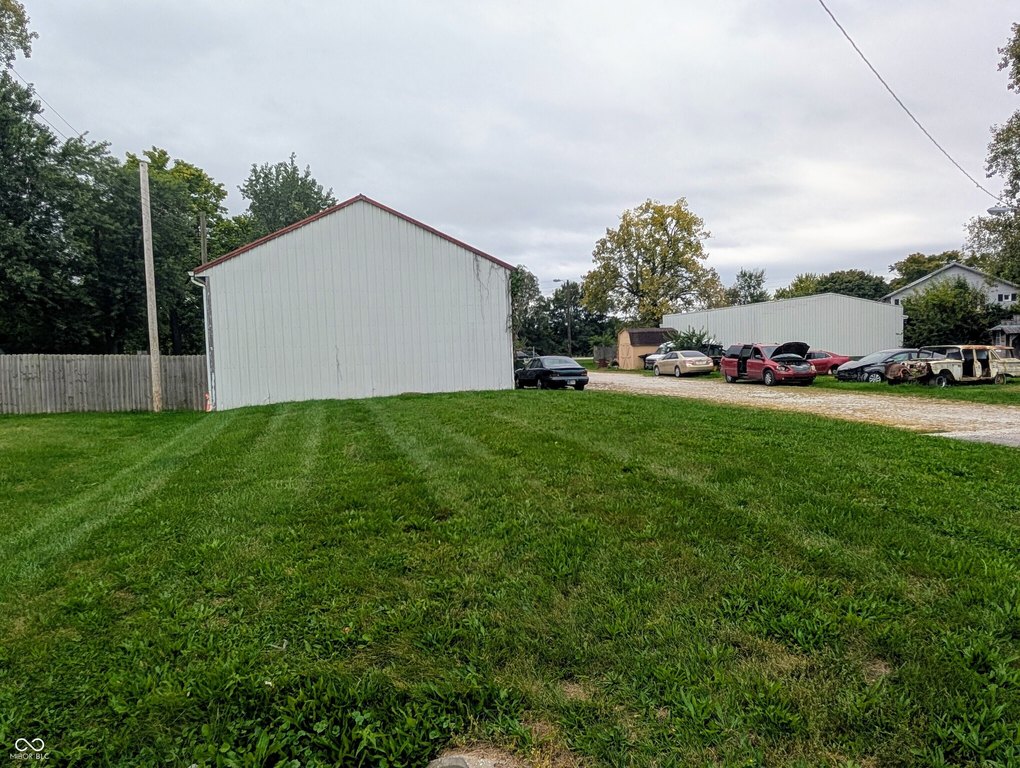
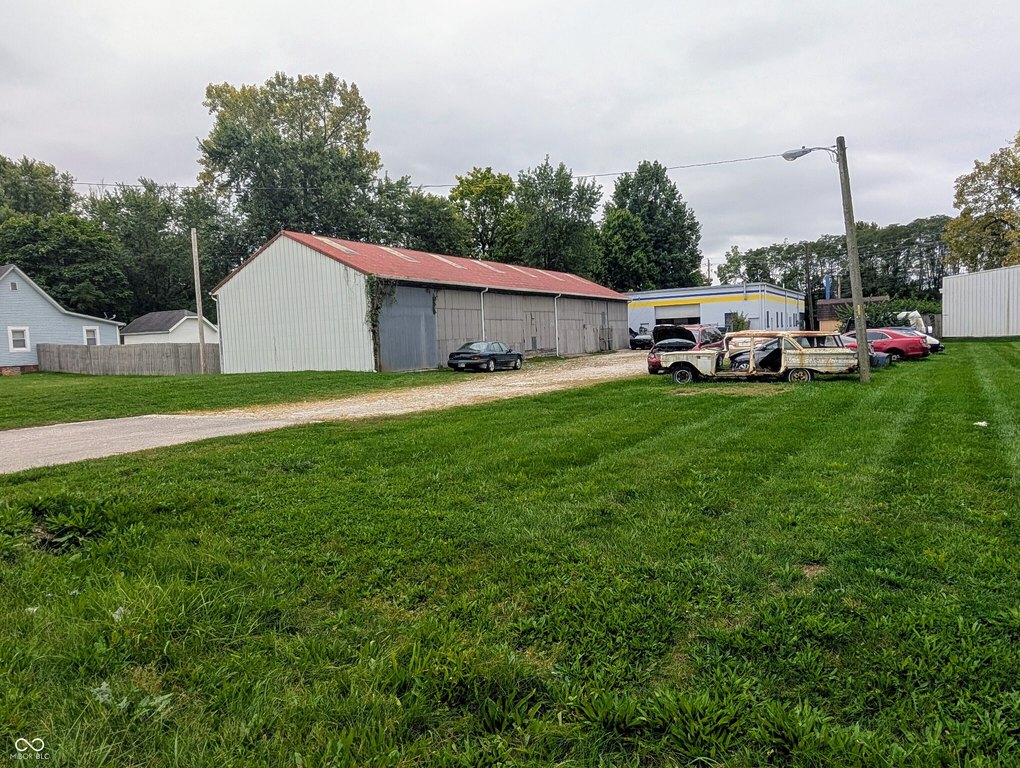
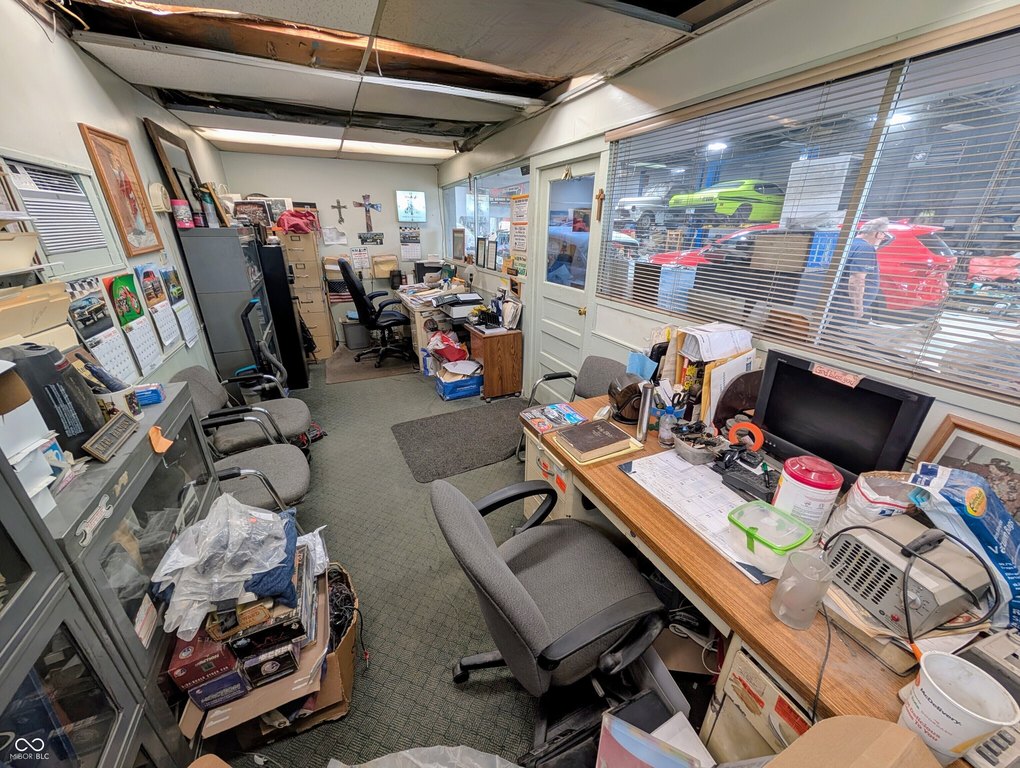
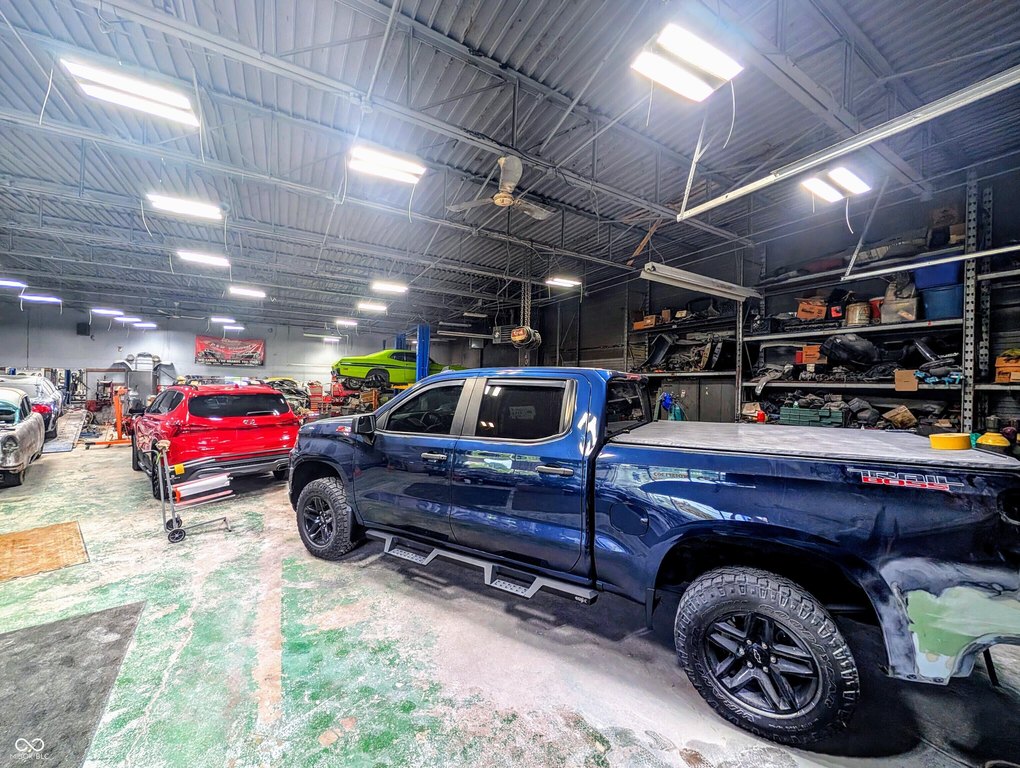
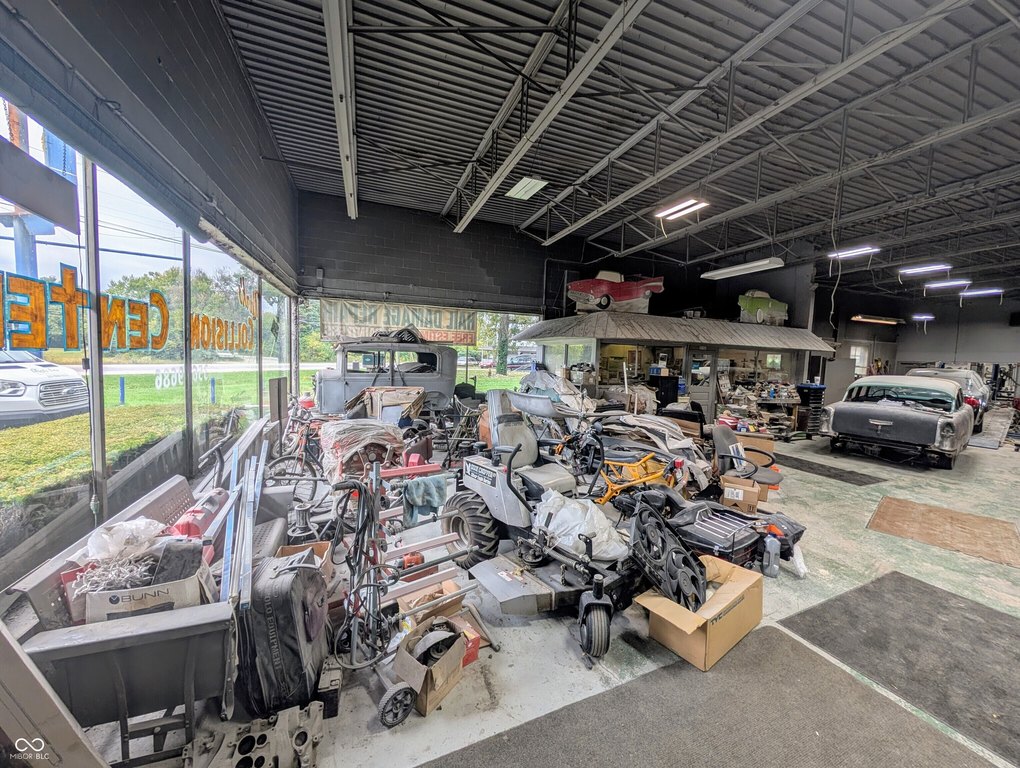
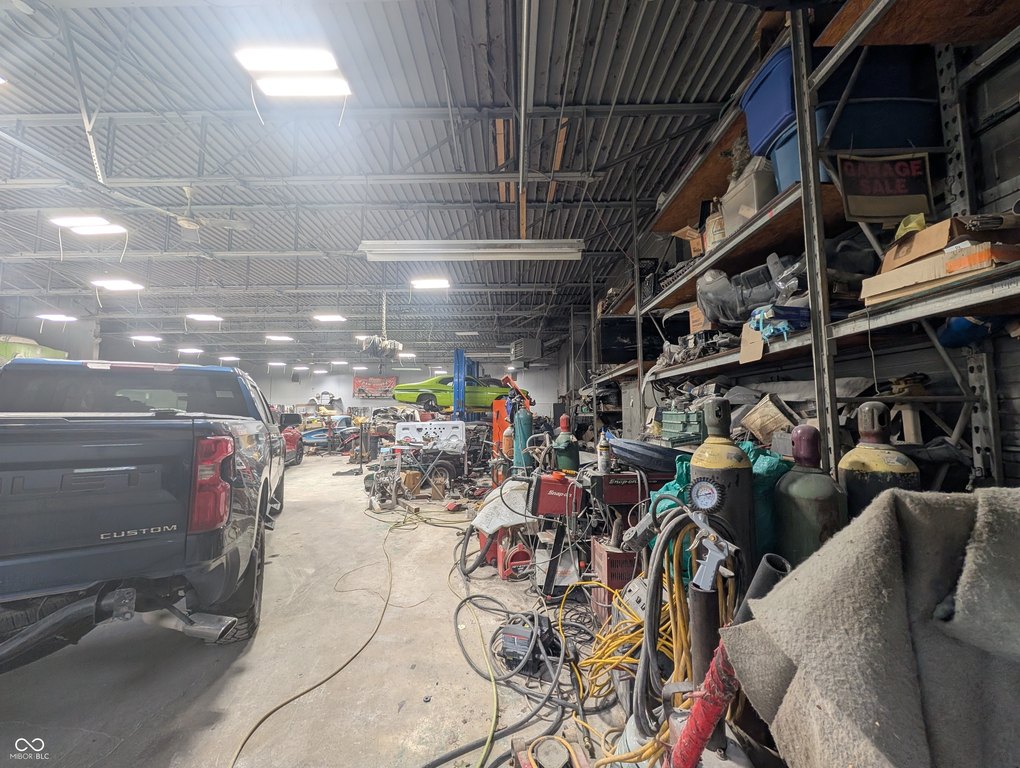
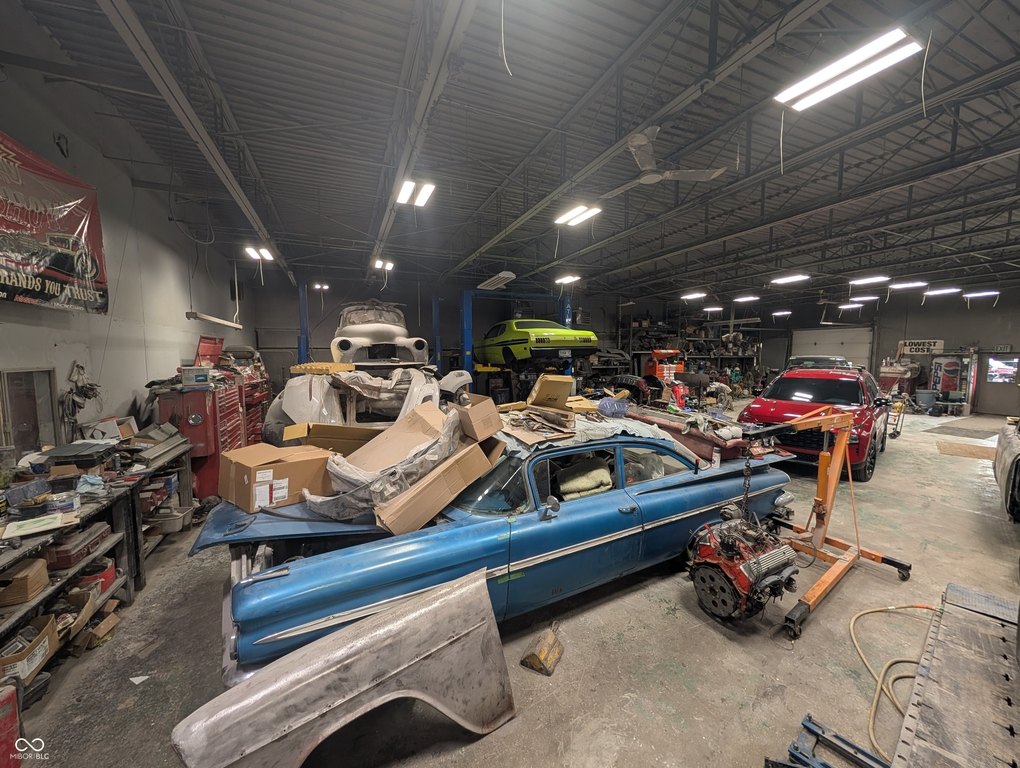
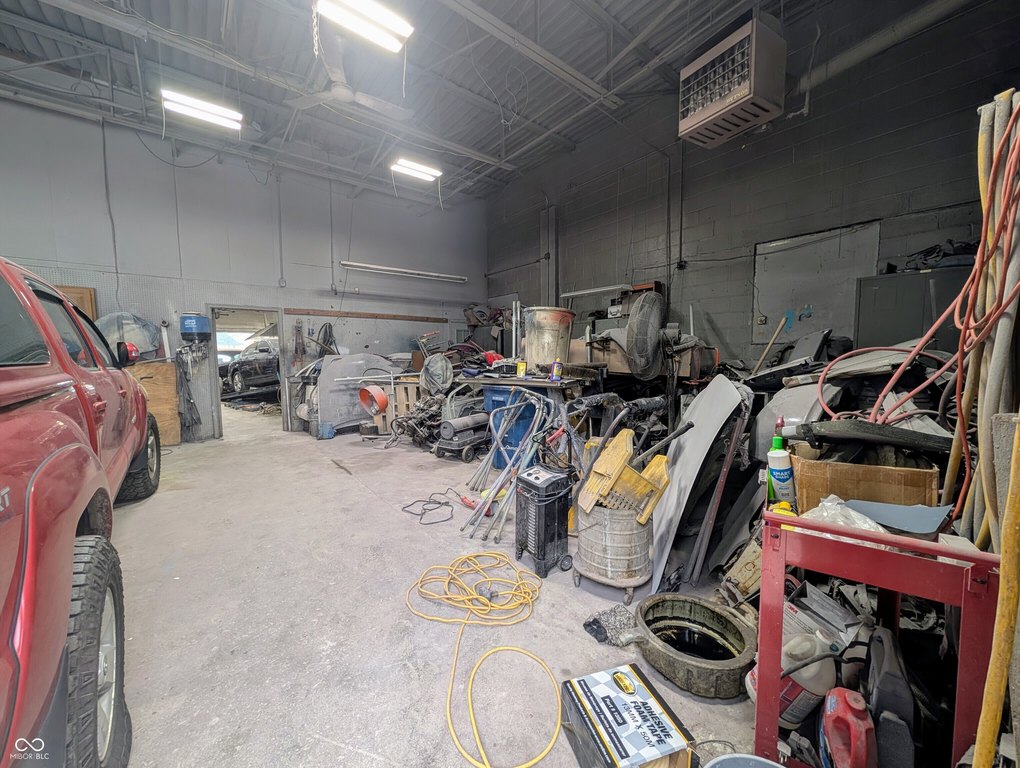
This automotive facility includes a 6,000-square-foot primary shop with an office, two bathrooms, a custom-built paint booth, and a separate computer room used to control paint mixes. A second pole barn-style building adds 3,000 square feet, measuring 30x100 feet with 16-foot ceilings. The property also has two post automotive lifts and accommodates equipment up to 14 feet tall.
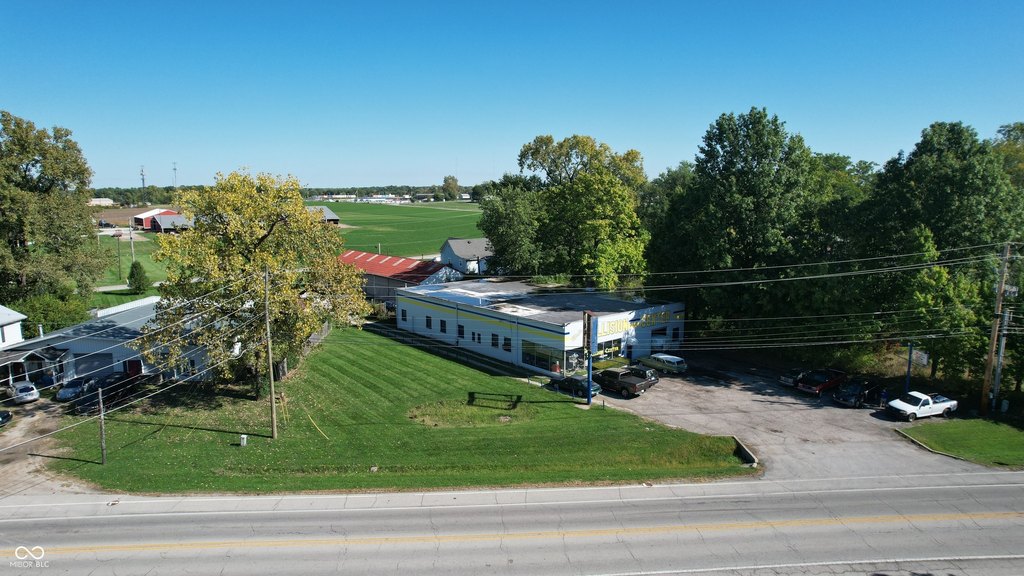
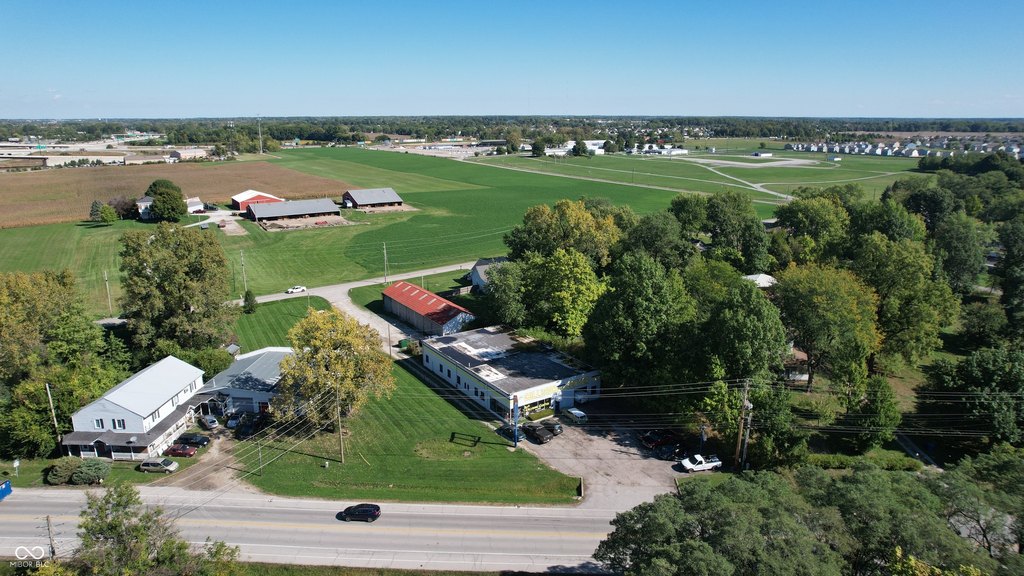
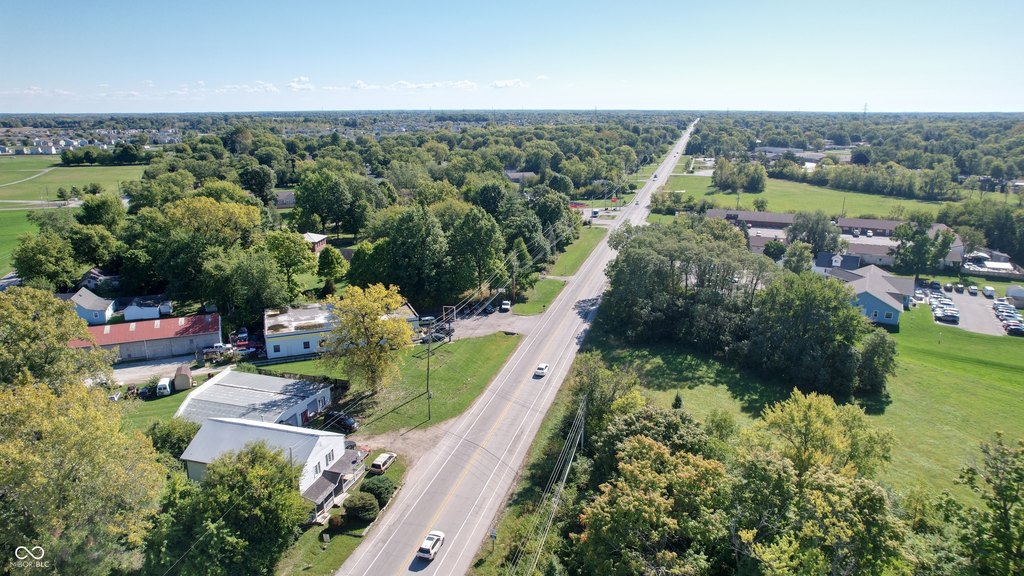
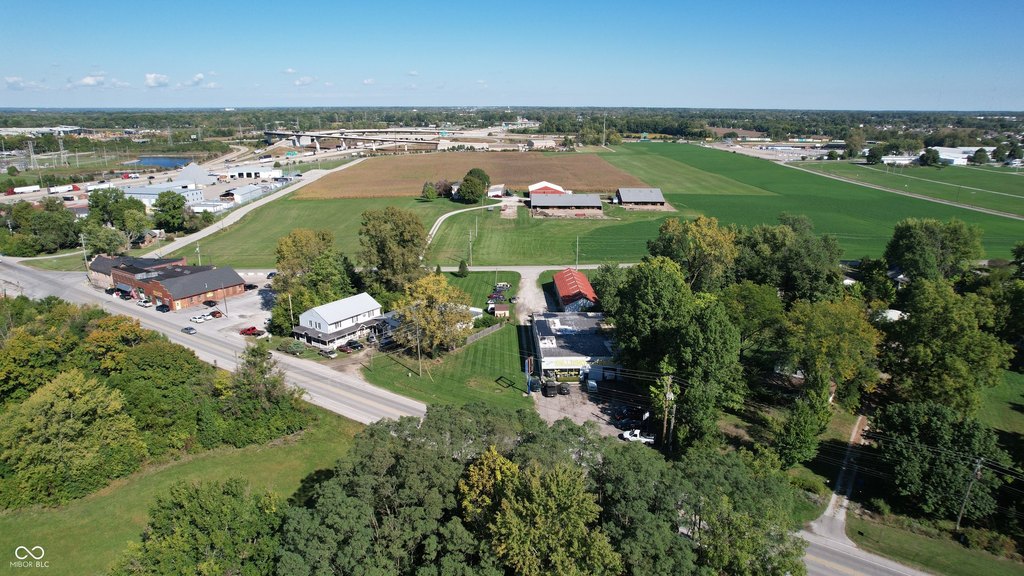
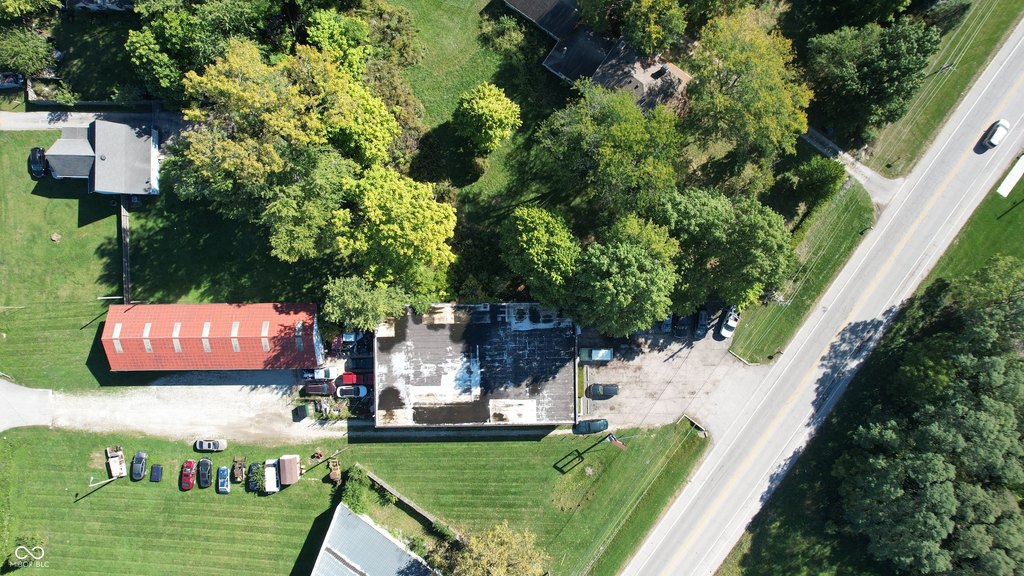
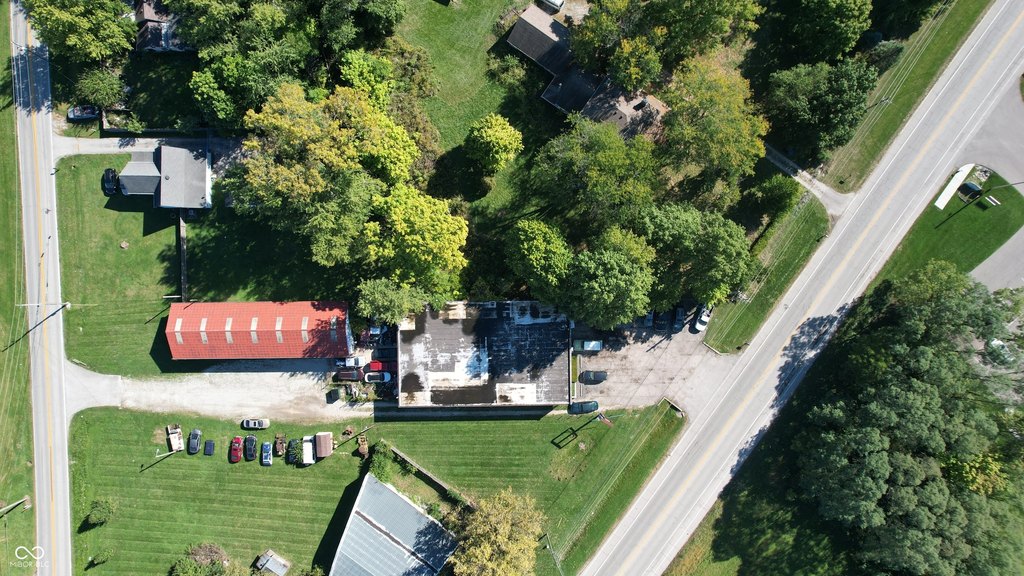
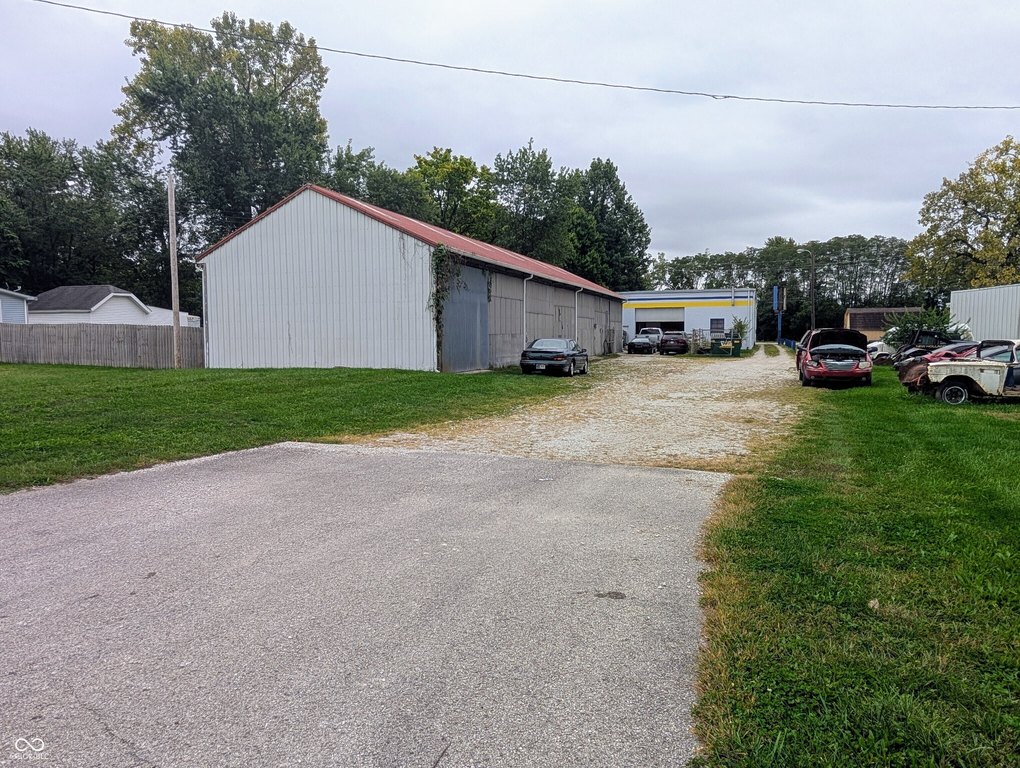
Front and rear road access are connected by a driveway through the site, supporting vehicle and equipment circulation. Additional features include open, guest, and garage parking, a fenced rear section, natural gas and forced-air heating, window-unit cooling, well water, and rubber and metal roofing. The property is zoned C4 and may be purchased as a vacant commercial facility or with the operating collision-repair business.
Front and rear road access are connected by a driveway through the site, supporting vehicle and equipment circulation. Additional features include open, guest, and garage parking, a fenced rear section, natural gas and forced-air heating, window-unit cooling, well water, and rubber and metal roofing. The property is zoned C4 and may be purchased as a vacant commercial facility or with the operating collision-repair business.
Key Highlights
- 6,000‑square‑foot primary automotive shop with office, two bathrooms, paint booth, and computer room
- 3,000‑square‑foot secondary building measuring 30x100 feet with 16‑foot ceilings
- Two post automotive lifts with capacity for equipment up to 14 feet tall
Property Analytics
Unlock full access to Insights
Subscribe to Realmo Intelligence
Open Analytics
Current Use
Lease Details
Turnkey business
Opportunity
Yes
Fenced yard
Yes
Paved road access
Location Intelligence
Trade Area within ½ mile
75
Businesses Nearby
Well-served
Demand for This Use
Explore this area
Business Placement
Demographics for 46239, IN
33,290
Population
12,284
Households
2.7
Avg Household Size
35
Median Age
37%
College-Educated
92%
High-School Grad
28.3 sq mi
ZIP Area
1,176
Density / Sq Mi
$92,160
Median Household Income
$49,543
Median Earnings
$1,304
Median Rent
$253,000
Median Home Value
Check the figures for this property
Cap Rate, Value Estimation, Potential NOI and more
View Realmo Analytics
Market
Vacancy Rate% for Retail in Indianapolis, IN

Questions? Ask Rey
Realmo’s AI knows this listing — price, zoning, demand, history. Ask anything.


Similar Off Market Nearby
- Copeland repair — 3231 Abaca Ct, Indianapolis, IN 46203
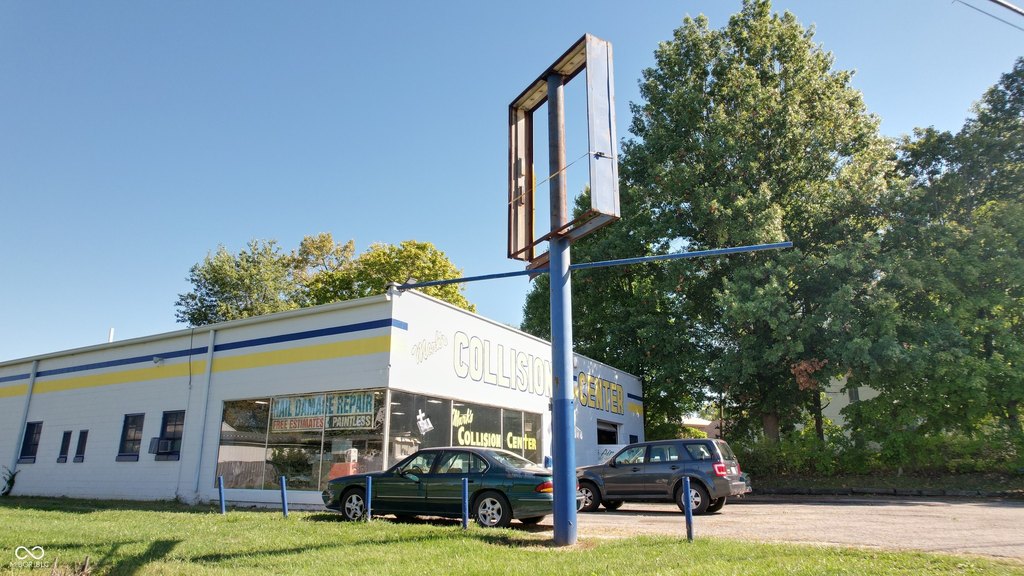
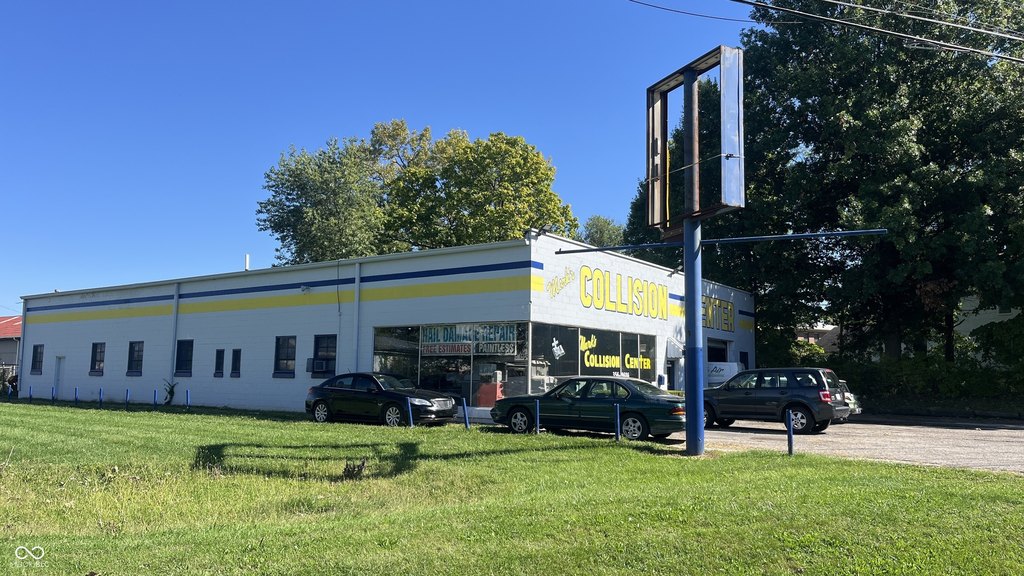
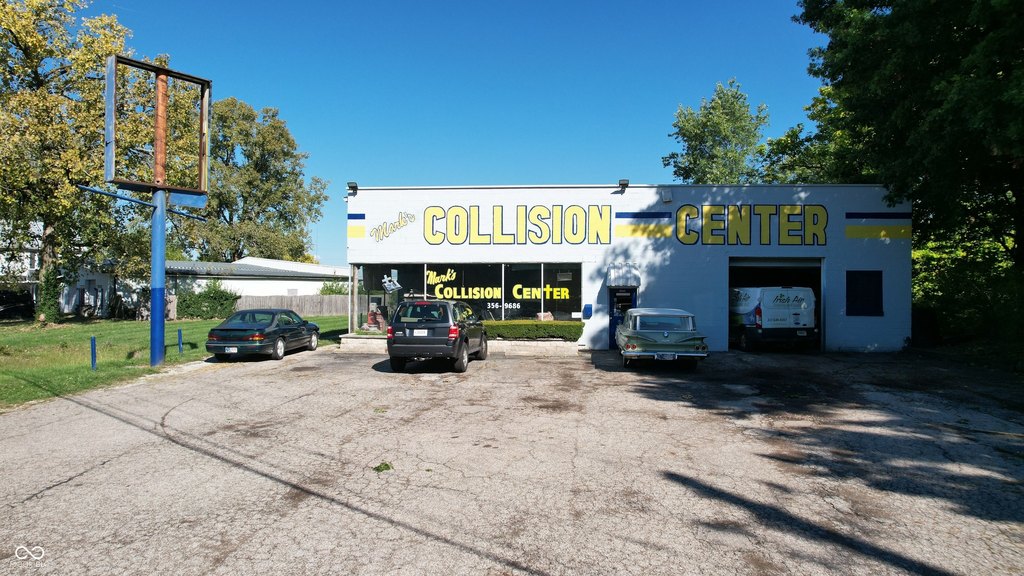
- Mark's Collision Center — 7086 Southeastern Ave, Indianapolis, IN 46239
- THE AUTO CENTER — 7006 Southeastern Ave, Indianapolis, IN 46239
- A&B Auto Diesel LLC — 7307 E Troy Ave, Indianapolis, IN 46239
- MacAllister Power Systems — 6300 Southeastern Ave suite c, Indianapolis, IN 46203
Frequently Asked Questions
What type of property is this?
Auto shop - C4-zoned facility with dual road access, a fenced rear area, and automotive repair improvements.
Where is this auto shop located?
The property is located at 7086 Southeastern Avenue Indianapolis, IN.
What is the asking price?
The asking price for this property is $1,100,000.
What are key features of this property?
This property features: 6,000‑square‑foot primary automotive shop with office, two bathrooms, paint booth, and computer room; 3,000‑square‑foot secondary building measuring 30x100 feet with 16‑foot ceilings; Two post automotive lifts with capacity for equipment up to 14 feet tall



