Turnkey Side-by-Side
For Sale
$995,000
708-710 Northeast 23rd Avenue, Pompano Beach, FL 33062
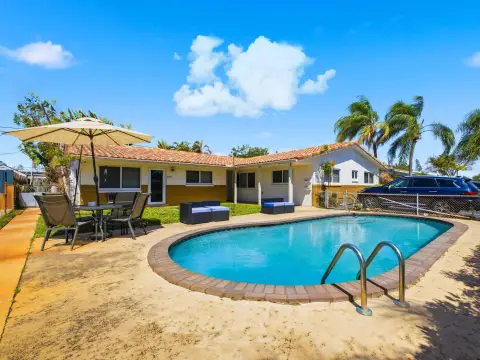
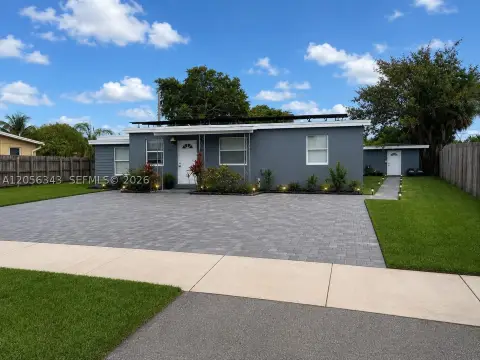
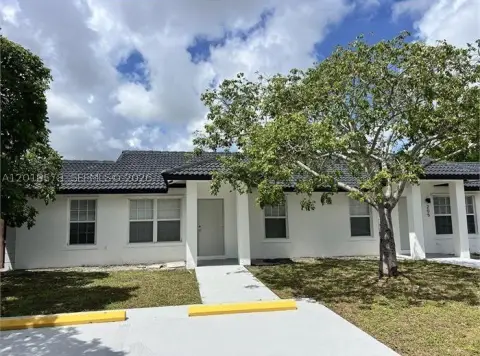
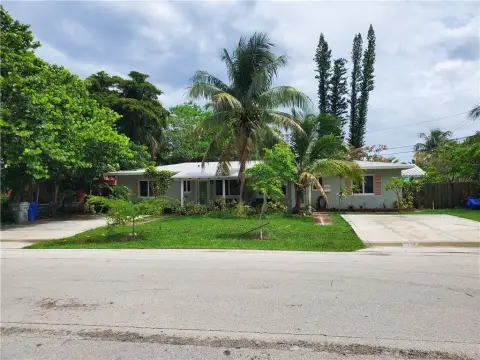
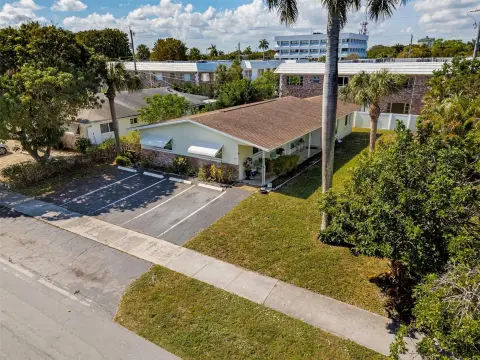
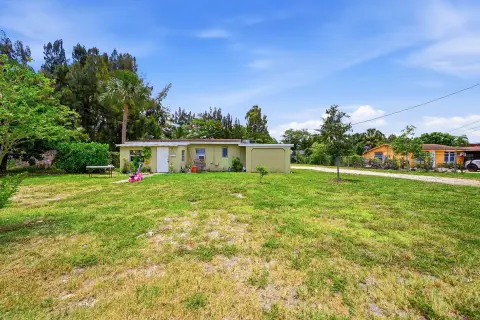
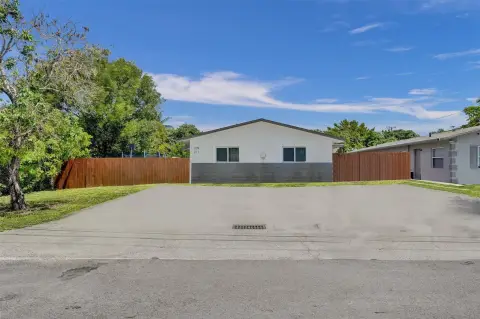
Fully renovated duplex offers two separate 2BR/1BA units with private entrances, fenced yards, and individually metered utilities.
Property Size2,192 SF
Price / SF$453.92
Days on Market254
Property Features for 708-710 Northeast 23rd Avenue
General Information
Standard status
Active
Size
2,192 SF
Property subtype
Residential Income / Duplex
Additional Details
Business Included
Yes
Highway Access
Yes
Multifamily Units
2
Taxes and HOA fees
Annual Taxes
$11,177
Amenities
Ceiling Fan(s), Central Air, Electric
Central, Electric
Tile
1
2
Patio, Porch
CBS, Stucco
Composition
Fenced
Duplex
Impact Glass
Jogging Path, Sidewalks, Street Lights, None
No
Yes
Porch, Patio, Porch - Open, Patio - Open
Building Details
Year Built
1968
Stories
1
Listing Agency:
Compass
Listed By:
James Lopez · License #3386064
(561) 558-5778
Source:
Compass
Added: Feb 1
Changed: Oct 11
Last Checked: Oct 12 at 10:21PM
Displayed information is deemed reliable but is not guaranteed and should be independently verified. All listing content including descriptions, pricing, images are the copyrighted material of Compass
Investment Insights
Based on property information with market context.
This fully renovated duplex is a rare side-by-side configuration featuring two spacious 2-bedroom, 1-bath units. Each unit has been updated top to bottom with modern open kitchens, quartz countertops, stainless steel appliances, tile flooring, and refreshed bathrooms. Both units include private entrances and their own individually fenced backyards with white PVC privacy fencing. Convenience features include full-size in-unit washer and dryer. The property also includes storm protection with a mix of impact windows and shutters, and recent major upgrades such as a new driveway and roof. Each unit is separately metered, supporting independent utility management.
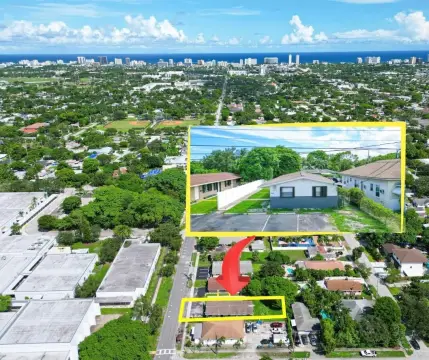
The property is located east of Federal Highway in Pompano Beach, with ample driveway parking. It is positioned minutes from the beach and A1A, as well as Pompano Pier, parks, dining, shopping, and major highways, supporting easy day-to-day access for residents and guests.
For tenants or owner-occupants, the layout provides two complete living spaces with separate entrances and outdoor areas, while also keeping utility billing split by unit. For investors, the turnkey nature of the renovations and the independently metered units can simplify operations for a multi-unit rental strategy. There is no HOA.
The property is located east of Federal Highway in Pompano Beach, with ample driveway parking. It is positioned minutes from the beach and A1A, as well as Pompano Pier, parks, dining, shopping, and major highways, supporting easy day-to-day access for residents and guests.
For tenants or owner-occupants, the layout provides two complete living spaces with separate entrances and outdoor areas, while also keeping utility billing split by unit. For investors, the turnkey nature of the renovations and the independently metered units can simplify operations for a multi-unit rental strategy. There is no HOA.
Key Highlights
- Fully renovated side‑by‑side duplex built in 1968 with two 2BR/1BA units
- Each unit offers 1,000+ SF, private entrance, and a separately fenced backyard
- Updates include modern open kitchens with quartz countertops and stainless steel appliances
Financial Insights
Estimated NOI and Cap Rate
NOI / Yr
$36,656
Cap Rate
3.68%
Suggested Prices Based on Cap Rates
Cap Rate 5%
$733,120
$733.1K
Cap Rate 7%
$523,657
$523.7K
Cap Rate 9%
$407,289
$407.3K
Market Conditions
NOI Build-Up for 2,192 SF
Gross rent
$55.2K $25.20/SF
− Vacancy
−$2.9K −$1.31/SF
EGI
$52.4K $23.89/SF
− OpEx
−$15.7K −$7.17/SF
NOI
$36.7K $16.72/SF
Area
Pompano Beach, FL
Vacancy
5.20%
Lease Rate
$25.20 /SF/Yr
Expense Ratio
30.00%
Simulate Cap Rate and NOI
Suggested Prices Based on Cap Rates
Cap Rate 5%
$733,120
Cap Rate 7%
$523,657
Cap Rate 9%
$407,289
Alternative Uses
Best Use
Multifamily LT 5
$523.7K
$458.2K – $610.9K
NOI $36,656 @ 7.0% cap · market cap 3.68%
Second Best
Apartment 5plus
$481.0K
$420.9K – $561.2K
NOI $33,672 @ 7.0% cap · market cap 3.38%
Theoretical Best
Office A
$854.9K
$748.0K – $997.4K
NOI $59,842 @ 7.0% cap · market cap 6.01%
Zoning and permitted uses should be independently verified with authorities.
How Realmo checks its estimates
Property Analytics
Unlock full access to Insights
Subscribe to Realmo Intelligence
Open Analytics
Current Use
Lease Details
2
Residential units
Turnkey business
Opportunity
Yes
Highway access
Location Intelligence
Trade Area within ½ mile
2,363
Businesses Nearby
Explore this area
Business Placement
Demographics for 33062, FL
25,293
Population
23,059
Households
1.1
Avg Household Size
60
Median Age
48%
College-Educated
94%
High-School Grad
3.9 sq mi
ZIP Area
6,485
Density / Sq Mi
$82,955
Median Household Income
$56,828
Median Earnings
$1,888
Median Rent
$511,800
Median Home Value
Check the figures for this property
Cap Rate, Value Estimation, Potential NOI and more
View Realmo Analytics
Market
Vacancy Rate% for Multifamily in South region

Questions? Ask Rey
Realmo’s AI knows this listing — price, zoning, demand, history. Ask anything.




Frequently Asked Questions
What type of property is this?
Duplex - Fully renovated duplex offers two separate 2BR/1BA units with private entrances, fenced yards, and individually metered utilities.
Where is this duplex located?
The property is located at 708-710 Northeast 23rd Avenue Pompano Beach, FL.
What is the asking price?
The asking price for this property is $995,000.
What are key features of this property?
This property features: Fully renovated side‑by‑side duplex built in 1968 with two 2BR/1BA units; Each unit offers 1,000+ SF, private entrance, and a separately fenced backyard; Updates include modern open kitchens with quartz countertops and stainless steel appliances


