Mixed-Use Building with Renovated
For Sale
$2,985,000
707 8th St, Washington, DC 20003
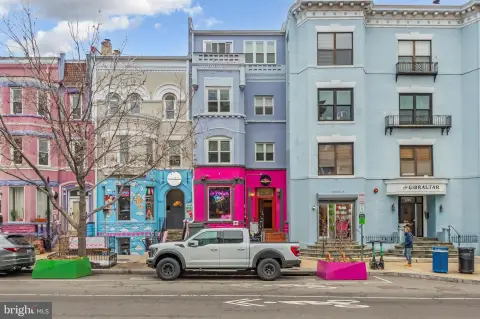
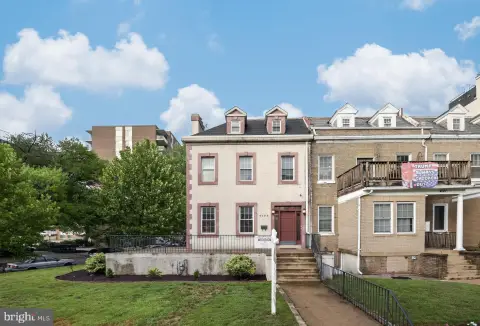
Renovated mixed-use property offering flexible street-level space plus additional office and multi-unit potential.
Property Size7,400 SF
Price / SF$403.38
Days on Market1159
Property Features for 707 8th St
General Information
Standard status
Active
Size
7,400 SF
Property subtype
Mixed Use
Occupancy
20%
Taxes and HOA fees
Annual Taxes
$28
Amenities
Central Air, A/C - Zone, Ceiling Fan(s)
3
Hardwood, Ceramic Tile, Laminate, Carpet
Carbon Monoxide Detector
MU-4/CHC
Other, City
Sliding Glass Door, Atrium. Other.
Building Details
Year Built
1908
Listing Agency:
Coldwell Banker Realty
(202) 547-3525
Listed By:
Washington
(202) 258-5316
Source:
Xome
Added: Aug 20, 2023
Changed: Sep 2
Last Checked: Oct 7 at 2:06PM
Displayed information is deemed reliable but is not guaranteed and should be independently verified. All listing content including descriptions, pricing, images are the copyrighted material of Coldwell Banker Realty

Ask AI about this property
Review the available facts, identify missing information and prepare questions for the agent.
Investment Insights
Based on property information with market context.
707-709 8th St SE is a larger mixed-use building created from an earlier combination of two properties, resulting in a notably open first-floor layout. The property features fully renovated space with a very large, renovated street-floor area suitable for a range of uses, along with two large dedicated office spaces. Additional floor area is available for multi-apartment and/or office configurations.
The building is positioned in the heart of the Capitol Hill commercial district, with proximity to Eastern Market Metro and the Capitol. It is also described as being adjacent to the Barracks Row retail and restaurant area and across from the U.S. Marine Barracks.
The offering includes flexibility in how the space may be used, with the property described as 80% vacant and possibly 100% vacant if required by the buyer. Materials and showing information are available, and the listing notes pictures and floor plans are attached.
The building is positioned in the heart of the Capitol Hill commercial district, with proximity to Eastern Market Metro and the Capitol. It is also described as being adjacent to the Barracks Row retail and restaurant area and across from the U.S. Marine Barracks.
The offering includes flexibility in how the space may be used, with the property described as 80% vacant and possibly 100% vacant if required by the buyer. Materials and showing information are available, and the listing notes pictures and floor plans are attached.
Key Highlights
- Fully renovated 1908 mixed‑use building with 7000+ SF of total space
- Open street‑level retail space on the first floor with 2500+ SF, suited for multiple business and service uses
- Property includes 2 very large dedicated office areas plus additional floor space for multi‑unit or office use
Financial Insights
Estimated NOI and Cap Rate
NOI / Yr
$141,392
Cap Rate
4.74%
Suggested Prices Based on Cap Rates
Cap Rate 5%
$2,827,840
$2.8M
Cap Rate 7%
$2,019,886
$2.0M
Cap Rate 9%
$1,571,022
$1.6M
Market Conditions
NOI Build-Up for 7,400 SF
Gross rent
$195.4K $26.40/SF
− Vacancy
−$6.8K −$0.92/SF
EGI
$188.5K $25.48/SF
− OpEx
−$47.1K −$6.37/SF
NOI
$141.4K $19.11/SF
Area
Washington, DC
Vacancy
3.50%
Lease Rate
$26.40 /SF/Yr
Expense Ratio
25.00%
Simulate Cap Rate and NOI
Suggested Prices Based on Cap Rates
Cap Rate 5%
$2,827,840
Cap Rate 7%
$2,019,886
Cap Rate 9%
$1,571,022
Alternative Uses
Best Use
Specialty Retail
$2.02M
$1.77M – $2.36M
NOI $141,392 @ 7.0% cap · market cap 4.74%
Second Best
Mixed Use
$1.74M
$1.53M – $2.04M
NOI $122,100 @ 7.0% cap · market cap 4.09%
Theoretical Best
Office A
$3.81M
$3.33M – $4.44M
NOI $266,443 @ 7.0% cap · market cap 8.93%
Zoning and permitted uses should be independently verified with authorities.
How Realmo checks its estimates
Property Analytics
Unlock full access to Insights
Subscribe to Realmo Intelligence
Open Analytics
Current Use
Lease Details
20%
Occupancy
Location Intelligence
Trade Area within ½ mile
4,065
Businesses Nearby
55k
Monthly Visits Nearby
Explore this area
Business Placement
Foot Traffic Nearby
Shops & Services 50%
Dining 28%
Hotels & Casinos 16%
Home Improvements & Furnishings 4%
BP
Shops & Services
9,147 visits/mo
0.2 miles
Courtyard Washington Capitol Hill/Navy Yard
Hotels & Casinos
8,919 visits/mo
0.5 miles
Sunoco
Shops & Services
8,371 visits/mo
0.4 miles
Jeni's Splendid Ice Creams
Dining
6,636 visits/mo
0.1 miles
Exxon
Shops & Services
6,608 visits/mo
0.3 miles
Demographics for 20003, DC
36,501
Population
20,817
Households
1.8
Avg Household Size
35
Median Age
81%
College-Educated
97%
High-School Grad
2.3 sq mi
ZIP Area
15,870
Density / Sq Mi
$159,604
Median Household Income
$107,846
Median Earnings
$2,630
Median Rent
$954,200
Median Home Value
Check the figures for this property
Cap Rate, Value Estimation, Potential NOI and more
View Realmo Analytics
Market
Vacancy Rate% for Retail in Washington, DC




Frequently Asked Questions
What type of property is this?
Mixed-use property - Renovated mixed-use property offering flexible street-level space plus additional office and multi-unit potential.
Where is this mixed-use property located?
The property is located at 707 8th St Washington, DC.
What is the asking price?
The asking price for this property is $2,985,000.
What are key features of this property?
This property features: Fully renovated 1908 mixed‑use building with 7000+ SF of total space; Open street‑level retail space on the first floor with 2500+ SF, suited for multiple business and service uses; Property includes 2 very large dedicated office areas plus additional floor space for multi‑unit or office use


