Duplex with ADU
For Sale
$675,000
706 W 42nd, Los Angeles, CA 90037
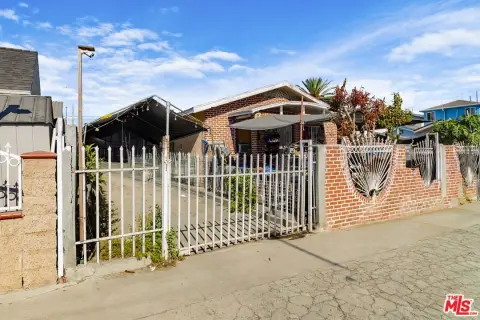
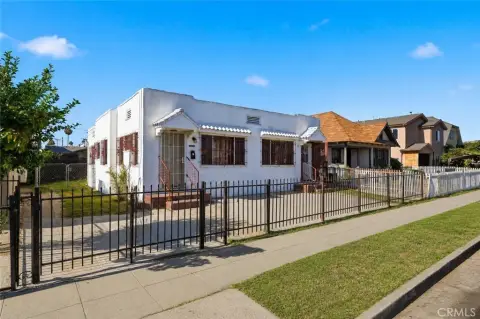
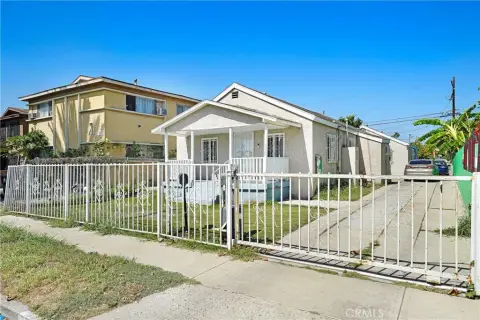
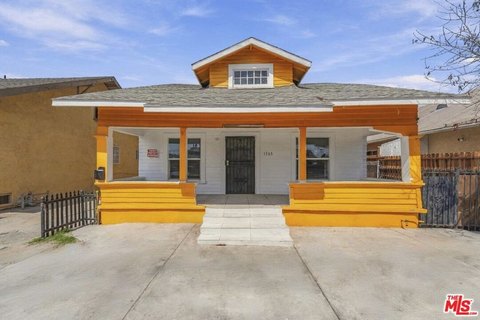
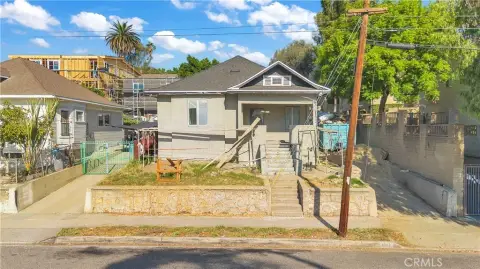
Two-unit property with spacious interiors, a backyard, and a garage undergoing conversion into additional living space.
Property Size1,324 SF
Days on Market55
Property Features for 706 W 42nd
General Information
Standard status
Active
Size
1,324 SF
Property subtype
MULTI_FAMILY
Units
Unit Mix
1 x 3BR/1.5BA, 1 x 1BR/1BA
Multifamily Units
2
Additional Details
Highway Access
Yes
Amenities
backyard
extra-long driveway
Building Details
Building Size
1,324 SF
Year Built
1907
Buildings
1
Listing Agency:
Elite Homes Realty
Listed By:
Terry Avendano · License #01207004
(562) 547-1778
Source:
Rochellemaize
Added: Aug 21
Changed: Oct 9
Last Checked: Oct 12 at 11:57PM
Displayed information is deemed reliable but is not guaranteed and should be independently verified. All listing content including descriptions, pricing, images are the copyrighted material of Elite Homes Realty
Investment Insights
Based on property information with market context.
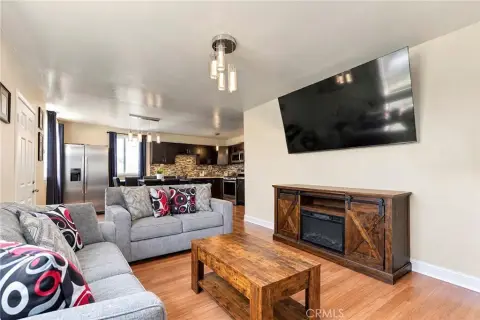
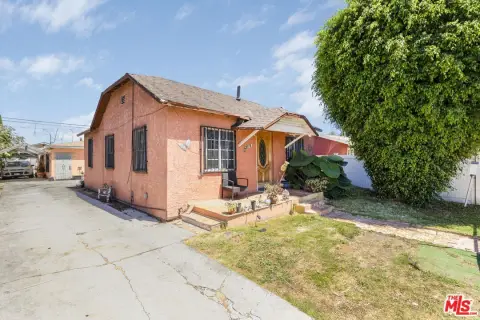
Built in 1907, this duplex includes two distinct residential units. The larger front residence offers 3 bedrooms, 1.5 bathrooms, living and dining areas, and a kitchen with substantial cabinet storage. The second unit contains 1 bedroom, 1 bathroom, a living area, and ample closet space.
A 2-car garage is currently being converted into an ADU, adding another source of usable living area once completed. The property also includes an extra-long driveway and a spacious backyard. USC, the Los Angeles Memorial Coliseum, and BMO Stadium are within walking distance, with freeway access nearby.
A 2-car garage is currently being converted into an ADU, adding another source of usable living area once completed. The property also includes an extra-long driveway and a spacious backyard. USC, the Los Angeles Memorial Coliseum, and BMO Stadium are within walking distance, with freeway access nearby.
Key Highlights
- Front unit includes 3 bedrooms, 1.5 bathrooms, living and dining areas, and a spacious kitchen
- Second unit offers 1 bedroom, 1 bathroom, a living area, and ample closet space
- 2‑car garage currently undergoing conversion into an ADU
Financial Insights
Estimated NOI and Cap Rate
NOI / Yr
$22,121
Cap Rate
3.28%
Suggested Prices Based on Cap Rates
Cap Rate 5%
$442,420
$442.4K
Cap Rate 7%
$316,014
$316.0K
Cap Rate 9%
$245,789
$245.8K
Market Conditions
NOI Build-Up for 1,324 SF
Gross rent
$32.4K $24.48/SF
− Vacancy
−$810 −$0.61/SF
EGI
$31.6K $23.87/SF
− OpEx
−$9.5K −$7.16/SF
NOI
$22.1K $16.71/SF
Area
ZIP 90037
Vacancy
2.50%
Lease Rate
$24.48 /SF/Yr
Expense Ratio
30.00%
Simulate Cap Rate and NOI
Suggested Prices Based on Cap Rates
Cap Rate 5%
$442,420
Cap Rate 7%
$316,014
Cap Rate 9%
$245,789
Alternative Uses
Best Use
Multifamily LT 5
$316.0K
$276.5K – $368.7K
NOI $22,121 @ 7.0% cap · market cap 3.28%
Second Best
Apartment 5plus
$280.9K
$245.8K – $327.7K
NOI $19,661 @ 7.0% cap · market cap 2.91%
Theoretical Best
Office A
$518.8K
$453.9K – $605.3K
NOI $36,315 @ 7.0% cap · market cap 5.38%
Zoning and permitted uses should be independently verified with authorities.
How Realmo checks its estimates
Property Analytics
Current Use
Lease Details
2
Residential units
Yes
Highway access
Location Intelligence
Trade Area within ½ mile
1,689
Businesses Nearby
Explore this area
Business Placement
Demographics for 90037, CA
63,706
Population
18,709
Households
3.4
Avg Household Size
33
Median Age
9%
College-Educated
54%
High-School Grad
2.9 sq mi
ZIP Area
21,968
Density / Sq Mi
$56,417
Median Household Income
$29,857
Median Earnings
$1,438
Median Rent
$632,600
Median Home Value
Market
Vacancy Rate% for Multifamily in West region

Questions? Ask Rey
Realmo’s AI knows this listing — price, zoning, demand, history. Ask anything.




Frequently Asked Questions
What type of property is this?
Duplex - Two-unit property with spacious interiors, a backyard, and a garage undergoing conversion into additional living space.
Where is this duplex located?
The property is located at 706 W 42nd Los Angeles, CA.
What is the asking price?
The asking price for this property is $675,000.
What are key features of this property?
This property features: Front unit includes 3 bedrooms, 1.5 bathrooms, living and dining areas, and a spacious kitchen; Second unit offers 1 bedroom, 1 bathroom, a living area, and ample closet space; 2‑car garage currently undergoing conversion into an ADU