Brick Duplex on
For Sale
$335,000
7053 W Farm Road 106, Springfield, MO 65803
Residential Income, Springfield, MO
Property SizeContact for details
Lot Size4.09 Acres
Days on Market50
Property Features for 7053 W Farm Road 106
General Information
Property type
Residential Multi Family
Property subtype
Duplex
Zoning
A-1
Bedrooms
5
Bathrooms
1
Full bathrooms
1
Rooms
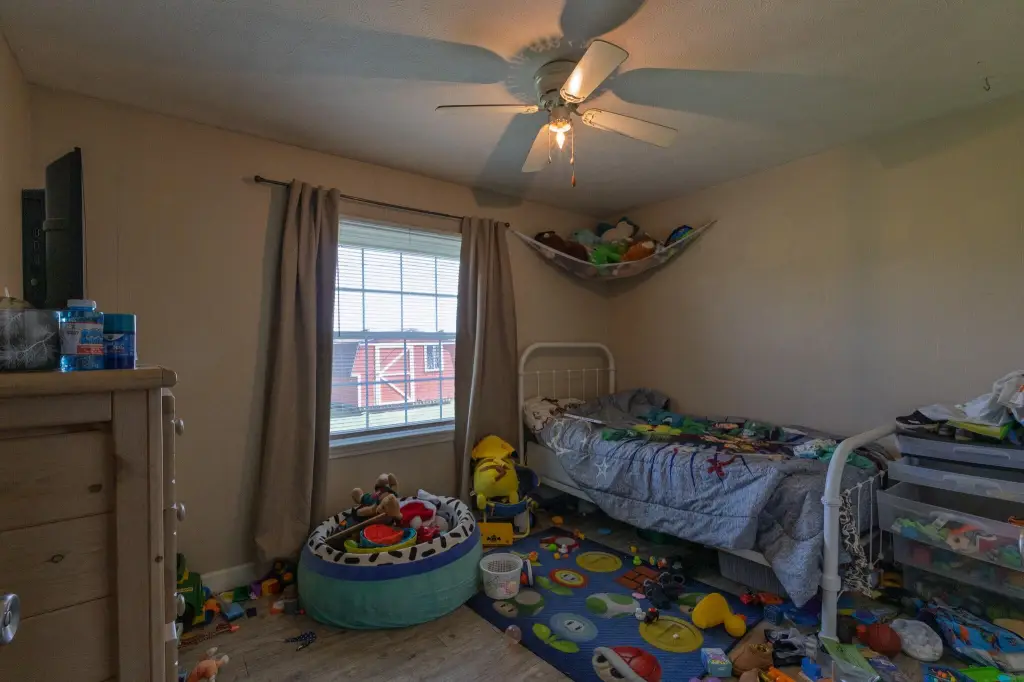
Bedroom 1, Bedroom 5, Bedroom 4, Bedroom 3, Bedroom 2, Bathroom 1
Interior features
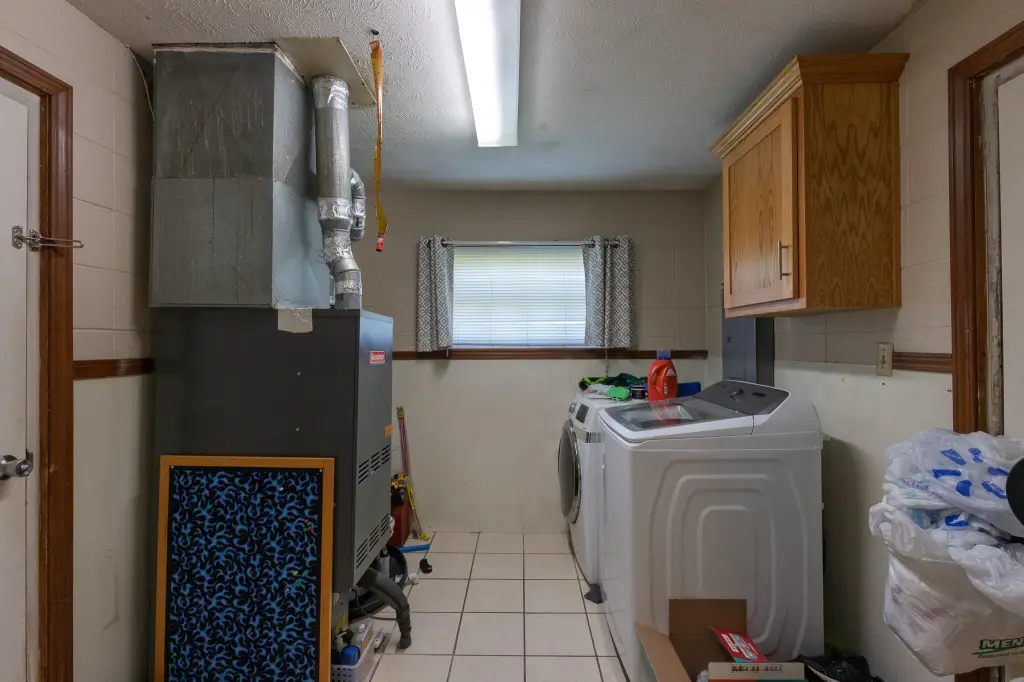
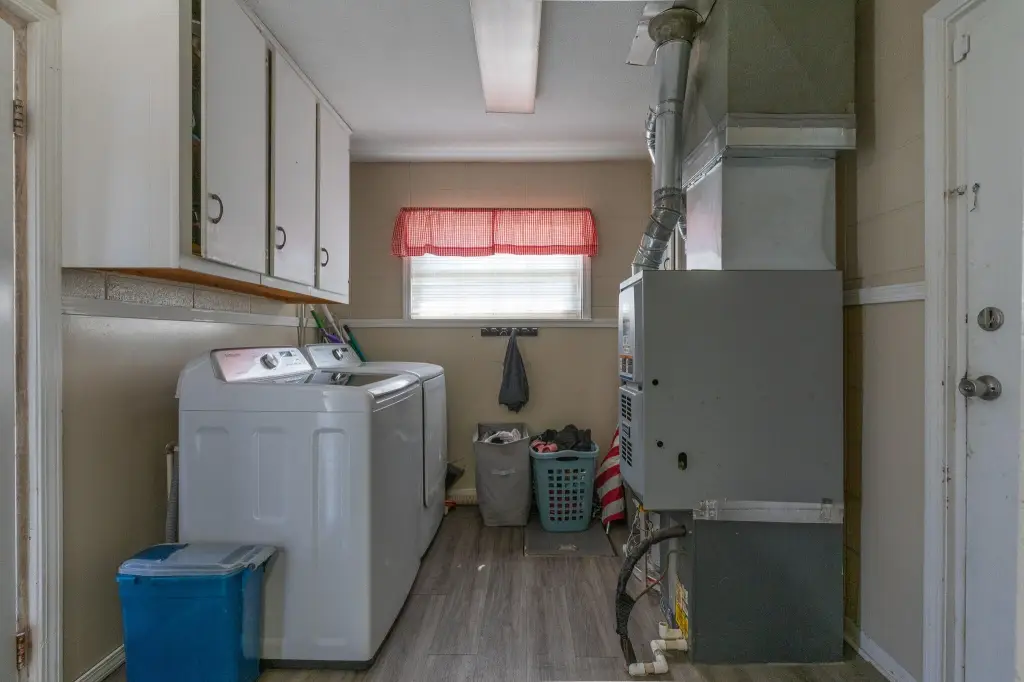
Washer/Dryer Hookup
Appliances
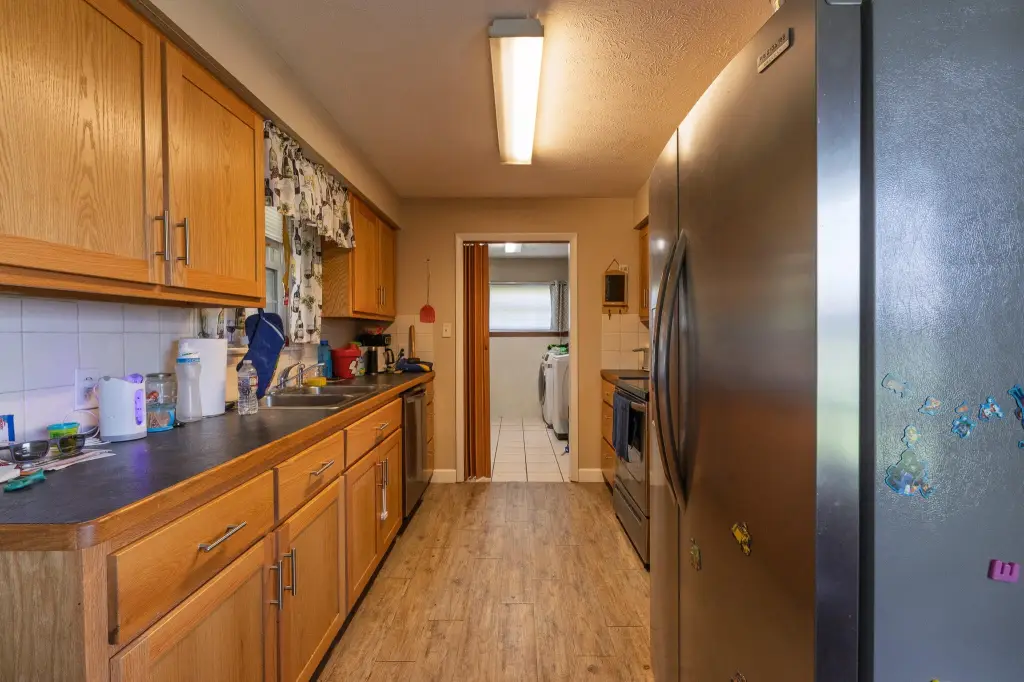
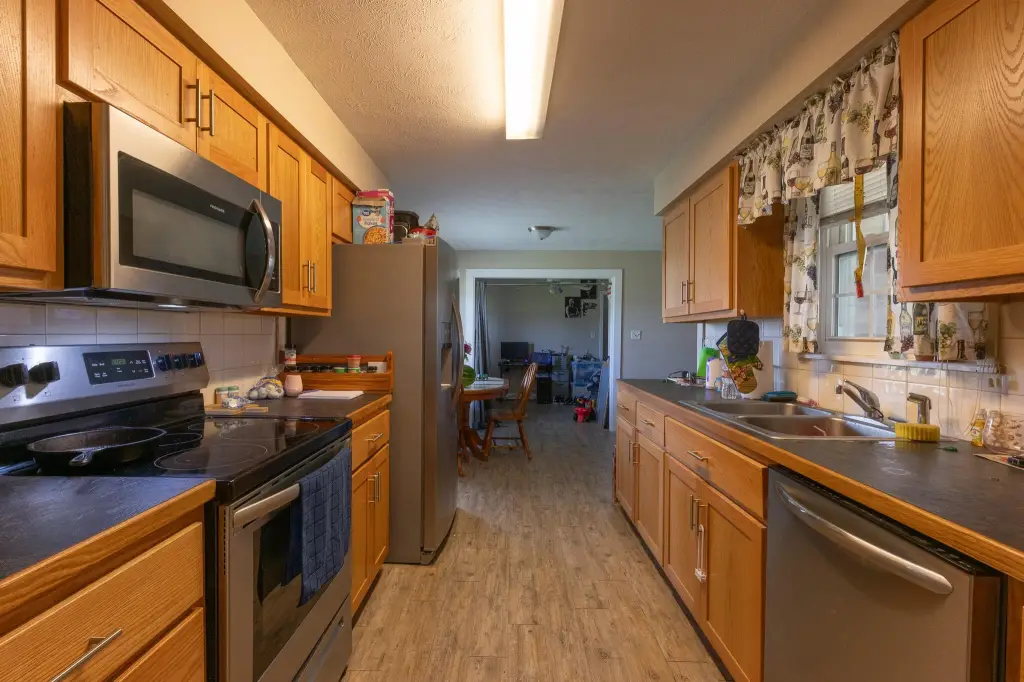
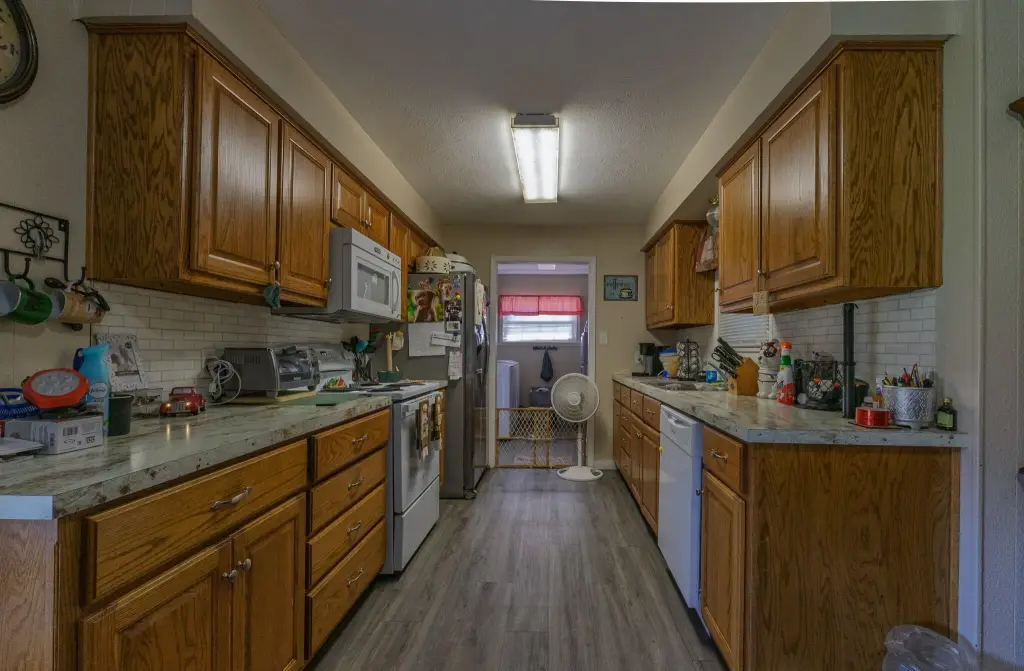
Range, Dishwasher, Refrigerator, Microwave
Elementary school
WD Central
Middle school
Willard
High school
Willard
Directions
From W Hwy 266 (Chestnut Expressway), North on State Hwy AB, East on Farm Road 106 to duplex on the north.
Standard status
Active
APN
1403100164
Lot size
4.09 Acres
Taxes and HOA fees
Tax Year
2025
Tax Annual Amount
1973
HOA Fee
$2,180 Annually
Utilities
Utilities
Natural Gas Available
Sewer type
Shared Septic
Heating system
Central
Cooling system
Ceiling Fan(s), Central Air
Amenities
Pond
Building Details
Year built
1967
Number of units
2
Building materials
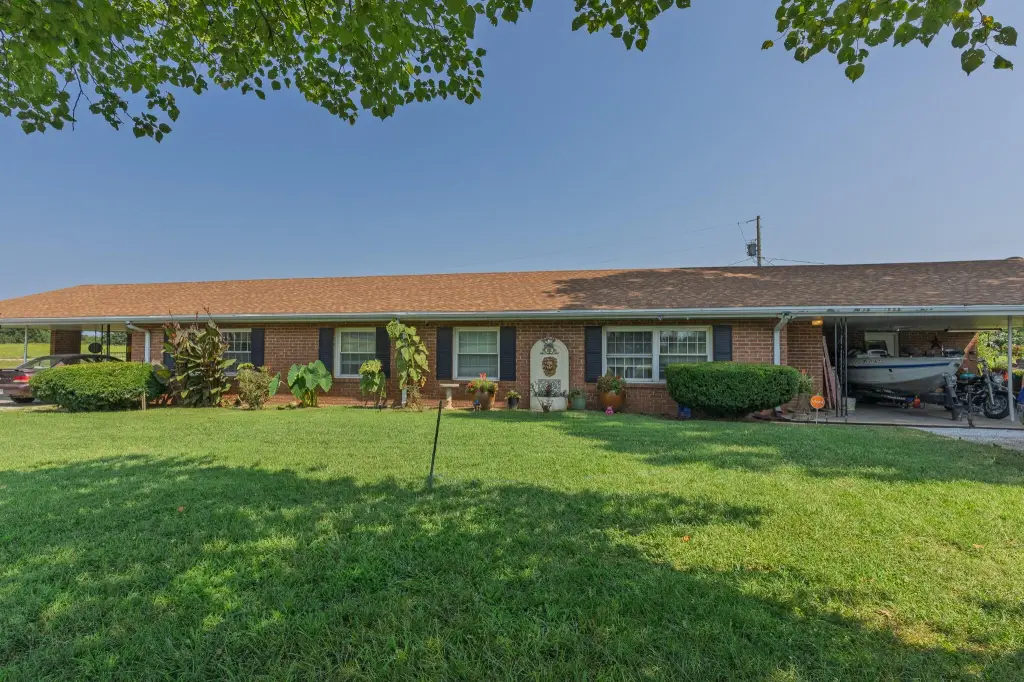
Brick
Roof type
Shingle
Listing Agency:
AMAX Real Estate
(417) 855-2333
Listed By:
Darlana Halterman
(417) 880-0713
Added: Aug 9
Changed: Sep 21
Last Checked: Sep 27 at 10:06PM
MLS# 60331048
Copyright © 2026 Southern Missouri Regional MLS, LLC (SOMO). All rights reserved. All information provided by the listing agent/broker is deemed reliable but is not guaranteed and should be independently verified.
Investment Insights
Based on property information with market context.
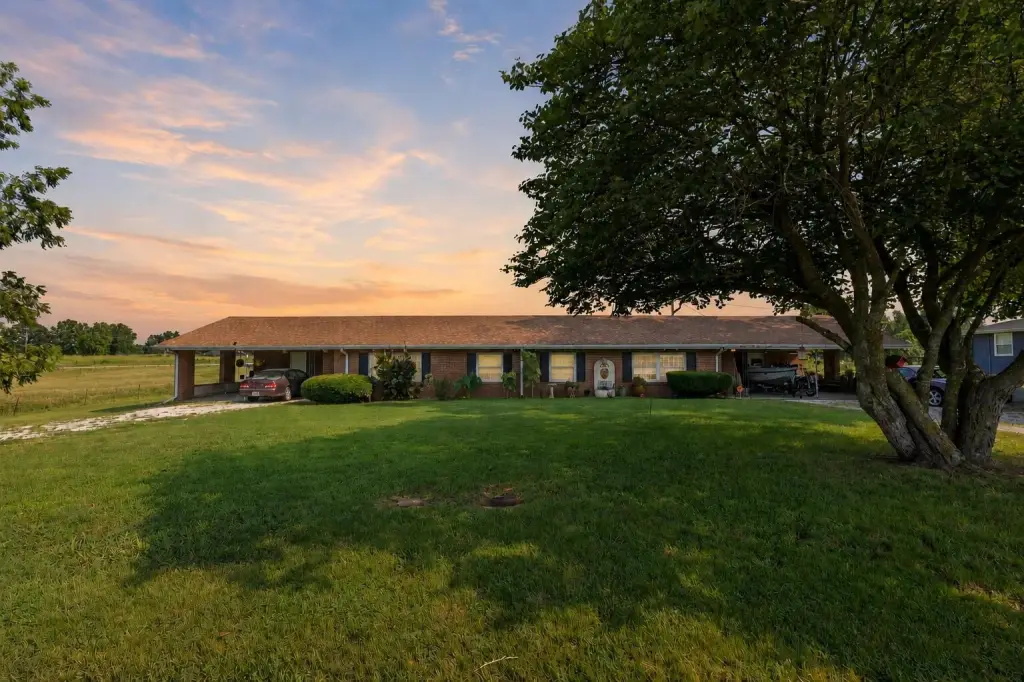
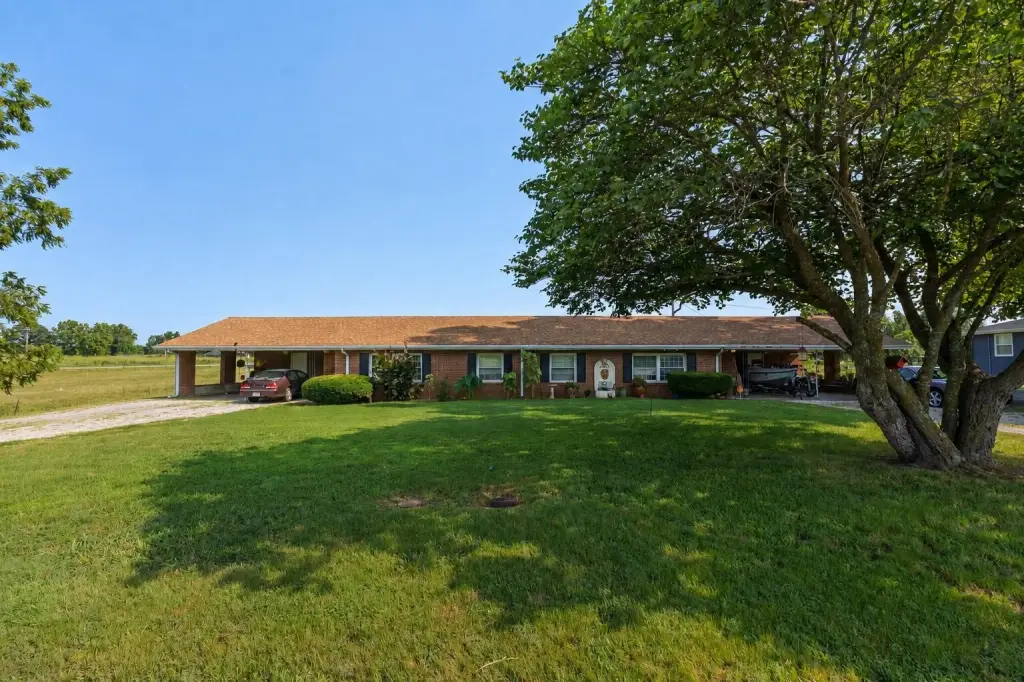
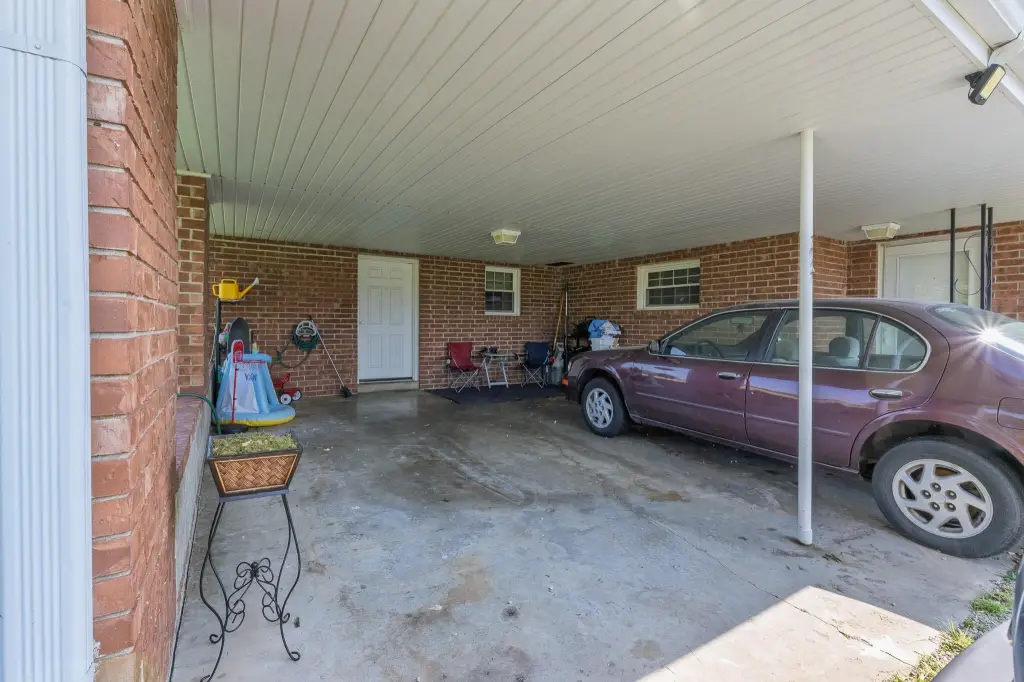
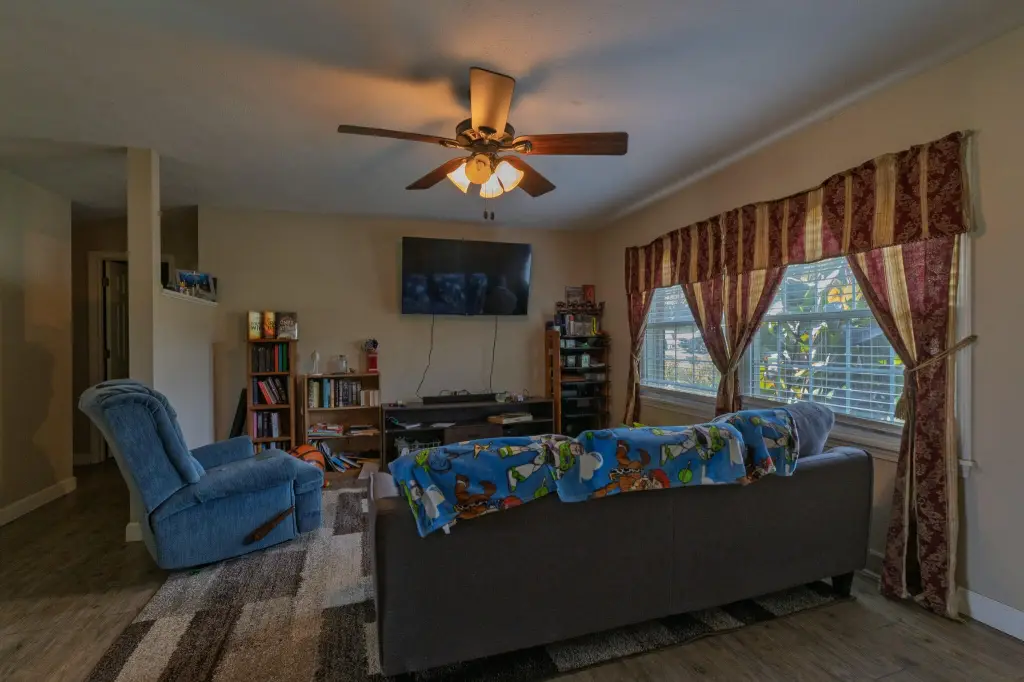
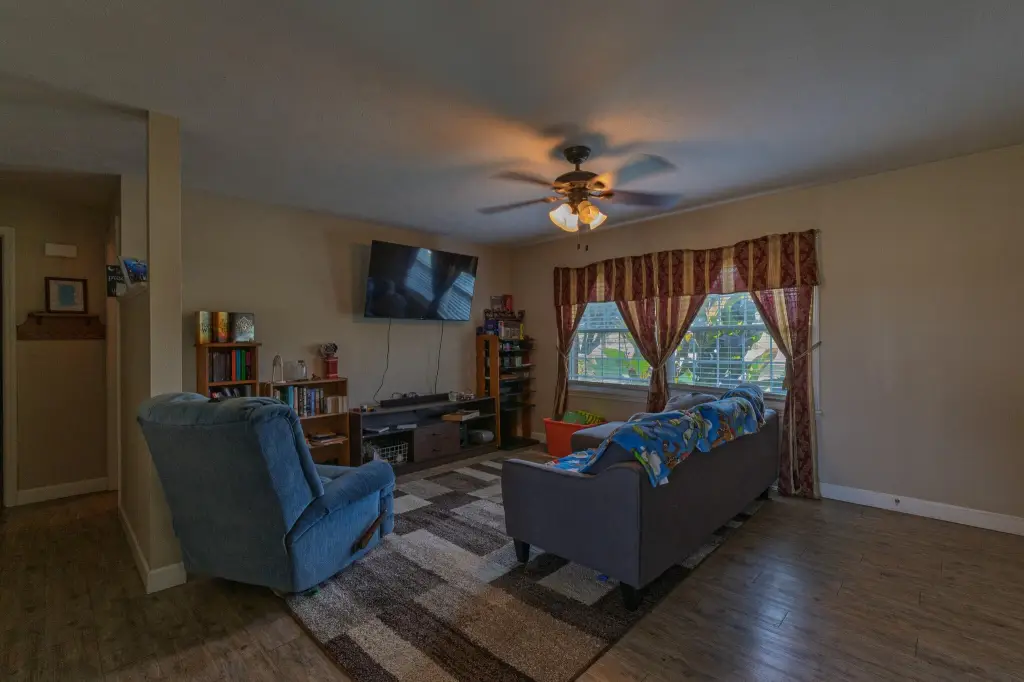
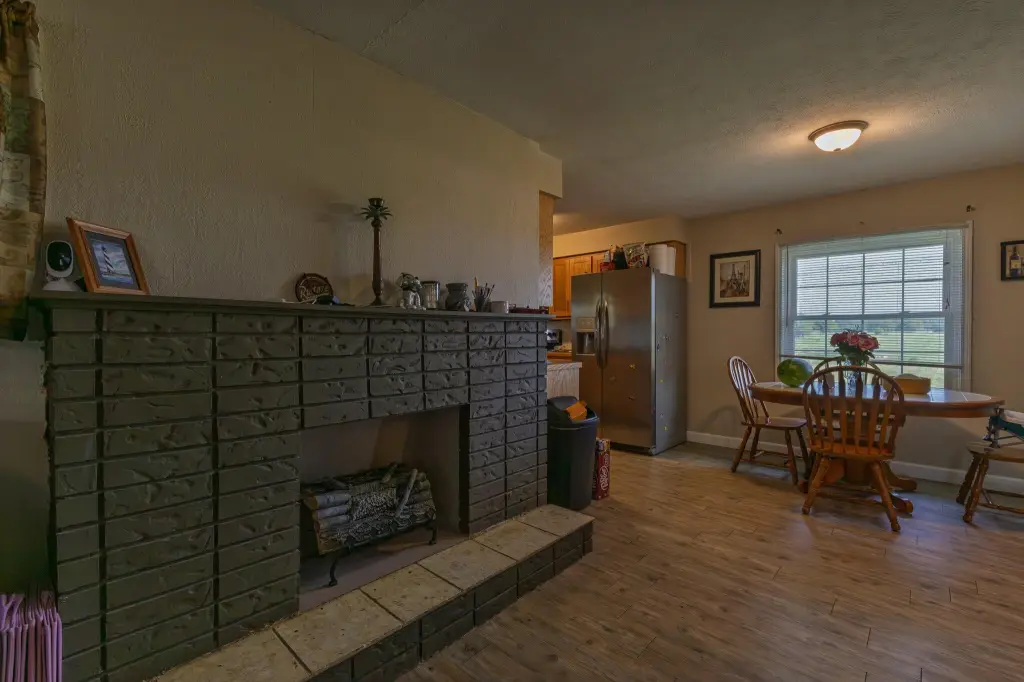
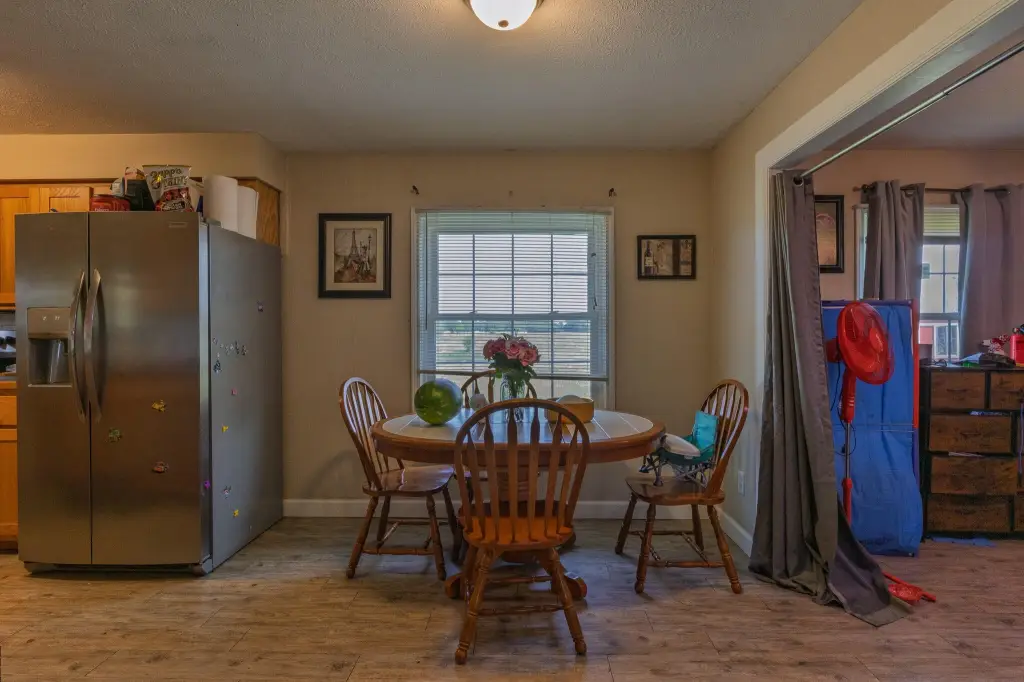
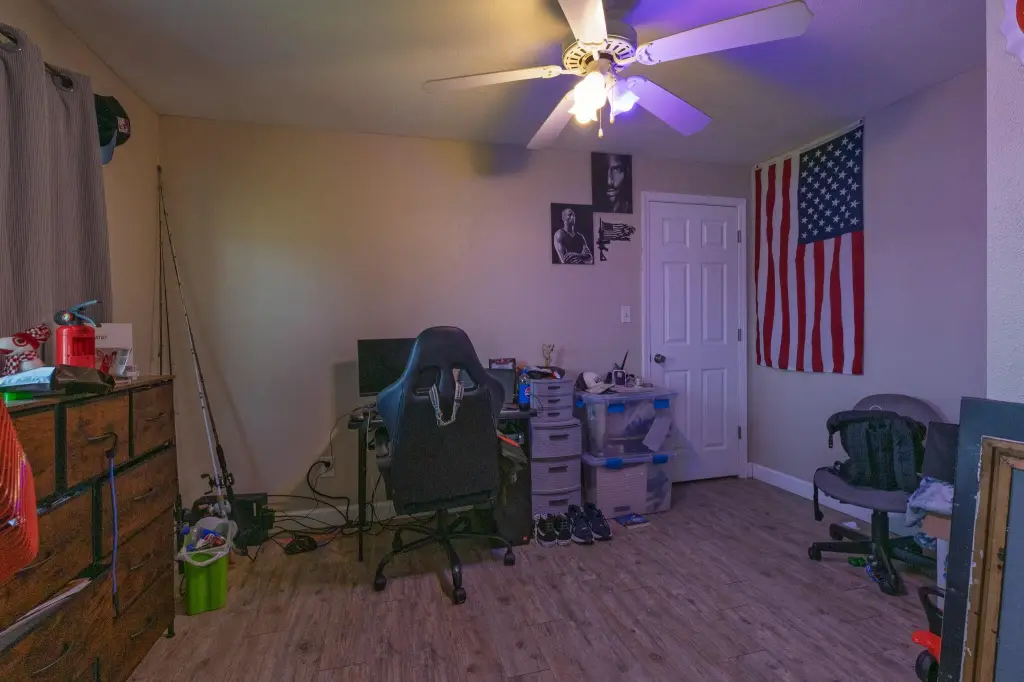
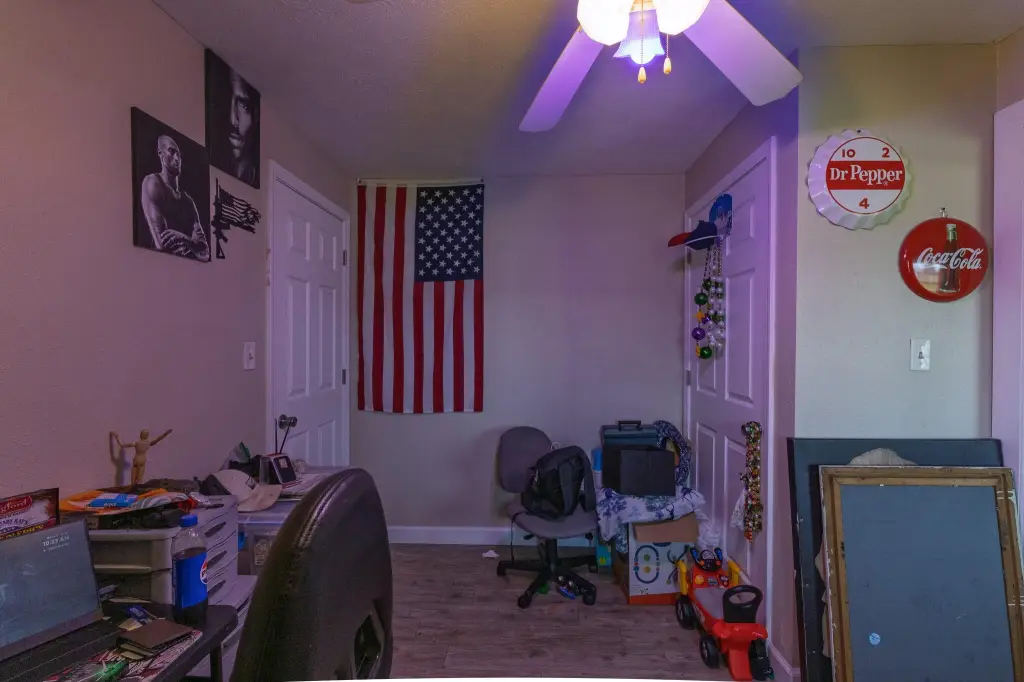
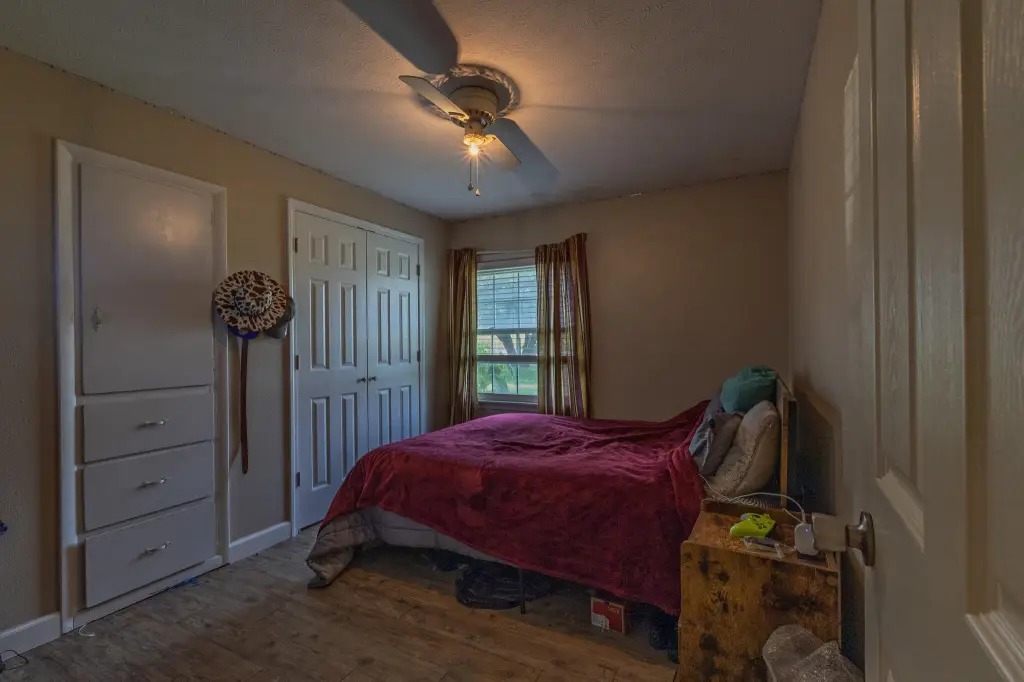
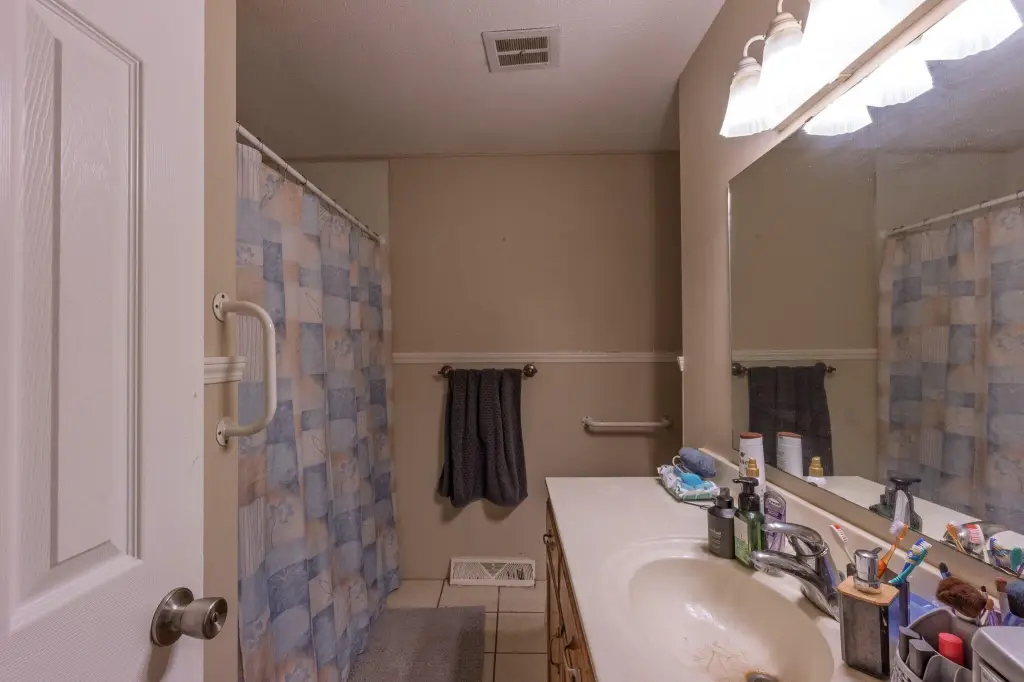
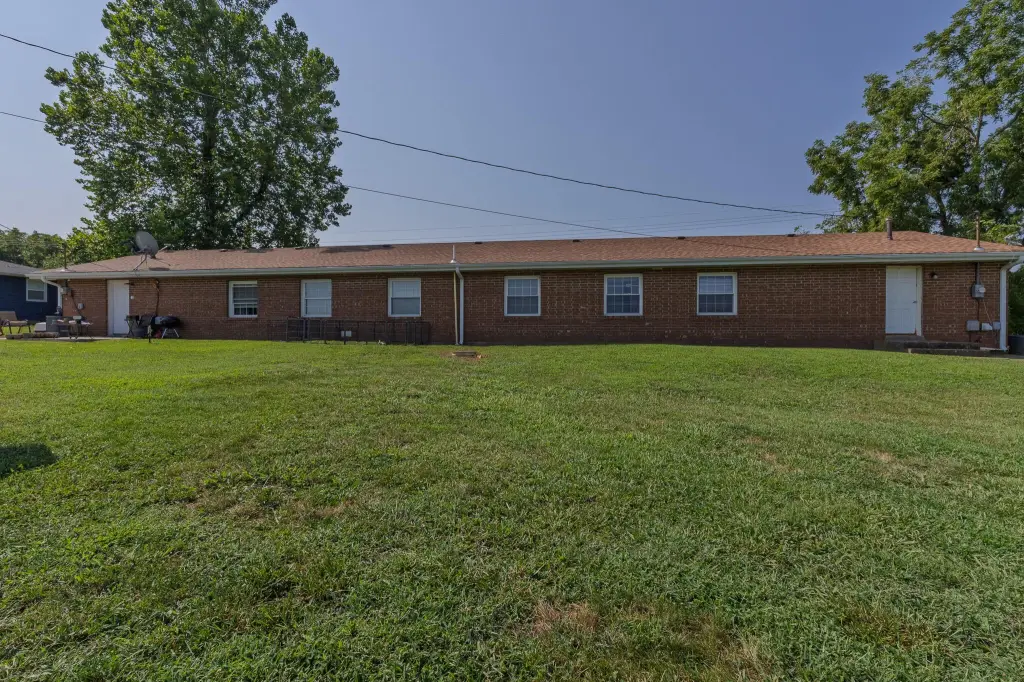
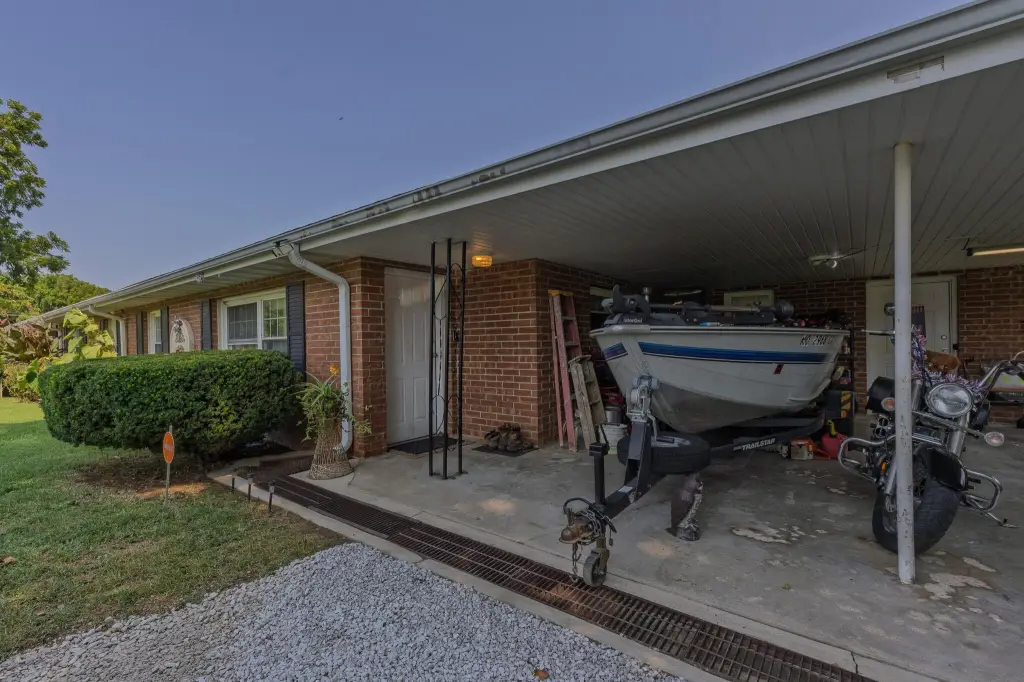
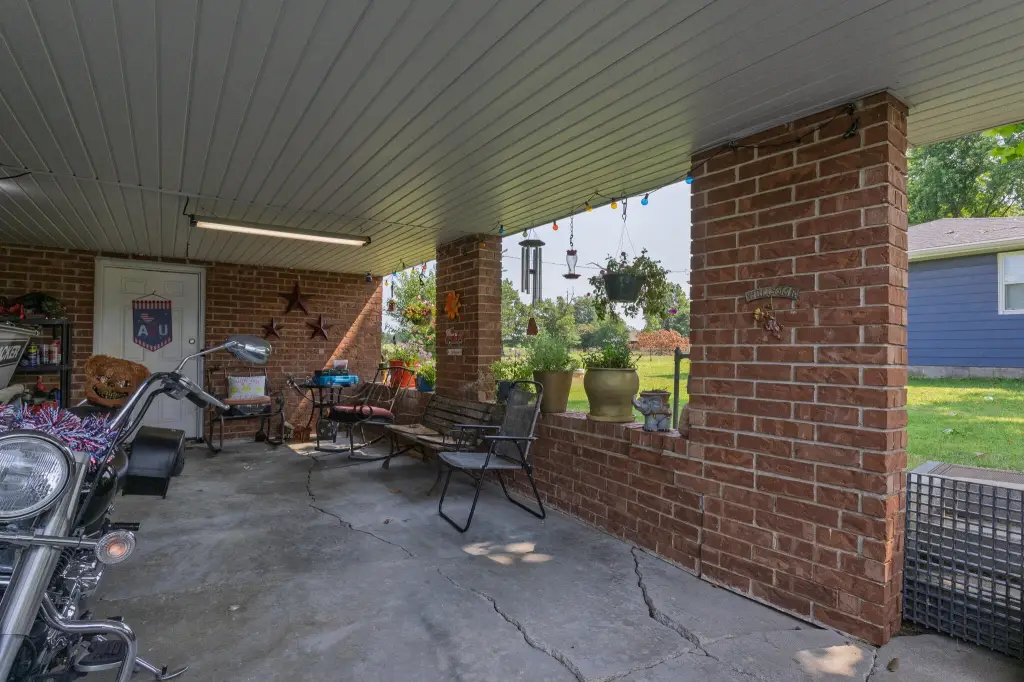
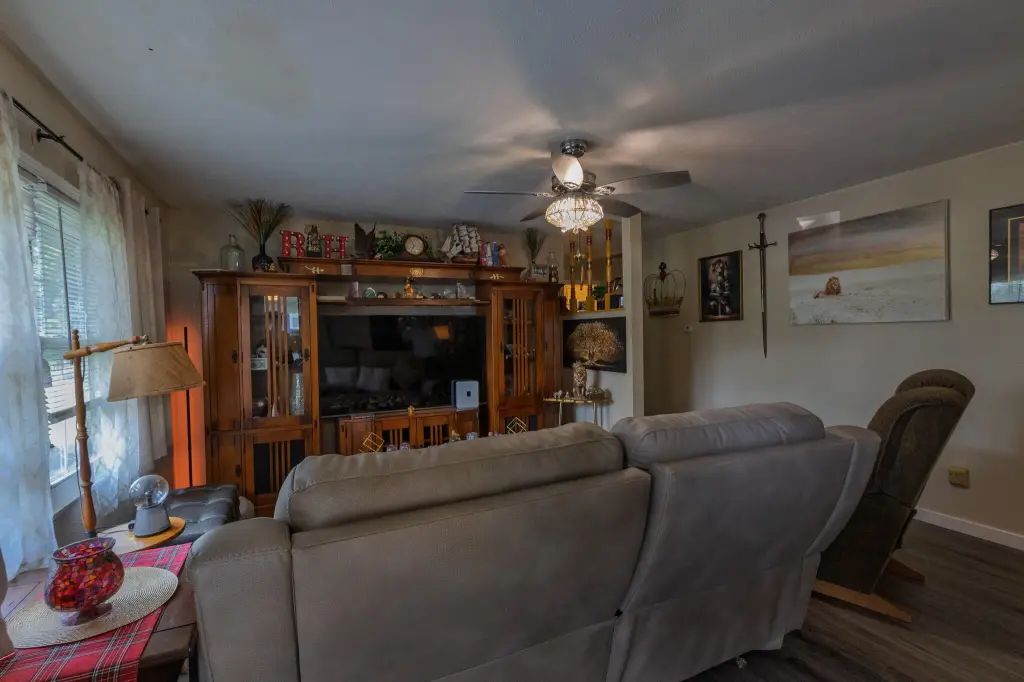
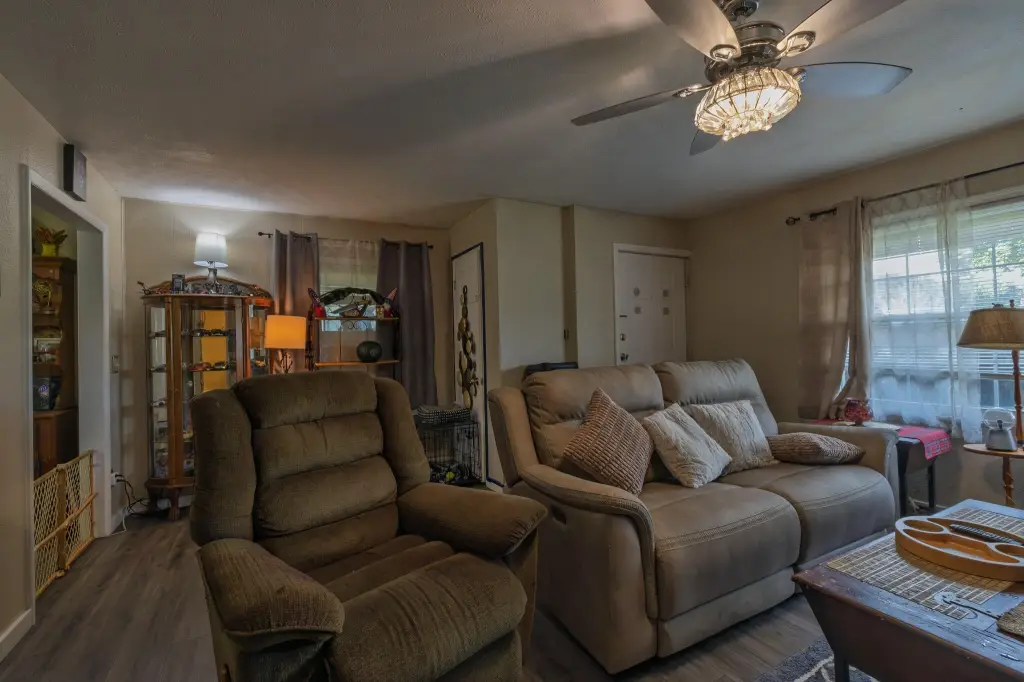
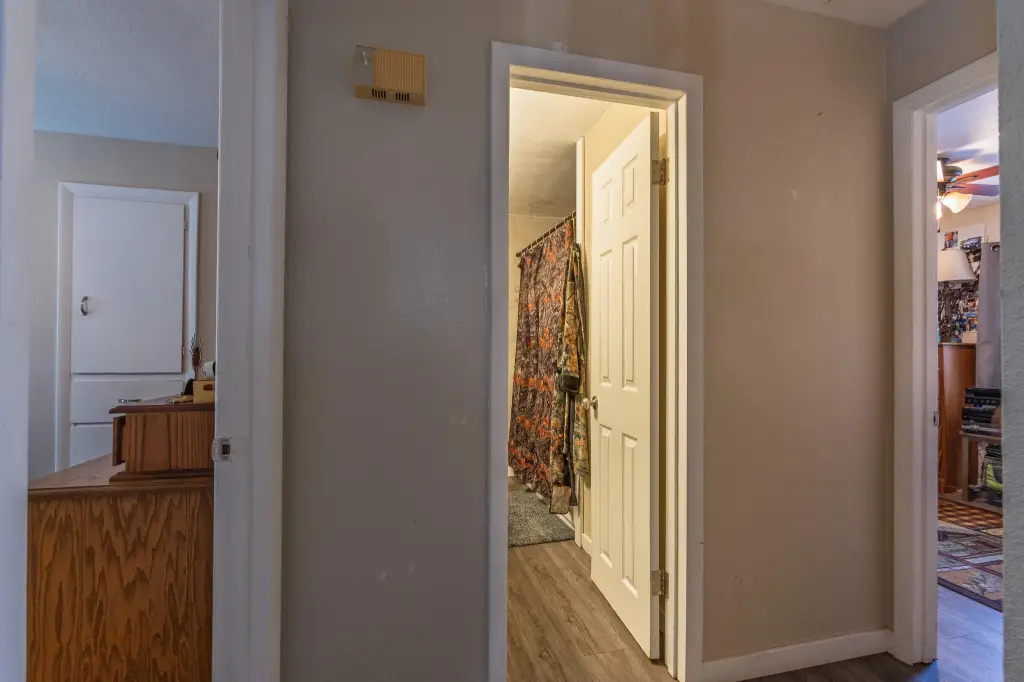
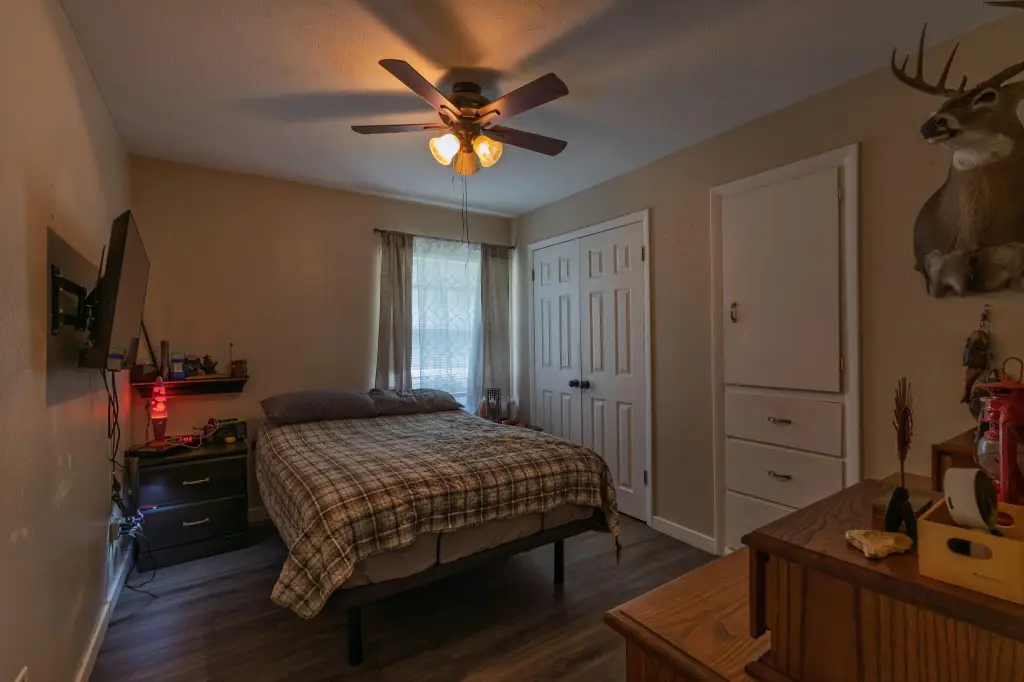
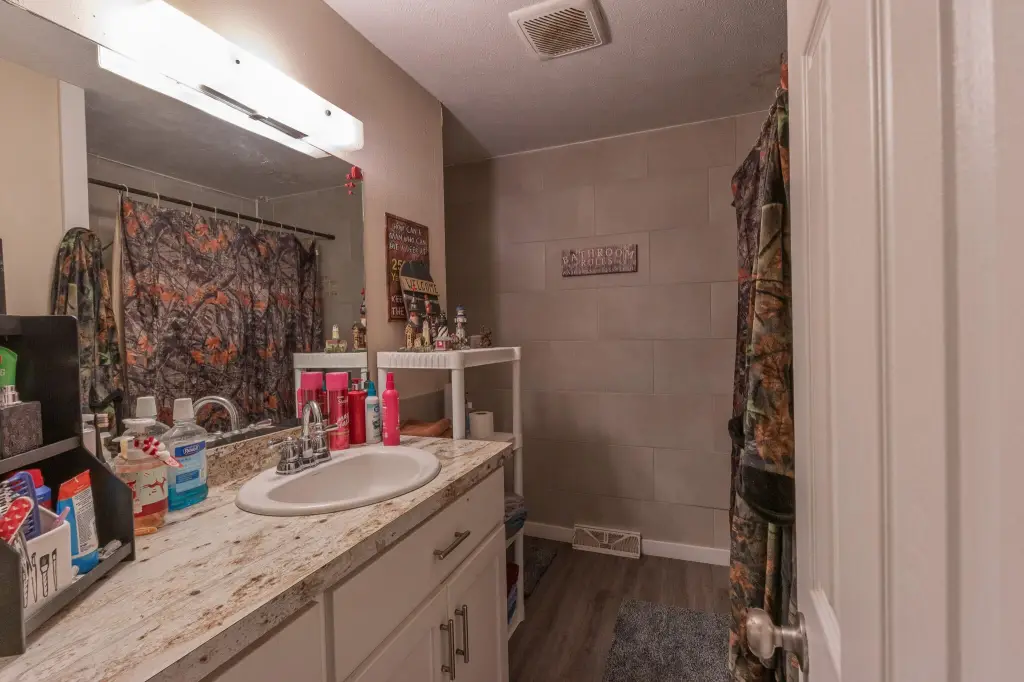
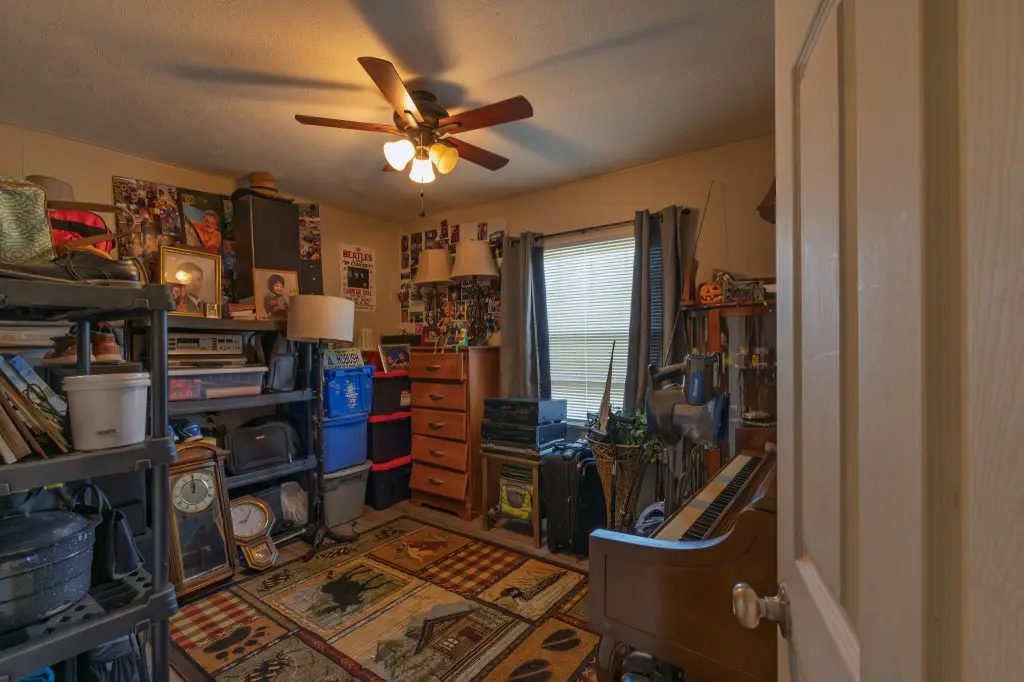
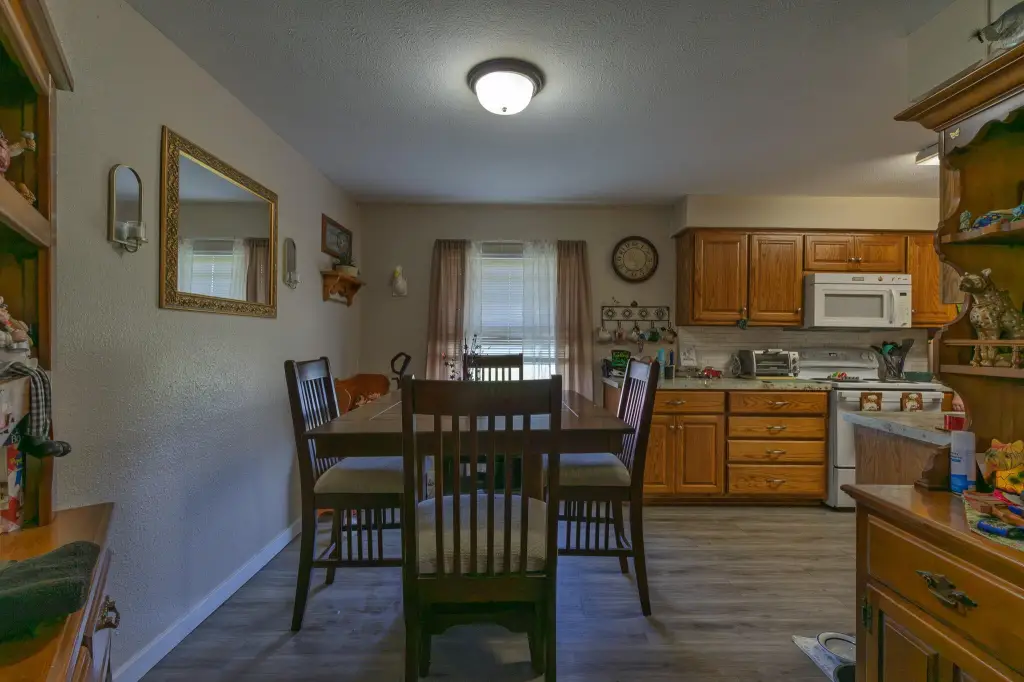
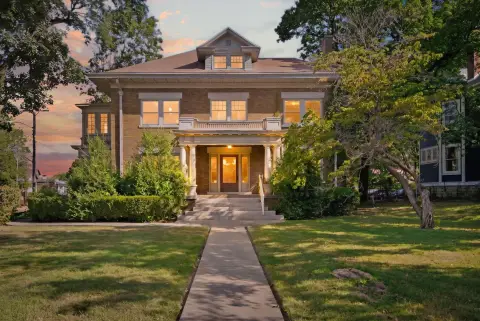
This all-brick duplex contains two residential units, with approximately 1,090 square feet of living space associated with each side. One unit has three bedrooms and one bathroom; the other includes two bedrooms, one bathroom, and an additional room suitable for an office or formal dining area. Both units feature full kitchens, dining areas, utility rooms, and two-car carports. Interior equipment includes ranges, dishwashers, refrigerators, and microwaves, while washer/dryer hookups are also provided.
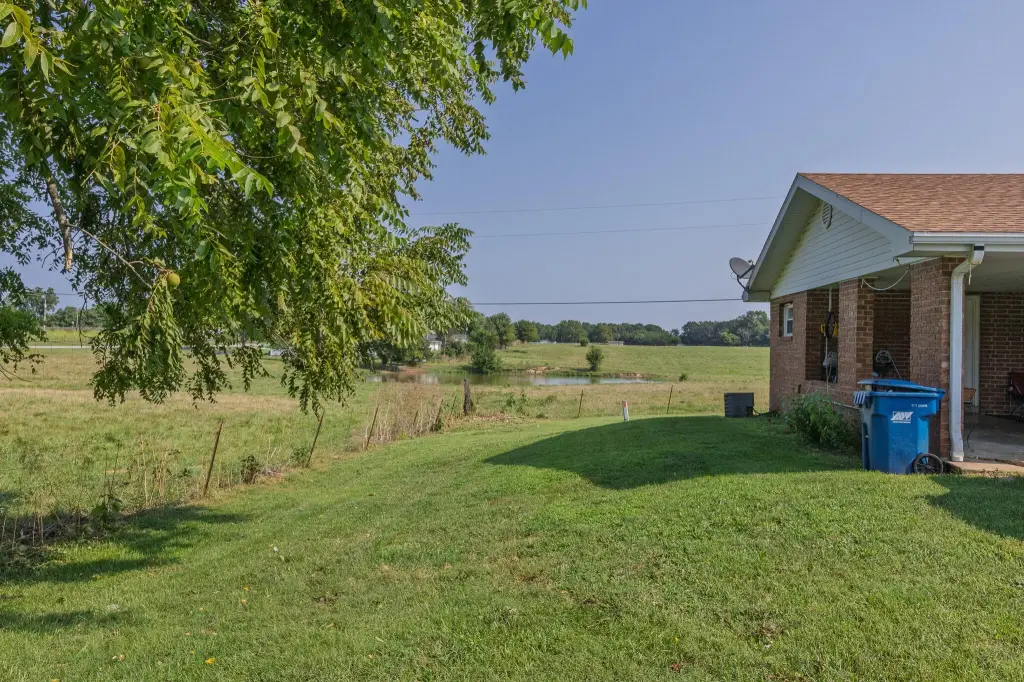
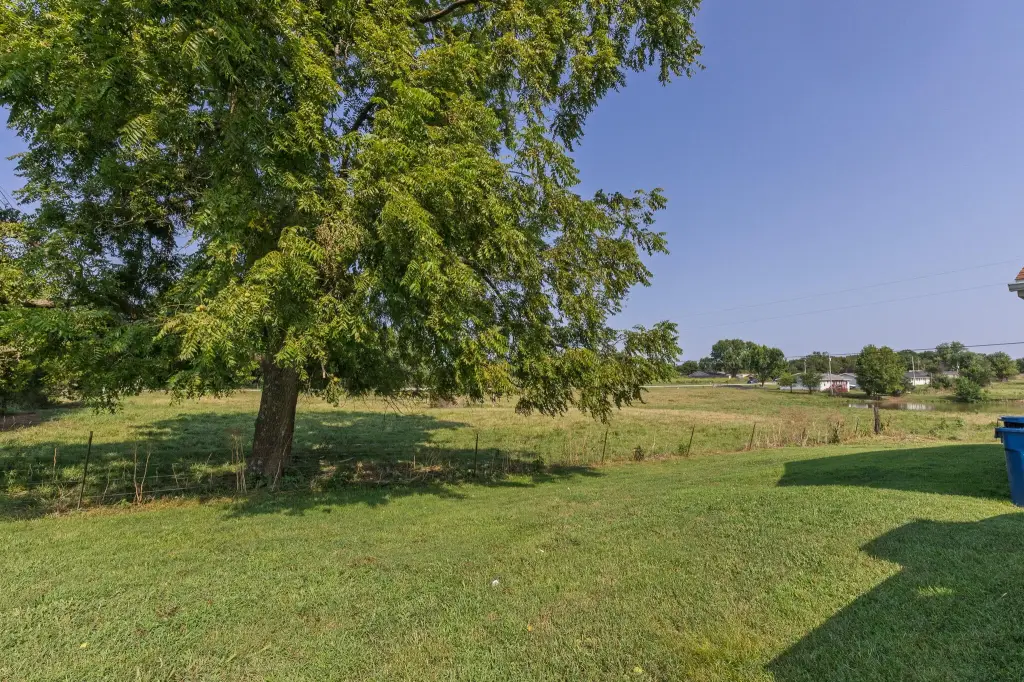
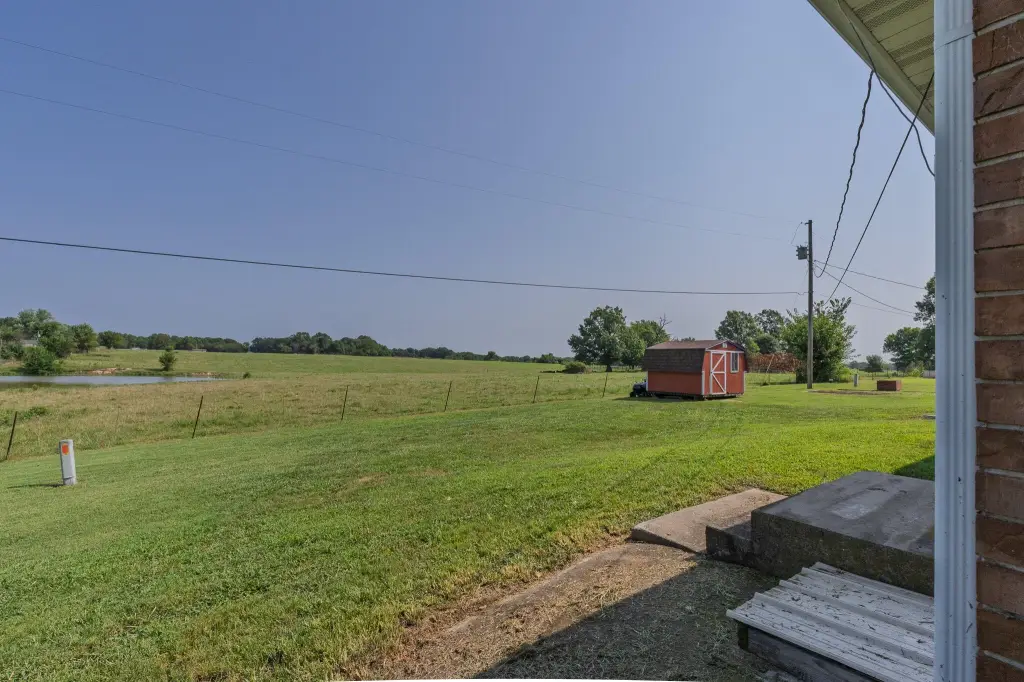
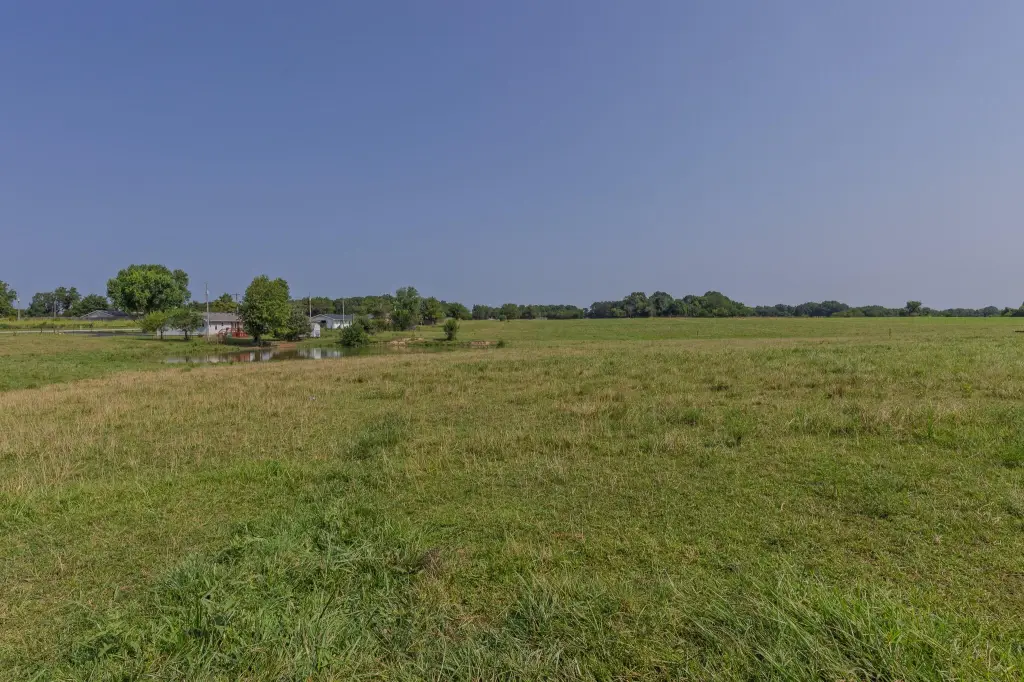
The property encompasses 4.09 acres at 7053 W Farm Road 106 in Springfield, Missouri. Outdoor features include a pond, and the site uses shared septic service with natural gas available. Central heating, central air, ceiling fans, and shingle roofing serve the building, which was constructed in 1967.
The property encompasses 4.09 acres at 7053 W Farm Road 106 in Springfield, Missouri. Outdoor features include a pond, and the site uses shared septic service with natural gas available. Central heating, central air, ceiling fans, and shingle roofing serve the building, which was constructed in 1967.
Key Highlights
- Two‑unit brick duplex with approximately 1,090 square feet of living space per side
- Unit mix includes 3 bedrooms and 1 bathroom plus 2 bedrooms, 1 bathroom, and an additional room
- 4.09‑acre property with a pond in a rural setting
Property Analytics
Unlock full access to Insights
Subscribe to Realmo Intelligence
Open Analytics
Current Use
Lease Details
2
Residential units
Location Intelligence
Trade Area within ½ mile
10
Businesses Nearby
Explore this area
Business Placement
Demographics for 65803, MO
42,007
Population
19,659
Households
2.1
Avg Household Size
38
Median Age
22%
College-Educated
91%
High-School Grad
93.4 sq mi
ZIP Area
450
Density / Sq Mi
$46,539
Median Household Income
$33,537
Median Earnings
$890
Median Rent
$158,200
Median Home Value
Check the figures for this property
Cap Rate, Value Estimation, Potential NOI and more
View Realmo Analytics
Market
Vacancy Rate% for Multifamily in Midwest region

Questions? Ask Rey
Realmo’s AI knows this listing — price, zoning, demand, history. Ask anything.



Frequently Asked Questions
What type of property is this?
Duplex - Two residential units provide separate kitchens, dining areas, utility rooms, and covered parking in a rural setting.
Where is this duplex located?
The property is located at 7053 W Farm Road 106 Springfield, MO.
What is the asking price?
The asking price for this property is $335,000.
What are key features of this property?
This property features: Two‑unit brick duplex with approximately 1,090 square feet of living space per side; Unit mix includes 3 bedrooms and 1 bathroom plus 2 bedrooms, 1 bathroom, and an additional room; 4.09‑acre property with a pond in a rural setting


