Freestanding Retail
For Sale
$2,350,000
7052 East Athol Crossing Road, Athol, ID 83801
Highway-oriented retail property with regional access and established surrounding commercial operators.
Property Size10,000 SF
Price / SF$235
Days on Market239
Property Features for 7052 East Athol Crossing Road
General Information
Standard status
Active
Size
10,000 SF
Property subtype
Free Standing Building
Additional Details
Highway Access
Yes
Building Details
Building Size
10,000 SF
Listing Agency:
TOK Commercial
Listed By:
John Stevens · License #SP26430
(208) 724-0064
Source:
Thebrokerlist
Added: Feb 18
Changed: Oct 8
Last Checked: Oct 14 at 7:42PM
Displayed information is deemed reliable but is not guaranteed and should be independently verified. All listing content including descriptions, pricing, images are the copyrighted material of TOK Commercial
Investment Insights
Based on property information with market context.
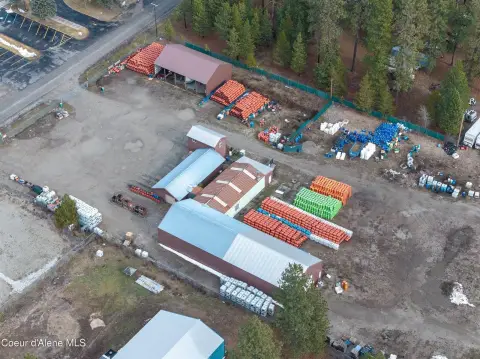
This 10,000 SF storefront property is positioned at 7052 East Athol Crossing Road in Athol, Idaho. The freestanding building sits just off U.S. Highway 95, providing direct highway access and exposure to local and regional traffic.
The surrounding commercial setting includes Ace Hardware, Super 1 Foods, Tractor Supply Co., Grease Monkey, P1FCU, Northwest Urgent Care, AutoZone, Sweet Lou’s Restaurant & Tap Room, 76 Station, Korean Cuisine & Teriyaki, and Idaho Gun & Outdoors. Coeur d’Alene is approximately 21 miles away, with access to the Spokane metropolitan area also noted.
The surrounding commercial setting includes Ace Hardware, Super 1 Foods, Tractor Supply Co., Grease Monkey, P1FCU, Northwest Urgent Care, AutoZone, Sweet Lou’s Restaurant & Tap Room, 76 Station, Korean Cuisine & Teriyaki, and Idaho Gun & Outdoors. Coeur d’Alene is approximately 21 miles away, with access to the Spokane metropolitan area also noted.
Key Highlights
- 10,000 SF freestanding retail building
- Located just off U.S. Highway 95 in Athol, Idaho
- Approximately 21 miles from Coeur d’Alene
Financial Insights
Estimated NOI and Cap Rate
NOI / Yr
$100,800
Cap Rate
4.29%
Suggested Prices Based on Cap Rates
Cap Rate 5%
$2,016,000
$2.0M
Cap Rate 7%
$1,440,000
$1.4M
Cap Rate 9%
$1,120,000
$1.1M
Market Conditions
NOI Build-Up for 10,000 SF
Gross rent
$150.0K $15.00/SF
− Vacancy
−$6.0K −$0.60/SF
EGI
$144.0K $14.40/SF
− OpEx
−$43.2K −$4.32/SF
NOI
$100.8K $10.08/SF
Area
Kootenai County, ID
Vacancy
4.00%
Lease Rate
$15.00 /SF/Yr
Expense Ratio
30.00%
Simulate Cap Rate and NOI
Suggested Prices Based on Cap Rates
Cap Rate 5%
$2,016,000
Cap Rate 7%
$1,440,000
Cap Rate 9%
$1,120,000
Alternative Uses
Best Use
Retail
$1.44M
$1.26M – $1.68M
NOI $100,800 @ 7.0% cap · market cap 4.29%
Second Best
—
—
no second resolved use
Theoretical Best
Office A
$2.17M
$1.90M – $2.53M
NOI $151,848 @ 7.0% cap · market cap 6.46%
Zoning and permitted uses should be independently verified with authorities.
How Realmo checks its estimates
Property Analytics
Current Use
Lease Details
Yes
Highway access
Location Intelligence
Trade Area within ½ mile
5
Businesses Nearby
Well-served
Demand for This Use
Explore this area
Business Placement
Demographics for 83801, ID
7,501
Population
2,738
Households
2.7
Avg Household Size
48
Median Age
23%
College-Educated
89%
High-School Grad
175.1 sq mi
ZIP Area
43
Density / Sq Mi
$68,719
Median Household Income
$40,245
Median Earnings
$1,238
Median Rent
$495,500
Median Home Value
Market
Vacancy Rate% for Retail in West region

Questions? Ask Rey
Realmo’s AI knows this listing — price, zoning, demand, history. Ask anything.


Frequently Asked Questions
What type of property is this?
Storefront property - Highway-oriented retail property with regional access and established surrounding commercial operators.
Where is this storefront property located?
The property is located at 7052 East Athol Crossing Road Athol, ID.
What is the asking price?
The asking price for this property is $2,350,000.
What are key features of this property?
This property features: 10,000 SF freestanding retail building; Located just off U.S. Highway 95 in Athol, Idaho; Approximately 21 miles from Coeur d’Alene


