11-Unit Apartment
For Sale
$2,250,000
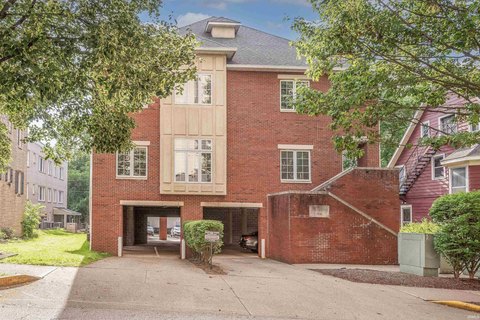
703 North Walnut Street, Bloomington, IN 47404
Near IU campus with rear parking and appliances plus washer and dryer in every unit.
Property Size10,344 SF
Price / SF$217.52
Days on Market345
Property Features for 703 North Walnut Street
General Information
Standard status
Active
Size
10,344 SF
Property subtype
Multi Family / Apartment Building
Lease Term
1 Year
Units
Unit Mix
8 x 2BR/2BA, 2 x 1BR/1BA, 1 x Studio/1BA
Multifamily Units
11
Taxes and HOA fees
Annual Taxes
$18,993
Amenities
Ceiling Fan, Energy Star A/C, High Efficiency Furnace
Central Air
3
No
Carpet, Concrete, Laminate, Wood
19
Electricity, Forced Air
11
Poured Concrete
2
8
Crawl
Yes
Asphalt
Masonite, Stone
Cable Ready, Countertops-Laminate, Water Heater Electric
Rubber
Sidewalks
Building Details
Year Built
2013
Units
11
Listing Agency:
Jason Millican Group
Listed By:
Jason Millican · License #RB14027891
(317) 372-9999
Source:
Compass
Added: Nov 8, 2025
Changed: Oct 15
Last Checked: Oct 16 at 10:52AM
Displayed information is deemed reliable but is not guaranteed and should be independently verified. All listing content including descriptions, pricing, images are the copyrighted material of Jason Millican Group

Ask AI about this property
Review the available facts, identify missing information and prepare questions for the agent.
Investment Insights
Based on property information with market context.
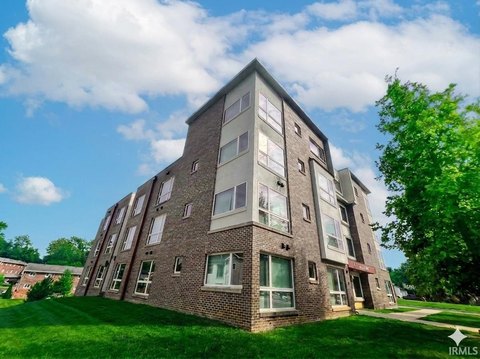
This 11-unit apartment complex was built in 2013 and offers a mix of eight two-bedroom, two-bath units, two one-bedroom, one-bath units, and one studio with one bath. Every residence includes appliances and a washer and dryer. Rear-lot parking serves the building, and the property includes central air, energy-efficient air conditioning, and high-efficiency furnaces.
The complex is near the IU campus, with walking access to downtown and the stadium. Tenants pay internet and electric expenses, while ownership covers water, sewer, trash, and maintenance. The property is located at 703 North Walnut Street in Bloomington, Indiana.
The complex is near the IU campus, with walking access to downtown and the stadium. Tenants pay internet and electric expenses, while ownership covers water, sewer, trash, and maintenance. The property is located at 703 North Walnut Street in Bloomington, Indiana.
Key Highlights
- 11‑unit apartment complex built in 2013
- Unit mix includes 8 2BR/2BA, 2 1BR/1BA, and 1 studio/1BA
- Every unit includes appliances and a washer and dryer
Financial Insights
Estimated NOI and Cap Rate
NOI / Yr
$84,426
Cap Rate
3.75%
Suggested Prices Based on Cap Rates
Cap Rate 5%
$1,688,520
$1.7M
Cap Rate 7%
$1,206,086
$1.2M
Cap Rate 9%
$938,067
$938.1K
Market Conditions
NOI Build-Up for 10,344 SF
Gross rent
$162.6K $15.72/SF
− Vacancy
−$9.1K −$0.88/SF
EGI
$153.5K $14.84/SF
− OpEx
−$69.1K −$6.68/SF
NOI
$84.4K $8.16/SF
Area
Monroe County, IN
Vacancy
5.60%
Lease Rate
$15.72 /SF/Yr
Expense Ratio
45.00%
Simulate Cap Rate and NOI
Suggested Prices Based on Cap Rates
Cap Rate 5%
$1,688,520
Cap Rate 7%
$1,206,086
Cap Rate 9%
$938,067
Alternative Uses
Best Use
Apartment 5plus
$1.21M
$1.06M – $1.41M
NOI $84,426 @ 7.0% cap · market cap 3.75%
Second Best
—
—
no second resolved use
Theoretical Best
Office A
$2.02M
$1.77M – $2.36M
NOI $141,512 @ 7.0% cap · market cap 6.29%
Zoning and permitted uses should be independently verified with authorities.
How Realmo checks its estimates
Property Analytics
Current Use
Lease Details
11
Residential units
Location Intelligence
Trade Area within ½ mile
348
Businesses Nearby
Explore this area
Business Placement
Demographics for 47404, IN
23,799
Population
12,101
Households
2
Avg Household Size
33
Median Age
43%
College-Educated
95%
High-School Grad
52.6 sq mi
ZIP Area
452
Density / Sq Mi
$54,674
Median Household Income
$36,725
Median Earnings
$1,159
Median Rent
$243,500
Median Home Value
Market
Vacancy Rate% for Multifamily in Midwest region





Frequently Asked Questions
What type of property is this?
Apartment building - Near IU campus with rear parking and appliances plus washer and dryer in every unit.
Where is this apartment building located?
The property is located at 703 North Walnut Street Bloomington, IN.
What is the asking price?
The asking price for this property is $2,250,000.
What are key features of this property?
This property features: 11‑unit apartment complex built in 2013; Unit mix includes 8 2BR/2BA, 2 1BR/1BA, and 1 studio/1BA; Every unit includes appliances and a washer and dryer