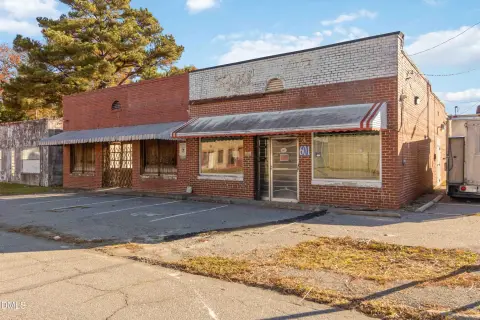
Convenience Store with Attached
For Sale
$200,000
702 Branch Street, Rocky Mount, NC 27801
Commercial Sale, Rocky Mount, NC
Property Size1,495 SF
Lot Size0.25 Acres
Price / SF$133.78
Days on Market390
Property Features for 702 Branch Street
General Information
Property type
Commercial Sale
Property subtype
Other
Zoning
B1
Parking
5
Subdivision
Not In Subdivision
Lot features
Corner Lot
Directions
From benvenue rd head South east toward downtown Use any lane to turn right onto N Franklin street . Turn left onto W raleigh blvd and then slight right onto edgecombe st then turn right onto branch street.
Standard status
Active
APN
3759-763889-00
Size
1,495 SF
Lot size
0.25 Acres
Taxes and HOA fees
Tax Year
2025
Tax Description
LOT 18 BLK I, NC LAND AND IMPROVEMENT CO S/D
Tax Annual Amount
1557
Legal Description
LOT 18 BLK I, NC LAND AND IMPROVEMENT CO S/D
Utilities
Utilities
Phone Available
Heating system
Wall Furnace, Electric (Heating)
Cooling system
Central Air
Building Details
Year built
1970
Number of units
4
Flooring type
Vinyl
Building materials
Brick, Vinyl Siding, Wood Frame
Roof type
Metal, Shingle
Listing Agency:
Boone, Hill, Allen & Ricks
Listed By:
Muhammad Omer · License #258813
(252) 443-4148
Added: Sep 15, 2025
Changed: Sep 12
Last Checked: Oct 9 at 7:06AM
MLS# 100530964
Copyright © 2026 Hive MLS. All rights reserved. All information provided by the listing agent/broker is deemed reliable but is not guaranteed and should be independently verified.
Investment Insights
Based on property information with market context.
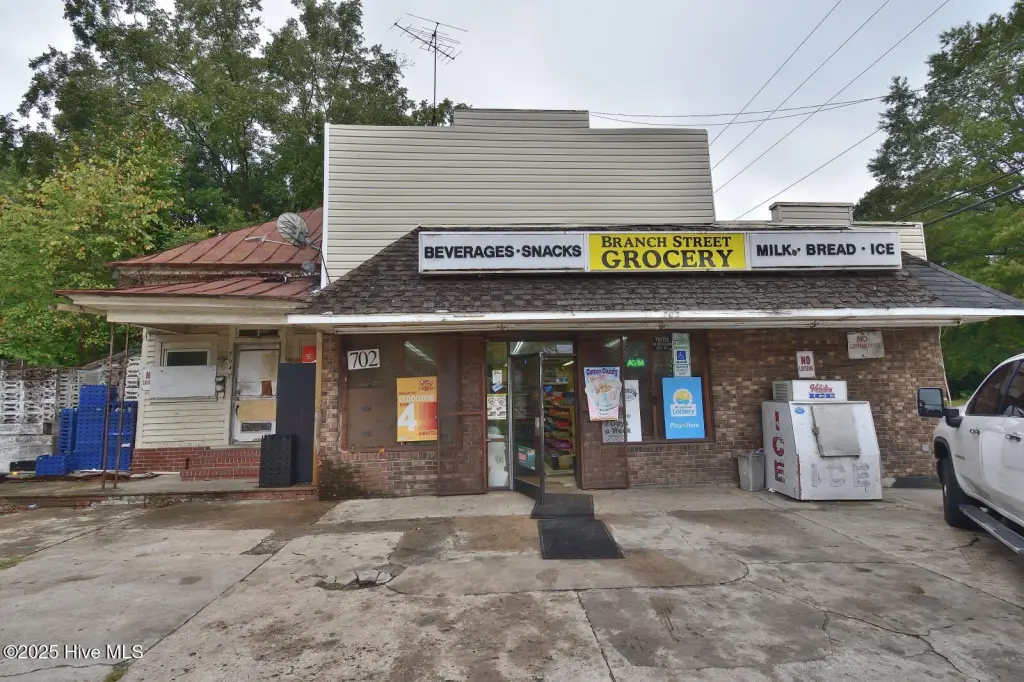
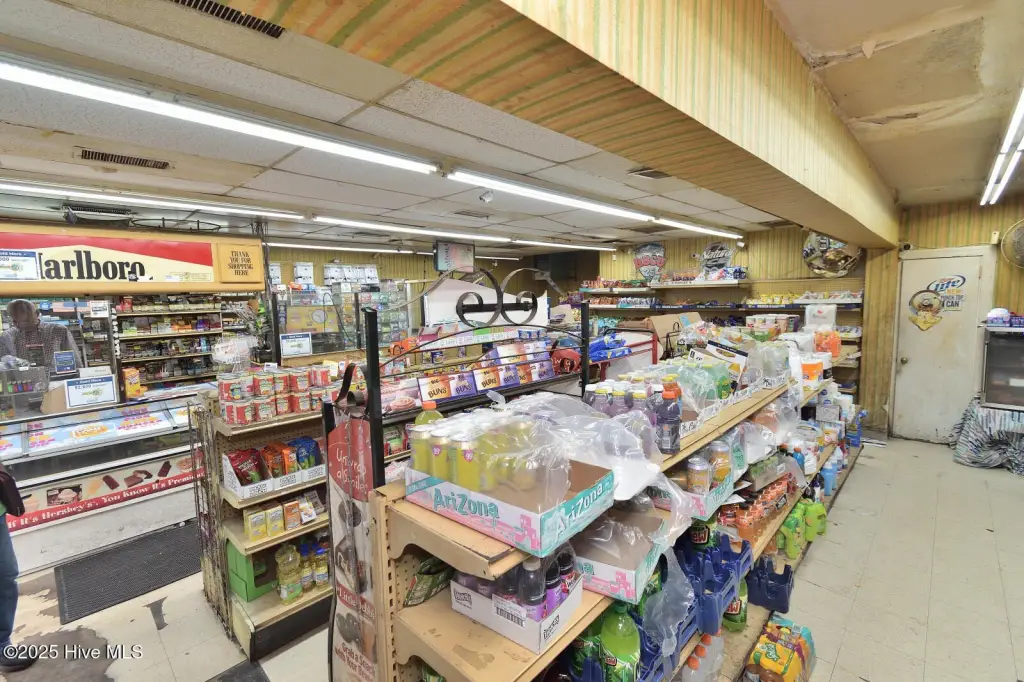
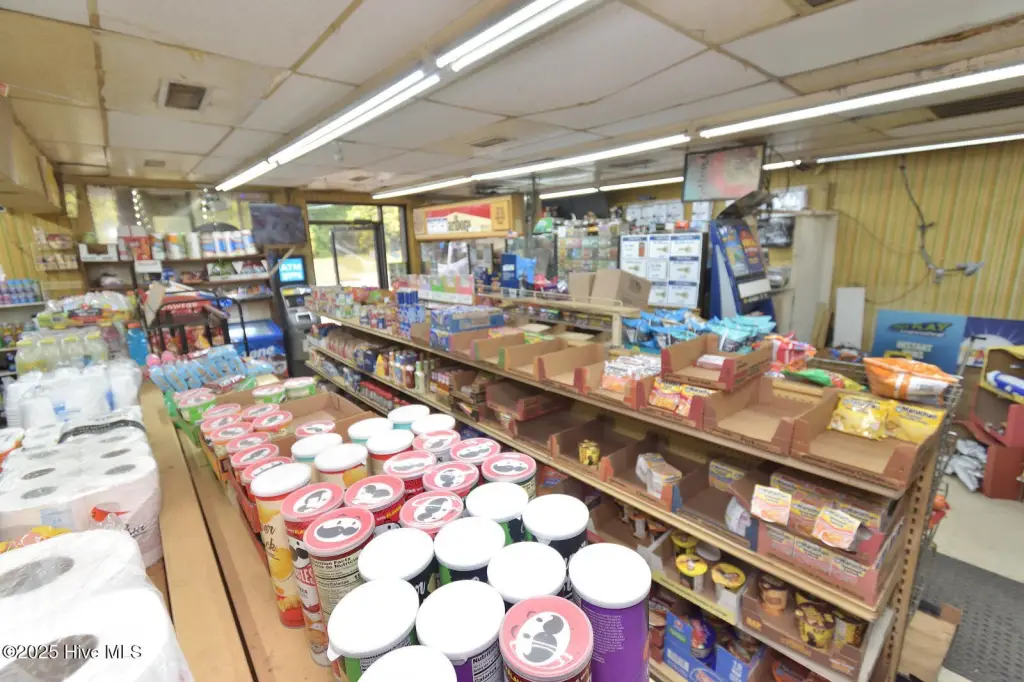
This B1-zoned property combines a convenience store with an attached two-bedroom, one-bath residence, creating a commercial and residential configuration in one building. The store and residence together contain approximately 1,495 square feet, with vinyl flooring, central air conditioning, and electric wall-furnace heating. Construction includes brick, vinyl siding, and wood-frame components, while the roof incorporates shingle and metal sections.
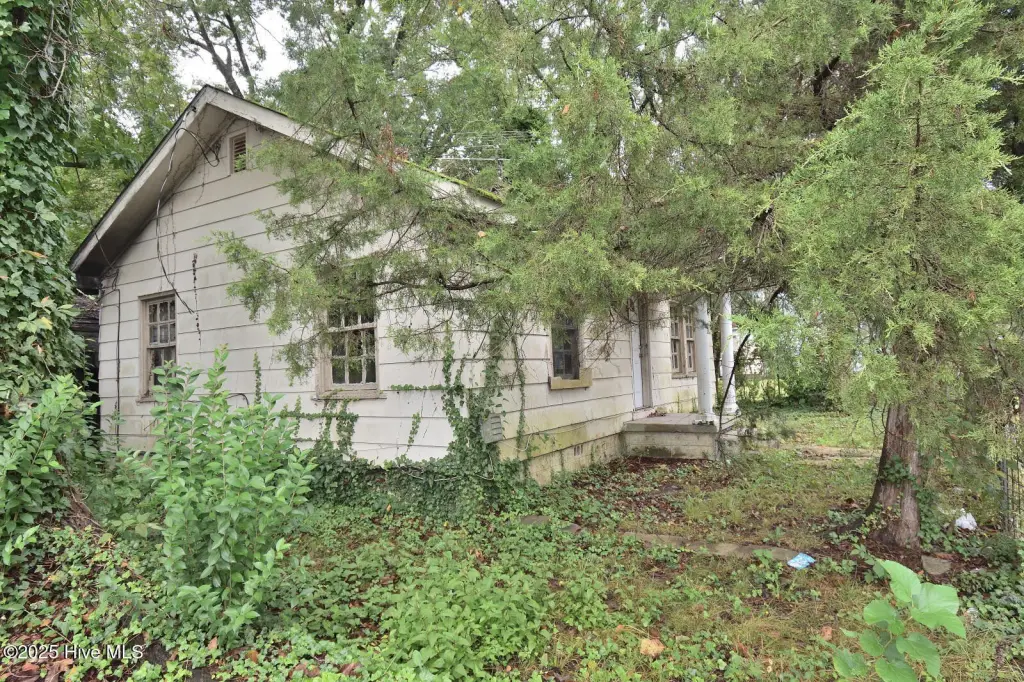
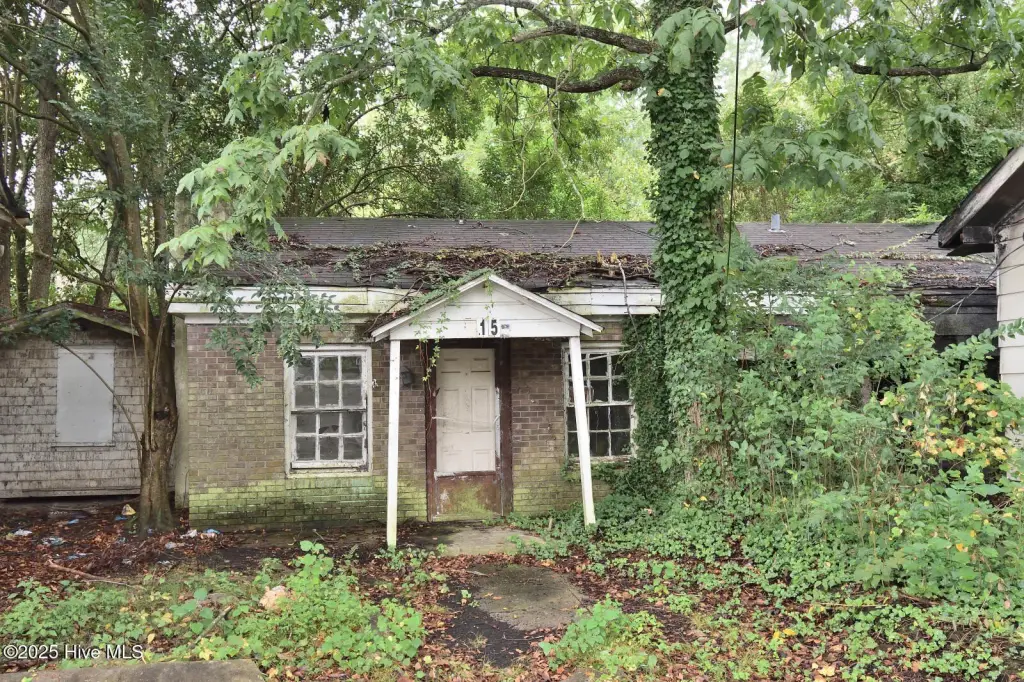
The parcel encompasses 0.25 acres at 702 Branch Street in Rocky Mount, North Carolina. Two additional houses are positioned behind the store and require complete rehabilitation. The property was built in 1970 and includes phone service availability. Its layout supports on-site living alongside the convenience-store operation, subject to applicable approvals and the condition of each structure.
The parcel encompasses 0.25 acres at 702 Branch Street in Rocky Mount, North Carolina. Two additional houses are positioned behind the store and require complete rehabilitation. The property was built in 1970 and includes phone service availability. Its layout supports on-site living alongside the convenience-store operation, subject to applicable approvals and the condition of each structure.
Key Highlights
- Convenience store with attached 2‑bedroom, 1‑bath residence
- Two rear houses included; both require complete rehabilitation
- 1,495 square feet on a 0.25‑acre parcel
Property Analytics
Unlock full access to Insights
Subscribe to Realmo Intelligence
Open Analytics
Current Use
Lease Details
3
Residential units
Turnkey business
Opportunity
Location Intelligence
Trade Area within ½ mile
501
Businesses Nearby
Balanced
Demand for This Use
Explore this area
Business Placement
Demographics for 27801, NC
19,043
Population
9,162
Households
2.1
Avg Household Size
41
Median Age
15%
College-Educated
83%
High-School Grad
66.8 sq mi
ZIP Area
285
Density / Sq Mi
$41,696
Median Household Income
$32,390
Median Earnings
$850
Median Rent
$108,600
Median Home Value
Check the figures for this property
Cap Rate, Value Estimation, Potential NOI and more
View Realmo Analytics
Market
Vacancy Rate% for Office in South region

Questions? Ask Rey
Realmo’s AI knows this listing — price, zoning, demand, history. Ask anything.






Similar Off Market Nearby
- Family Supermarket — 540 Cokey Rd, Rocky Mount, NC 27801
- Karims Super Market — 111 Atlantic Ave, Rocky Mount, NC 27801
Frequently Asked Questions
What type of property is this?
Grocery and convenience store - B1-zoned commercial property combines a convenience store with an attached two-bedroom residence and additional rear structures.
Where is this grocery and convenience store located?
The property is located at 702 Branch Street Rocky Mount, NC.
What is the asking price?
The asking price for this property is $200,000.
What are key features of this property?
This property features: Convenience store with attached 2‑bedroom, 1‑bath residence; Two rear houses included; both require complete rehabilitation; 1,495 square feet on a 0.25‑acre parcel


