First-Floor Office Suite with
For Sale
$450,000
7002 Little River Turnpike 1d, Annandale, VA 22003
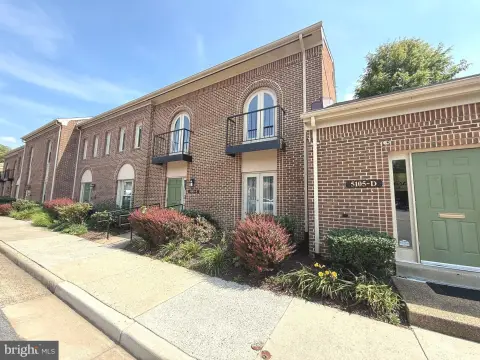
First-floor office suite with private offices, reception area, and kitchenette, with parking directly in front.
Property Size1,200 SF
Price / SF$375
Days on Market94
Property Features for 7002 Little River Turnpike 1d
General Information
Standard status
Active
Size
1,200 SF
Building Details
Year Built
1988
Listing Agency:
Ko-Am Realty & Investment, Inc.
Listed By:
Augustine M. Kim · License #0225054442
(703) 323-8913
Source:
Kandorre
Added: Jul 21
Changed: Oct 11
Last Checked: Oct 7 at 3:07PM
Displayed information is deemed reliable but is not guaranteed and should be independently verified. All listing content including descriptions, pricing, images are the copyrighted material of Ko-Am Realty & Investment, Inc.

Ask AI about this property
Review the available facts, identify missing information and prepare questions for the agent.
Investment Insights
Based on property information with market context.
This well-maintained first-floor office suite is laid out for efficient day-to-day use, with several private offices plus a welcoming reception area. A kitchenette is also included, supporting a functional work environment for a variety of professional needs.
The suite is located directly on Little River Turnpike and offers visibility and convenient access. Parking is positioned right in front of the unit, supporting easy arrivals for staff and visitors.
The space presents a clean, professional environment and is described as ready for immediate occupancy.
The suite is located directly on Little River Turnpike and offers visibility and convenient access. Parking is positioned right in front of the unit, supporting easy arrivals for staff and visitors.
The space presents a clean, professional environment and is described as ready for immediate occupancy.
Key Highlights
- First‑floor office suite in a building built in 1988
- Includes several private offices plus a reception area
- Kitchenette included in the suite
Financial Insights
Estimated NOI and Cap Rate
NOI / Yr
$22,716
Cap Rate
5.05%
Suggested Prices Based on Cap Rates
Cap Rate 5%
$454,320
$454.3K
Cap Rate 7%
$324,514
$324.5K
Cap Rate 9%
$252,400
$252.4K
Market Conditions
NOI Build-Up for 1,200 SF
Gross rent
$35.4K $29.52/SF
− Vacancy
−$5.1K −$4.28/SF
EGI
$30.3K $25.24/SF
− OpEx
−$7.6K −$6.31/SF
NOI
$22.7K $18.93/SF
Area
Fairfax County, VA
Vacancy
14.50%
Lease Rate
$29.52 /SF/Yr
Expense Ratio
25.00%
Simulate Cap Rate and NOI
Suggested Prices Based on Cap Rates
Cap Rate 5%
$454,320
Cap Rate 7%
$324,514
Cap Rate 9%
$252,400
Alternative Uses
Best Use
Office B
$324.5K
$284.0K – $378.6K
NOI $22,716 @ 7.0% cap · market cap 5.05%
Second Best
—
—
no second resolved use
Theoretical Best
Specialty Retail
$5.03M
$4.40M – $5.87M
NOI $352,107 @ 7.0% cap · market cap 78.25%
Zoning and permitted uses should be independently verified with authorities.
How Realmo checks its estimates
Property Analytics
Who owns this building?
See the owner, sales and loan history
Open Analytics
Current Use
Location Intelligence
Trade Area within ½ mile
1,639
Businesses Nearby
Explore this area
Business Placement
Demographics for 22003, VA
59,372
Population
19,497
Households
3
Avg Household Size
39
Median Age
51%
College-Educated
87%
High-School Grad
12.6 sq mi
ZIP Area
4,712
Density / Sq Mi
$134,109
Median Household Income
$54,906
Median Earnings
$1,988
Median Rent
$694,300
Median Home Value
Check the figures for this property
Cap Rate, Value Estimation, Potential NOI and more
View Realmo Analytics
Market
Vacancy Rate% for Office in South region



Frequently Asked Questions
What type of property is this?
Office unit - First-floor office suite with private offices, reception area, and kitchenette, with parking directly in front.
Where is this office unit located?
The property is located at 7002 Little River Turnpike 1d Annandale, VA.
What is the asking price?
The asking price for this property is $450,000.
What are key features of this property?
This property features: First‑floor office suite in a building built in 1988; Includes several private offices plus a reception area; Kitchenette included in the suite


