Residential Income
For Sale
$380,000
70 Adeline, New Haven, CT 06519
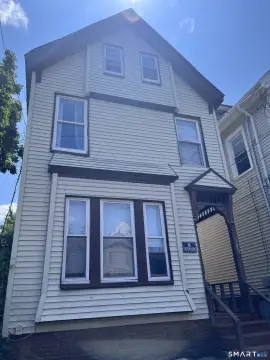
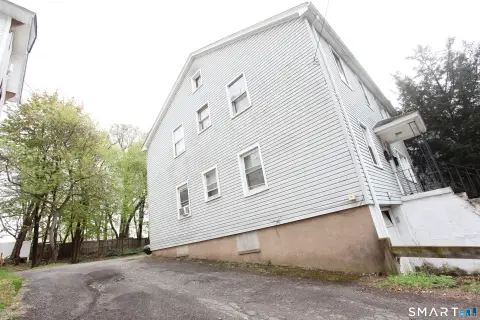
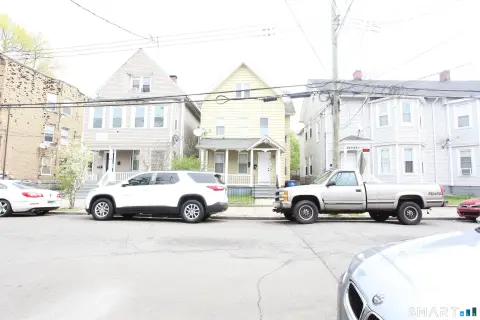
Multi-level residential property with separate-floor units, walk-out basement access, and on-street parking.
Property Size1,900 SF
Price / SF$219.15
Days on Market71
Property Features for 70 Adeline
General Information
Standard status
Active
Size
1,900 SF
Property subtype
2 Family
Lease Term
Listing ID: 24197150, Standard Status: Active, MLS Status: Active, Property Subtype: 2 Family, 53 days on market
Additional Details
Highway Access
Yes
Building Details
Building Size
1,900 SF
Year Built
1900
Listing Agency:
Century 21 Scala Group
(203) 374-9451
Listed By:
Galina Razorjonova · License #RES.0824575
(203) 278-3485
Source:
Iverty
Added: Aug 5
Changed: Oct 13
Last Checked: Oct 12 at 8:13PM
Displayed information is deemed reliable but is not guaranteed and should be independently verified. All listing content including descriptions, pricing, images are the copyrighted material of Century 21 Scala Group
Investment Insights
Based on property information with market context.
This residential income property dates to 1900 and includes units arranged on different floors. Interior features include window-unit cooling, electric and natural-gas service, hot-water heating, and both electric and gas water heaters. The basement offers full walk-out access and remains unfinished.
The property is located at 70 Adeline Street in New Haven, Connecticut, within RM2 zoning. On-street parking is available, and the address is reached from Ella T. Grasso Boulevard via local streets.
The property is located at 70 Adeline Street in New Haven, Connecticut, within RM2 zoning. On-street parking is available, and the address is reached from Ella T. Grasso Boulevard via local streets.
Key Highlights
- RM2‑zoned residential income property at 70 Adeline Street, New Haven
- Units arranged on different floors
- Full unfinished basement with walk‑out access
Financial Insights
Estimated NOI and Cap Rate
NOI / Yr
$27,159
Cap Rate
7.15%
Suggested Prices Based on Cap Rates
Cap Rate 5%
$543,180
$543.2K
Cap Rate 7%
$387,986
$388.0K
Cap Rate 9%
$301,767
$301.8K
Market Conditions
NOI Build-Up for 1,734 SF
Gross rent
$52.6K $30.36/SF
− Vacancy
−$3.3K −$1.88/SF
EGI
$49.4K $28.48/SF
− OpEx
−$22.2K −$12.81/SF
NOI
$27.2K $15.66/SF
Area
New Haven, CT
Vacancy
6.20%
Lease Rate
$30.36 /SF/Yr
Expense Ratio
45.00%
Simulate Cap Rate and NOI
Suggested Prices Based on Cap Rates
Cap Rate 5%
$543,180
Cap Rate 7%
$387,986
Cap Rate 9%
$301,767
Alternative Uses
Best Use
Apartment 5plus
$388.0K
$339.5K – $452.7K
NOI $27,159 @ 7.0% cap · market cap 7.15%
Second Best
—
—
no second resolved use
Theoretical Best
Office A
$557.8K
$488.1K – $650.8K
NOI $39,045 @ 7.0% cap · market cap 10.27%
Zoning and permitted uses should be independently verified with authorities.
How Realmo checks its estimates
Property Analytics
Unlock full access to Insights
Subscribe to Realmo Intelligence
Open Analytics
Current Use
Lease Details
Yes
Highway access
Location Intelligence
Trade Area within ½ mile
3,123
Businesses Nearby
Explore this area
Business Placement
Demographics for 06519, CT
15,450
Population
6,424
Households
2.4
Avg Household Size
33
Median Age
20%
College-Educated
77%
High-School Grad
1.8 sq mi
ZIP Area
8,583
Density / Sq Mi
$44,394
Median Household Income
$29,745
Median Earnings
$1,356
Median Rent
$247,600
Median Home Value
Check the figures for this property
Cap Rate, Value Estimation, Potential NOI and more
View Realmo Analytics

Questions? Ask Rey
Realmo’s AI knows this listing — price, zoning, demand, history. Ask anything.







Frequently Asked Questions
What type of property is this?
Residential income property - Multi-level residential property with separate-floor units, walk-out basement access, and on-street parking.
Where is this residential income property located?
The property is located at 70 Adeline New Haven, CT.
What is the asking price?
The asking price for this property is $380,000.
What are key features of this property?
This property features: RM2‑zoned residential income property at 70 Adeline Street, New Haven; Units arranged on different floors; Full unfinished basement with walk‑out access


