Multi-Tenant Retail Center with Grocery
For Sale
Contact for pricing
70-120 BARRINGTON TOWN SQ DR, Aurora, OH 44202
Multi-building center with Heinen’s grocery as a shadow anchor and strong in-place income; ~87% occupied.
Property Size112,663 SF
Price / SF$94.27
Days on Market183
Property Features for 70-120 BARRINGTON TOWN SQ DR
General Information
Standard status
Active
Size
112,663 SF
Total Parking Spaces
1255
Property subtype
Retail
Occupancy
87%
Net Operating Income
$856,736
Additional Details
Cap Rate
8.1%
Traffic Count
16,000 vehicles/day
Building Details
Year Built
1996
Stories
1
Units
16
Tenancy
Multi
Listing Agency:
Guggenheim Commercial Real Estate Group
Listed By:
Dean August · License #SAL2022004944
(216) 342-3670
Source:
Crexi
Added: Apr 24
Changed: Oct 1
Last Checked: Oct 23 at 4:28AM
Displayed information is deemed reliable but is not guaranteed and should be independently verified. All listing content including descriptions, pricing, images are the copyrighted material of Guggenheim Commercial Real Estate Group

Ask AI about this property
Review the available facts, identify missing information and prepare questions for the agent.
Investment Insights
Based on property information with market context.
Barrington Town Center is a 112,663 SF multi-tenant retail property developed across multiple buildings. The center is currently approximately 87% occupied and offers strong in-place income. Heinen’s grocery serves as a shadow anchor, supporting a tenant mix that includes national and regional brands.
The property is located at the intersection of SR-43, SR-82 and SR-306, providing visibility at major signalized intersections within a high-traffic corridor. Aurora Rd (SR-43) is listed at approximately 16,000+ VPD, and the property also reports 1.4M+ annual visitors (Placer.ai). The center includes 1,255 parking spaces.
Positioned between Cleveland and Akron, the trade area is described as affluent, with $150K+ household incomes and a reported 10-mile population of 199,018 and average household income of $161,890. The area is also expected to benefit from nearby redevelopment, including the former Geauga Lake site, introducing additional retail, residential, and mixed-use development.
The property is located at the intersection of SR-43, SR-82 and SR-306, providing visibility at major signalized intersections within a high-traffic corridor. Aurora Rd (SR-43) is listed at approximately 16,000+ VPD, and the property also reports 1.4M+ annual visitors (Placer.ai). The center includes 1,255 parking spaces.
Positioned between Cleveland and Akron, the trade area is described as affluent, with $150K+ household incomes and a reported 10-mile population of 199,018 and average household income of $161,890. The area is also expected to benefit from nearby redevelopment, including the former Geauga Lake site, introducing additional retail, residential, and mixed-use development.
Key Highlights
- 112,663 SF multi‑tenant retail center built in 1996, currently ~87% occupied
- 8.10% cap rate as stated, with strong in‑place income and additional upside through lease‑up and rent growth
- Shadow anchored by Heinen’s grocery with a strong tenant mix including national and regional brands
Financial Insights
Estimated NOI and Cap Rate
NOI / Yr
$444,245
Cap Rate
4.18%
Suggested Prices Based on Cap Rates
Cap Rate 5%
$8,884,900
$8.9M
Cap Rate 7%
$6,346,357
$6.3M
Cap Rate 9%
$4,936,056
$4.9M
Market Conditions
NOI Build-Up for 112,663 SF
Gross rent
$662.5K $5.88/SF
− Vacancy
−$27.8K −$0.25/SF
EGI
$634.6K $5.63/SF
− OpEx
−$190.4K −$1.69/SF
NOI
$444.2K $3.94/SF
Area
Portage County, OH
Vacancy
4.20%
Lease Rate
$5.88 /SF/Yr
Expense Ratio
30.00%
Simulate Cap Rate and NOI
Suggested Prices Based on Cap Rates
Cap Rate 5%
$8,884,900
Cap Rate 7%
$6,346,357
Cap Rate 9%
$4,936,056
Alternative Uses
Best Use
Retail
$6.35M
$5.55M – $7.40M
NOI $444,245 @ 7.0% cap · market cap 4.18%
Second Best
—
—
no second resolved use
Theoretical Best
Office A
$22.69M
$19.86M – $26.48M
NOI $1,588,527 @ 7.0% cap · market cap 14.96%
Zoning and permitted uses should be independently verified with authorities.
How Realmo checks its estimates
Property Analytics
Current Use
Lease Details
16,000 VPD
Traffic count
Location Intelligence
Trade Area within ½ mile
494
Businesses Nearby
137k
Monthly Visits Nearby
Balanced
Demand for This Use
Explore this area
Business Placement
Foot Traffic Nearby
Dining 43%
Shops & Services 35%
Groceries 16%
Beauty & Spa 4%
Heinen's Grocery Store
Groceries
22,546 visits/mo
0.1 miles
McDonald's
Dining
18,687 visits/mo
0.3 miles
Shell
Shops & Services
18,064 visits/mo
0.2 miles
Dollar Tree
Shops & Services
17,341 visits/mo
0.1 miles
Dunkin' Donuts
Dining
12,784 visits/mo
0.2 miles
Demographics for 44202, OH
22,167
Population
9,612
Households
2.3
Avg Household Size
46
Median Age
56%
College-Educated
97%
High-School Grad
30.3 sq mi
ZIP Area
732
Density / Sq Mi
$116,556
Median Household Income
$67,796
Median Earnings
$1,701
Median Rent
$356,000
Median Home Value
Market
Vacancy Rate% for Retail in Midwest region



Similar Off Market Nearby
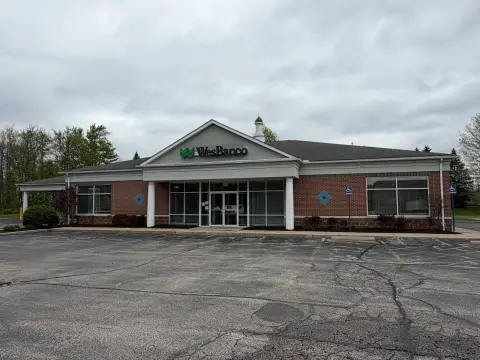
- Barrington Town Center — 70-130 Barrington Town Square Dr, Aurora, OH 44202
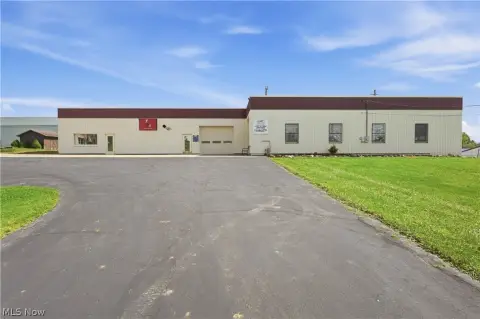
- Barrington Town Center — 70 barrington town square dr, aurora, oh 44202
Frequently Asked Questions
What type of property is this?
Shopping center - Multi-building center with Heinen’s grocery as a shadow anchor and strong in-place income; ~87% occupied.
Where is this shopping center located?
The property is located at 70-120 BARRINGTON TOWN SQ DR Aurora, OH.
What is the asking price?
The asking price for this property is $10,620,247.
What are key features of this property?
This property features: 112,663 SF multi‑tenant retail center built in 1996, currently ~87% occupied; 8.10% cap rate as stated, with strong in‑place income and additional upside through lease‑up and rent growth; Shadow anchored by Heinen’s grocery with a strong tenant mix including national and regional brands


