Renovated Residential Income
For Sale
$389,000
Pending
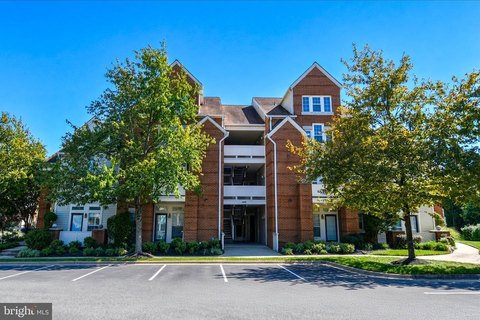
6911 MARY CAROLINE CIRCLE Unit A, Alexandria, VA 22310
Main-level condominium with upgraded systems, appliances, flooring, bathrooms, and access to community amenities.
Property Size951 SF
Days on Market90
Property Features for 6911 MARY CAROLINE CIRCLE Unit A
General Information
Standard status
Pending
Size
951 SF
Property subtype
Unit/Flat/Apartment
Site & Location
Highway Access
Yes
Public Transit
Yes
Additional Details
Multifamily Units
1
Taxes and HOA fees
Annual Taxes
$3,805
Amenities
community center
fitness center
pool
Building Details
Building Size
951 SF
Year Built
1988
Listing Agency:
CENTURY 21 New Millennium
Listed By:
Jennifer Hernandez
(202) 339-2511
Source:
Dcmetrorealtyteam
Added: Jul 24
Changed: Oct 14
Last Checked: Oct 21 at 3:01AM
Displayed information is deemed reliable but is not guaranteed and should be independently verified. All listing content including descriptions, pricing, images are the copyrighted material of CENTURY 21 New Millennium

Ask AI about this property
Review the available facts, identify missing information and prepare questions for the agent.
Investment Insights
Based on property information with market context.
This main-level condominium at 6911 Mary Caroline Circle, Unit A, features extensive interior and infrastructure improvements. The kitchen includes white quartz countertops, a 16-inch breakfast bar, and new stove, dishwasher, microwave, and disposal. New LVP flooring and light fixtures extend throughout the unit, while the master and hall bathrooms have been renovated. Popcorn ceilings were removed, and the property has no-stair entry.
Major system updates include a new HVAC system installed in 2023, a hot water heater from 2020, a replaced main water valve, and a new copper piping manifold with shutoff valves. Faucets were fitted with PEX-A piping and approved fittings, along with new plumbing valves, hoses, sinks, and drains.
The condo fee includes access to a community center, fitness center, and pool. The property is near Kingstowne Towne Center, Springfield Town Center, Wegmans, restaurants, shopping, walking trails, and parks, with access to I-495 and I-95 and proximity to Fort Belvoir, the Pentagon, Fort Myer, Quantico, and two Metro stations.
Major system updates include a new HVAC system installed in 2023, a hot water heater from 2020, a replaced main water valve, and a new copper piping manifold with shutoff valves. Faucets were fitted with PEX-A piping and approved fittings, along with new plumbing valves, hoses, sinks, and drains.
The condo fee includes access to a community center, fitness center, and pool. The property is near Kingstowne Towne Center, Springfield Town Center, Wegmans, restaurants, shopping, walking trails, and parks, with access to I-495 and I-95 and proximity to Fort Belvoir, the Pentagon, Fort Myer, Quantico, and two Metro stations.
Key Highlights
- Extensive kitchen renovation with quartz countertops, new appliances, and a 16" breakfast bar
- New HVAC system installed in 2023
- Hot water heater replaced in 2020 with pressure‑reducing valve and shutoff
Financial Insights
Estimated NOI and Cap Rate
NOI / Yr
$14,578
Cap Rate
3.75%
Suggested Prices Based on Cap Rates
Cap Rate 5%
$291,560
$291.6K
Cap Rate 7%
$208,257
$208.3K
Cap Rate 9%
$161,978
$162.0K
Market Conditions
NOI Build-Up for 951 SF
Gross rent
$28.0K $29.40/SF
− Vacancy
−$1.5K −$1.53/SF
EGI
$26.5K $27.87/SF
− OpEx
−$11.9K −$12.54/SF
NOI
$14.6K $15.33/SF
Area
Alexandria, VA
Vacancy
5.20%
Lease Rate
$29.40 /SF/Yr
Expense Ratio
45.00%
Simulate Cap Rate and NOI
Suggested Prices Based on Cap Rates
Cap Rate 5%
$291,560
Cap Rate 7%
$208,257
Cap Rate 9%
$161,978
Alternative Uses
Best Use
Apartment 5plus
$208.3K
$182.2K – $243.0K
NOI $14,578 @ 7.0% cap · market cap 3.75%
Second Best
—
—
no second resolved use
Theoretical Best
Specialty Retail
$528.2K
$462.2K – $616.3K
NOI $36,975 @ 7.0% cap · market cap 9.51%
Zoning and permitted uses should be independently verified with authorities.
How Realmo checks its estimates
Property Analytics
Contact the owner directly
Get the owner's phone numbers and email
Open Analytics
Lease Details
1
Residential units
Yes
Highway access
Location Intelligence
Trade Area within ½ mile
847
Businesses Nearby
Explore this area
Business Placement
Demographics for 22310, VA
29,611
Population
11,116
Households
2.7
Avg Household Size
39
Median Age
64%
College-Educated
95%
High-School Grad
6.7 sq mi
ZIP Area
4,420
Density / Sq Mi
$160,872
Median Household Income
$83,668
Median Earnings
$2,396
Median Rent
$627,400
Median Home Value
Check the figures for this property
Cap Rate, Value Estimation, Potential NOI and more
View Realmo Analytics




Frequently Asked Questions
What type of property is this?
Residential income property - Main-level condominium with upgraded systems, appliances, flooring, bathrooms, and access to community amenities.
Where is this residential income property located?
The property is located at 6911 MARY CAROLINE CIRCLE Unit A Alexandria, VA.
What is the asking price?
The asking price for this property is $389,000.
What are key features of this property?
This property features: Extensive kitchen renovation with quartz countertops, new appliances, and a 16" breakfast bar; New HVAC system installed in 2023; Hot water heater replaced in 2020 with pressure‑reducing valve and shutoff


