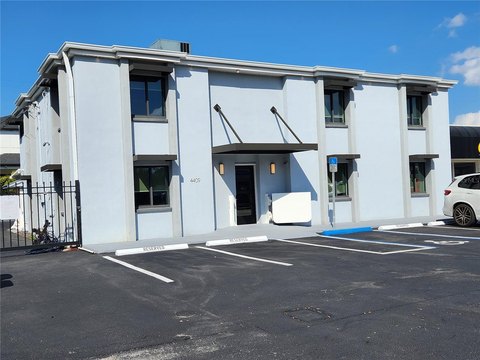
Two-Story Office Building with
For Sale
Contact for pricing
6730 W LINEBAUGH AVE, Tampa, FL 33625
Leased ground-floor medical office space with a fully built-out interior, plus an executive second floor available for occupancy.
Property Size10,715 SF
Days on Market100
Property Features for 6730 W LINEBAUGH AVE
General Information
Standard status
Active
Size
10,715 SF
Property subtype
Office
Additional Details
Highway Access
Yes
Taxes and HOA fees
Annual Taxes
$35,101
Amenities
private elevator
executive office build-out
spacious conference room
collaborative open workspace
two private balconies with lake views
executive suite with private restroom and shower
Building Details
Building Size
10,715 SF
Year Built
2006
Construction
Mediterranean-style
Listing Agency:
TMC THE MAHR COMPANY
Listed By:
Amy Cox · License #0667992
(806) 543-6095
Source:
Thefullerproperties
Added: Jul 14
Changed: Oct 15
Last Checked: Oct 21 at 3:53AM
Displayed information is deemed reliable but is not guaranteed and should be independently verified. All listing content including descriptions, pricing, images are the copyrighted material of TMC THE MAHR COMPANY

Ask AI about this property
Review the available facts, identify missing information and prepare questions for the agent.
Investment Insights
Based on property information with market context.
This two-story Mediterranean-style office building is set up for a convenient owner-user arrangement, with a leased ground floor fully built out for medical office use and a second floor that can support owner occupancy or additional leasing. The property includes a private elevator, executive office build-out, a spacious conference room, and a collaborative open workspace.
The second floor features two private balconies with lake views, along with an executive suite that includes a private restroom and shower. Car-dependent access is supported by immediate connection to Veterans Expressway (SR 589), with Tampa International Airport, Westshore, and Downtown Tampa also within reach.
The current configuration supports professional office use, including medical office. The building is described as well maintained and is positioned to support day-to-day operations for an owner or incoming tenant(s).
The second floor features two private balconies with lake views, along with an executive suite that includes a private restroom and shower. Car-dependent access is supported by immediate connection to Veterans Expressway (SR 589), with Tampa International Airport, Westshore, and Downtown Tampa also within reach.
The current configuration supports professional office use, including medical office. The building is described as well maintained and is positioned to support day-to-day operations for an owner or incoming tenant(s).
Key Highlights
- 2006‑built Mediterranean‑style office building in Tampa’s Northwest Office Submarket
- Leased ground‑floor medical office is fully built out and provides existing rental income
- Executive second floor available for owner occupancy or additional leasing
Financial Insights
Estimated NOI and Cap Rate
NOI / Yr
$156,148
Cap Rate
5.79%
Suggested Prices Based on Cap Rates
Cap Rate 5%
$3,122,960
$3.1M
Cap Rate 7%
$2,230,686
$2.2M
Cap Rate 9%
$1,734,978
$1.7M
Market Conditions
NOI Build-Up for 10,715 SF
Gross rent
$282.9K $26.40/SF
− Vacancy
−$22.6K −$2.11/SF
EGI
$260.2K $24.29/SF
− OpEx
−$104.1K −$9.72/SF
NOI
$156.1K $14.57/SF
Area
Tampa, FL
Vacancy
8.00%
Lease Rate
$26.40 /SF/Yr
Expense Ratio
40.00%
Simulate Cap Rate and NOI
Suggested Prices Based on Cap Rates
Cap Rate 5%
$3,122,960
Cap Rate 7%
$2,230,686
Cap Rate 9%
$1,734,978
Alternative Uses
Best Use
Healthcare Medical
$2.23M
$1.95M – $2.60M
NOI $156,148 @ 7.0% cap · market cap 5.79%
Second Best
Office B
$2.08M
$1.82M – $2.43M
NOI $145,617 @ 7.0% cap · market cap 5.40%
Theoretical Best
Office A
$2.50M
$2.18M – $2.91M
NOI $174,740 @ 7.0% cap · market cap 6.48%
Zoning and permitted uses should be independently verified with authorities.
How Realmo checks its estimates
Property Analytics
Who owns this building?
See the owner, sales and loan history
Open Analytics
Current Use
Lease Details
Yes
Highway access
Location Intelligence
Trade Area within ½ mile
418
Businesses Nearby
Explore this area
Business Placement
Demographics for 33625, FL
28,704
Population
12,025
Households
2.4
Avg Household Size
40
Median Age
38%
College-Educated
93%
High-School Grad
9.0 sq mi
ZIP Area
3,189
Density / Sq Mi
$83,907
Median Household Income
$46,483
Median Earnings
$1,797
Median Rent
$341,600
Median Home Value
Check the figures for this property
Cap Rate, Value Estimation, Potential NOI and more
View Realmo Analytics
Market
Vacancy Rate% for Office in Tampa, FL



Frequently Asked Questions
What type of property is this?
Office building - Leased ground-floor medical office space with a fully built-out interior, plus an executive second floor available for occupancy.
Where is this office building located?
The property is located at 6730 W LINEBAUGH AVE Tampa, FL.
What is the asking price?
The asking price for this property is $2,695,000.
What are key features of this property?
This property features: 2006‑built Mediterranean‑style office building in Tampa’s Northwest Office Submarket; Leased ground‑floor medical office is fully built out and provides existing rental income; Executive second floor available for owner occupancy or additional leasing