Eight-Unit Multifamily
For Sale
Contact for pricing
673 Halsey St, Brooklyn, NY 11233
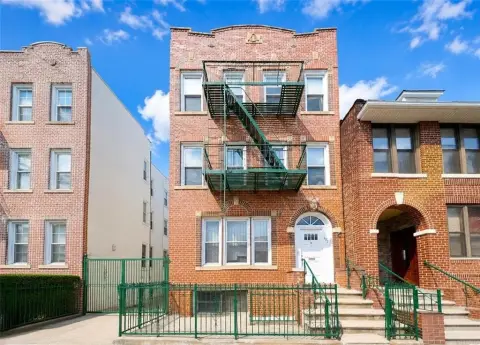
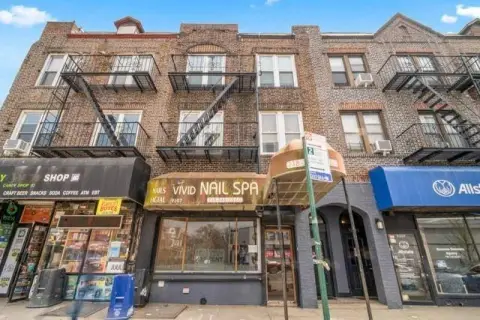
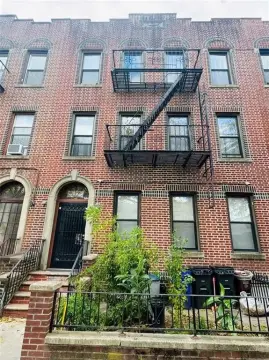
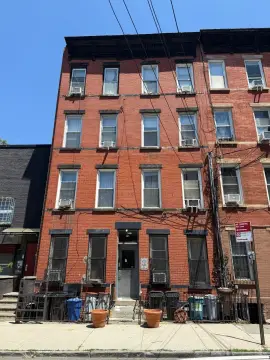
Renovated eight-unit multifamily building with central heating and cooling, fully occupied and currently producing in-place income.
Property Size5,649 SF
Lot Size0.06 Acres
Price / SF$548.77
Days on Market138
Property Features for 673 Halsey St
General Information
Standard status
Active
Size
5,649 SF
Lot size
0.06 Acres
Property subtype
Multifamily
Zoning
R6B
Occupancy
100%
Investment Type
Stabilized
Additional Details
Multifamily Units
8
Building Details
Year Built
1910
Year Renovated
2016
Stories
3
Units
8
Tenancy
Single
Listing Agency:
Asset CRG Advisors, LLC
Listed By:
Sadya Liberow · License #NY
(347) 762-4055
Source:
Crexi
Added: Jun 11
Changed: Oct 25
Last Checked: Oct 24 at 6:06PM
Displayed information is deemed reliable but is not guaranteed and should be independently verified. All listing content including descriptions, pricing, images are the copyrighted material of Asset CRG Advisors, LLC

Ask AI about this property
Review the available facts, identify missing information and prepare questions for the agent.
Investment Insights
Based on property information with market context.
This eight-family multifamily building was originally constructed in 1910 and fully renovated in 2016. The property is currently configured as eight residential units and is equipped with central heating and cooling to support modern, consistent tenant comfort. All units are fully occupied, providing in-place income for an investor from day one.
The building benefits from a 15-year J-51 tax abatement that expires in 2032. After the abatement period ends, the units have the potential to transition to free-market status.
Located in Bedford-Stuyvesant, the property offers convenient public transit access, with the Halsey Street (J) and Chauncey Street (J/Z) subway stations within walking distance.
The building benefits from a 15-year J-51 tax abatement that expires in 2032. After the abatement period ends, the units have the potential to transition to free-market status.
Located in Bedford-Stuyvesant, the property offers convenient public transit access, with the Halsey Street (J) and Chauncey Street (J/Z) subway stations within walking distance.
Key Highlights
- Eight‑family multifamily building on 673 Halsey St, Brooklyn, originally built in 1910
- Fully renovated in 2016 and configured as 8 residential units
- Approximately 5,649 built SF on a 2,700 SF lot
Financial Insights
Estimated NOI and Cap Rate
NOI / Yr
$172,458
Cap Rate
5.56%
Suggested Prices Based on Cap Rates
Cap Rate 5%
$3,449,160
$3.4M
Cap Rate 7%
$2,463,686
$2.5M
Cap Rate 9%
$1,916,200
$1.9M
Market Conditions
NOI Build-Up for 5,649 SF
Gross rent
$320.0K $56.64/SF
− Vacancy
−$6.4K −$1.13/SF
EGI
$313.6K $55.51/SF
− OpEx
−$141.1K −$24.98/SF
NOI
$172.5K $30.53/SF
Area
Brooklyn, NY
Vacancy
2.00%
Lease Rate
$56.64 /SF/Yr
Expense Ratio
45.00%
Simulate Cap Rate and NOI
Suggested Prices Based on Cap Rates
Cap Rate 5%
$3,449,160
Cap Rate 7%
$2,463,686
Cap Rate 9%
$1,916,200
Alternative Uses
Best Use
Apartment 5plus
$2.46M
$2.16M – $2.87M
NOI $172,458 @ 7.0% cap · market cap 5.56%
Second Best
—
—
no second resolved use
Theoretical Best
Specialty Retail
$4.68M
$4.09M – $5.46M
NOI $327,416 @ 7.0% cap · market cap 10.56%
Zoning and permitted uses should be independently verified with authorities.
How Realmo checks its estimates
Property Analytics
Unlock full access to Insights
Subscribe to Realmo Intelligence
Open Analytics
Lease Details
8
Residential units
Location Intelligence
Trade Area within ½ mile
3,485
Businesses Nearby
Explore this area
Business Placement
Demographics for 11233, NY
75,399
Population
34,412
Households
2.2
Avg Household Size
35
Median Age
33%
College-Educated
86%
High-School Grad
1.3 sq mi
ZIP Area
57,999
Density / Sq Mi
$62,034
Median Household Income
$47,149
Median Earnings
$1,613
Median Rent
$1,013,000
Median Home Value
Check the figures for this property
Cap Rate, Value Estimation, Potential NOI and more
View Realmo Analytics
Market
Vacancy Rate% for Multifamily in Northeast region





Frequently Asked Questions
What type of property is this?
Apartment building - Renovated eight-unit multifamily building with central heating and cooling, fully occupied and currently producing in-place income.
Where is this apartment building located?
The property is located at 673 Halsey St Brooklyn, NY.
What is the asking price?
The asking price for this property is $3,100,000.
What are key features of this property?
This property features: Eight‑family multifamily building on 673 Halsey St, Brooklyn, originally built in 1910; Fully renovated in 2016 and configured as 8 residential units; Approximately 5,649 built SF on a 2,700 SF lot



