Historic Four-Unit Queen Anne
For Sale
$1,450,000
669 W Canfield St, Detroit, MI 48201
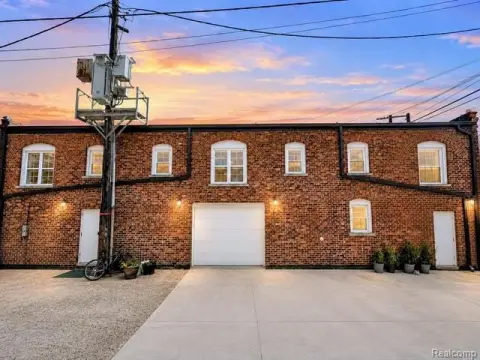
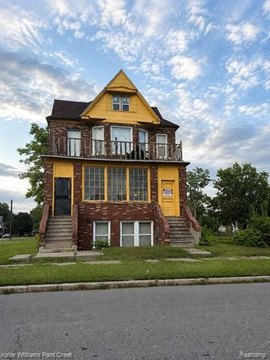
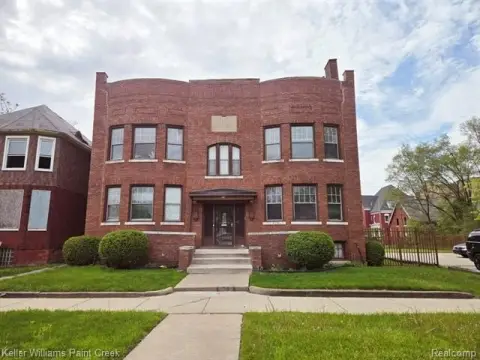
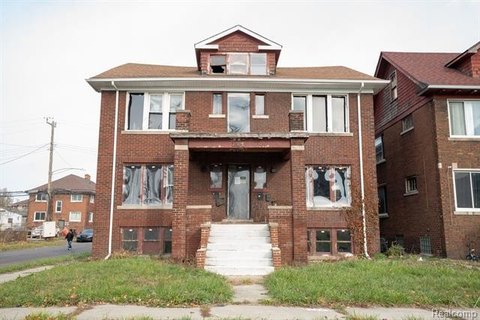
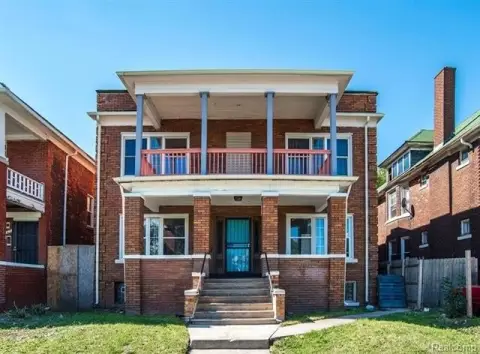
Queen Anne residence with a modernized carriage house, private driveway, and approved plans for additional attic space.
Property Size5,812 SF
Price / SF$249.48
Days on Market55
Property Features for 669 W Canfield St
General Information
Standard status
Active
Size
5,812 SF
Property subtype
Multi-Family
Additional Details
Multifamily Units
4
Amenities
private driveway
spacious backyard
Building Details
Year Built
1880
Buildings
2
Construction
Queen Anne
Listing Agency:
Golden Key Realty Group LLC
Listed By:
D'Asia P Taylor · License #6501418855
(313) 290-3716
Source:
Metrodetroithomeguide
Added: Aug 24
Changed: Oct 16
Last Checked: Oct 16 at 9:40AM
Displayed information is deemed reliable but is not guaranteed and should be independently verified. All listing content including descriptions, pricing, images are the copyrighted material of Golden Key Realty Group LLC

Ask AI about this property
Review the available facts, identify missing information and prepare questions for the agent.
Investment Insights
Based on property information with market context.
Located at 669 W Canfield St in Detroit’s Canfield Historic District, this Queen Anne property is arranged as a four-unit asset with three units in the primary residence and one unit in a separate Carriage House. The 1880-built property includes renovated kitchens and bathrooms, updated flooring, restored walls, structural reinforcement, and a restored front porch.
Major building systems have been upgraded, including HVAC equipment, ductwork, electrical wiring, a 200-amp panel, GFCI outlets, and interconnected smoke and carbon monoxide detectors. Basement improvements add a bonus room and epoxy flooring. The renovated Carriage House includes a kitchen and 1.5 baths, along with septic repairs and wildlife mitigation.
Approved architectural plans support future development of an approximately 1,433-square-foot attic studio with a private balcony. The property also offers a private driveway, spacious backyard, existing rental income, and submitted applications involving PRE, NEZ, and PILOT tax programs.
Major building systems have been upgraded, including HVAC equipment, ductwork, electrical wiring, a 200-amp panel, GFCI outlets, and interconnected smoke and carbon monoxide detectors. Basement improvements add a bonus room and epoxy flooring. The renovated Carriage House includes a kitchen and 1.5 baths, along with septic repairs and wildlife mitigation.
Approved architectural plans support future development of an approximately 1,433-square-foot attic studio with a private balcony. The property also offers a private driveway, spacious backyard, existing rental income, and submitted applications involving PRE, NEZ, and PILOT tax programs.
Key Highlights
- Four‑unit configuration with 3 units in the main residence and 1 in the Carriage House
- Approved plans for an approximately 1,433 sq. ft. attic studio with private balcony
- 1880‑built Queen Anne property in Detroit’s Canfield Historic District
Financial Insights
Estimated NOI and Cap Rate
NOI / Yr
$66,422
Cap Rate
4.58%
Suggested Prices Based on Cap Rates
Cap Rate 5%
$1,328,440
$1.3M
Cap Rate 7%
$948,886
$948.9K
Cap Rate 9%
$738,022
$738.0K
Market Conditions
NOI Build-Up for 5,812 SF
Gross rent
$101.1K $17.40/SF
− Vacancy
−$6.2K −$1.07/SF
EGI
$94.9K $16.33/SF
− OpEx
−$28.5K −$4.90/SF
NOI
$66.4K $11.43/SF
Area
Detroit, MI
Vacancy
6.17%
Lease Rate
$17.40 /SF/Yr
Expense Ratio
30.00%
Simulate Cap Rate and NOI
Suggested Prices Based on Cap Rates
Cap Rate 5%
$1,328,440
Cap Rate 7%
$948,886
Cap Rate 9%
$738,022
Alternative Uses
Best Use
Multifamily LT 5
$948.9K
$830.3K – $1.11M
NOI $66,422 @ 7.0% cap · market cap 4.58%
Second Best
Apartment 5plus
$871.0K
$762.2K – $1.02M
NOI $60,972 @ 7.0% cap · market cap 4.20%
Theoretical Best
Office A
$1.28M
$1.12M – $1.50M
NOI $89,750 @ 7.0% cap · market cap 6.19%
Zoning and permitted uses should be independently verified with authorities.
How Realmo checks its estimates
Property Analytics
Unlock full access to Insights
Subscribe to Realmo Intelligence
Open Analytics
Current Use
Lease Details
4
Residential units
Location Intelligence
Trade Area within ½ mile
3,214
Businesses Nearby
Explore this area
Business Placement
Demographics for 48201, MI
14,500
Population
9,900
Households
1.5
Avg Household Size
33
Median Age
37%
College-Educated
88%
High-School Grad
1.9 sq mi
ZIP Area
7,632
Density / Sq Mi
$24,392
Median Household Income
$36,835
Median Earnings
$841
Median Rent
$401,500
Median Home Value
Check the figures for this property
Cap Rate, Value Estimation, Potential NOI and more
View Realmo Analytics
Market
Vacancy Rate% for Multifamily in Midwest region




Frequently Asked Questions
What type of property is this?
Quadplex - Queen Anne residence with a modernized carriage house, private driveway, and approved plans for additional attic space.
Where is this quadplex located?
The property is located at 669 W Canfield St Detroit, MI.
What is the asking price?
The asking price for this property is $1,450,000.
What are key features of this property?
This property features: Four‑unit configuration with 3 units in the main residence and 1 in the Carriage House; Approved plans for an approximately 1,433 sq. ft. attic studio with private balcony; 1880‑built Queen Anne property in Detroit’s Canfield Historic District


