Three-Story Mixed-Use
For Sale
Contact for pricing
646 Bay Street, Staten Island, NY 10304
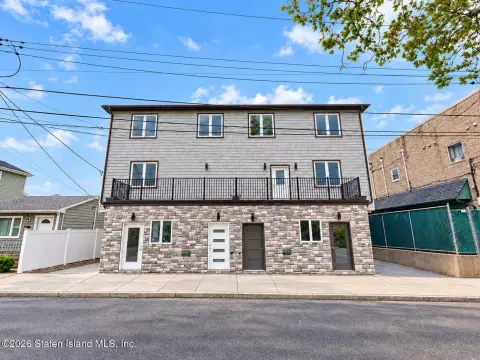
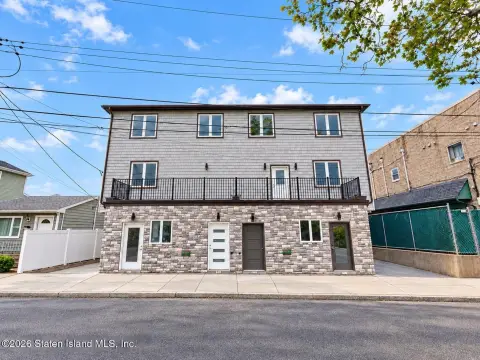
Street-level commercial space is paired with two upper-floor residential units in a transit-connected property.
Property Size3,375 SF
Price / SF$375
Days on Market367
Property Features for 646 Bay Street
General Information
Standard status
Active
Size
3,375 SF
Property subtype
Business for Sale
Zoning
C4-2
Building Details
Year Built
1931
Buildings
1
Stories
3
Listing Agency:
Coldwell Banker Advantage
Listed By:
Gail Ruiz · License #10401354271
Source:
Crexi
Added: Oct 15, 2025
Changed: Oct 3
Last Checked: Oct 14 at 10:58PM
Displayed information is deemed reliable but is not guaranteed and should be independently verified. All listing content including descriptions, pricing, images are the copyrighted material of Coldwell Banker Advantage

Ask AI about this property
Review the available facts, identify missing information and prepare questions for the agent.
Investment Insights
Based on property information with market context.
This three-story property combines a ground-floor commercial area with two residential units occupying the second and third floors. The commercial portion measures 960 SF, while the residential space totals 1,920 SF. Built in 1931, the building carries C4-2 zoning and offers a combination of commercial and residential occupancy within one asset.
The property is within walking distance of a train station and near public transportation. The surrounding area has substantial pedestrian and vehicle activity. Train service also provides access to the Staten Island Ferry, with a free 25-minute commute to NYC.
The property is within walking distance of a train station and near public transportation. The surrounding area has substantial pedestrian and vehicle activity. Train service also provides access to the Staten Island Ferry, with a free 25-minute commute to NYC.
Key Highlights
- Three‑story mixed‑use building with ground‑floor commercial space and 2 residential units
- 960 SF of commercial space
- 1,920 SF of residential space
Financial Insights
Estimated NOI and Cap Rate
NOI / Yr
$83,399
Cap Rate
6.57%
Suggested Prices Based on Cap Rates
Cap Rate 5%
$1,667,980
$1.7M
Cap Rate 7%
$1,191,414
$1.2M
Cap Rate 9%
$926,656
$926.7K
Market Conditions
NOI Build-Up for 3,375 SF
Gross rent
$129.6K $38.40/SF
− Vacancy
−$10.5K −$3.10/SF
EGI
$119.1K $35.30/SF
− OpEx
−$35.7K −$10.59/SF
NOI
$83.4K $24.71/SF
Area
ZIP 10304
Vacancy
8.07%
Lease Rate
$38.40 /SF/Yr
Expense Ratio
30.00%
Simulate Cap Rate and NOI
Suggested Prices Based on Cap Rates
Cap Rate 5%
$1,667,980
Cap Rate 7%
$1,191,414
Cap Rate 9%
$926,656
Alternative Uses
Best Use
Multifamily LT 5
$1.19M
$1.04M – $1.39M
NOI $83,399 @ 7.0% cap · market cap 6.57%
Second Best
Apartment 5plus
$1.09M
$955.4K – $1.27M
NOI $76,431 @ 7.0% cap · market cap 6.02%
Theoretical Best
Office A
$1.61M
$1.41M – $1.88M
NOI $112,726 @ 7.0% cap · market cap 8.88%
Zoning and permitted uses should be independently verified with authorities.
How Realmo checks its estimates
Property Analytics
Current Use
Location Intelligence
Trade Area within ½ mile
1,405
Businesses Nearby
Explore this area
Business Placement
Demographics for 10304, NY
46,944
Population
17,524
Households
2.7
Avg Household Size
38
Median Age
31%
College-Educated
84%
High-School Grad
3.5 sq mi
ZIP Area
13,413
Density / Sq Mi
$71,506
Median Household Income
$41,752
Median Earnings
$1,516
Median Rent
$659,900
Median Home Value
Market
Vacancy Rate% for Multifamily in Northeast region
Frequently Asked Questions
What type of property is this?
Mixed-use property - Street-level commercial space is paired with two upper-floor residential units in a transit-connected property.
Where is this mixed-use property located?
The property is located at 646 Bay Street Staten Island, NY.
What is the asking price?
The asking price for this property is $1,268,999.
What are key features of this property?
This property features: Three‑story mixed‑use building with ground‑floor commercial space and 2 residential units; 960 SF of commercial space; 1,920 SF of residential space


