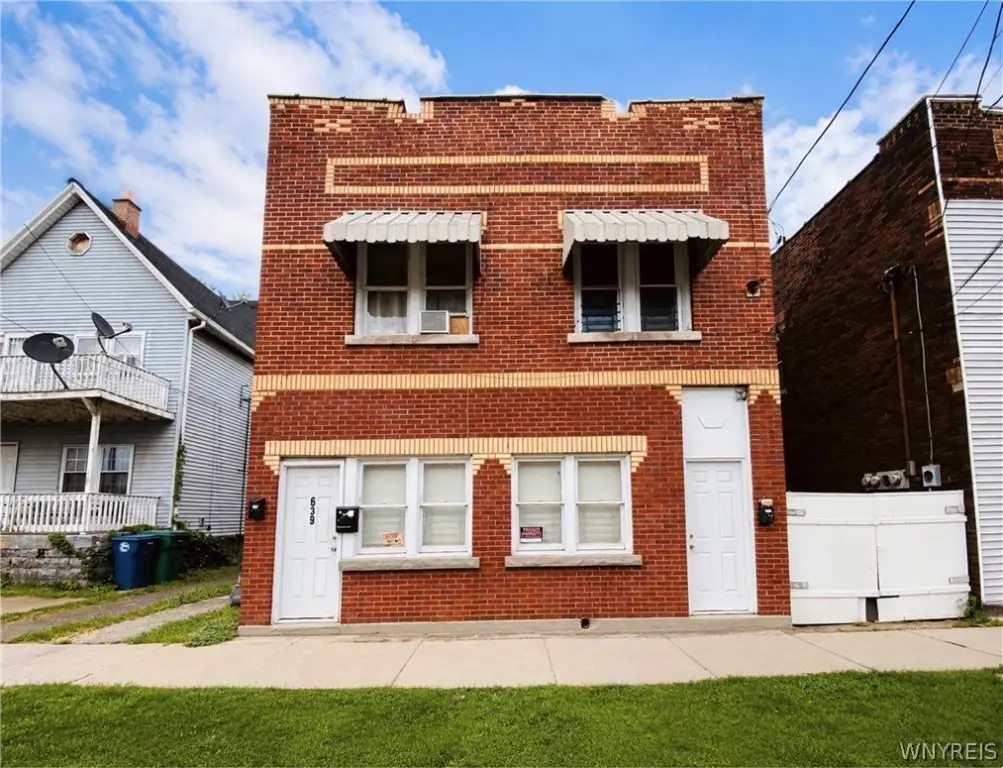
Brick Triplex with
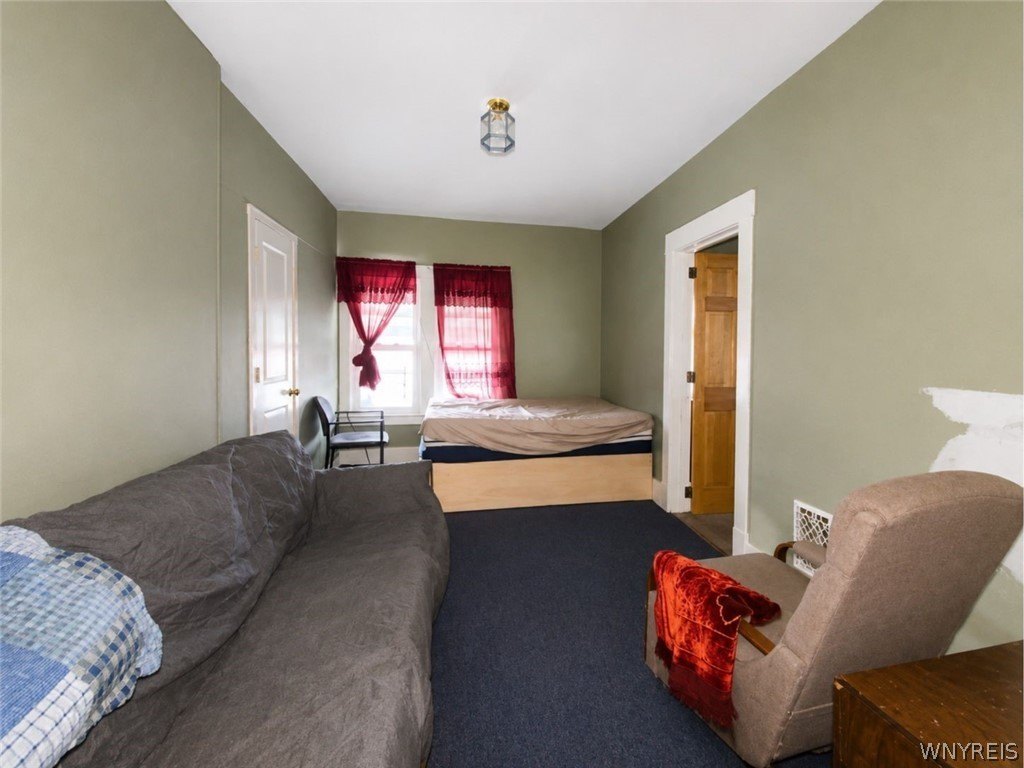
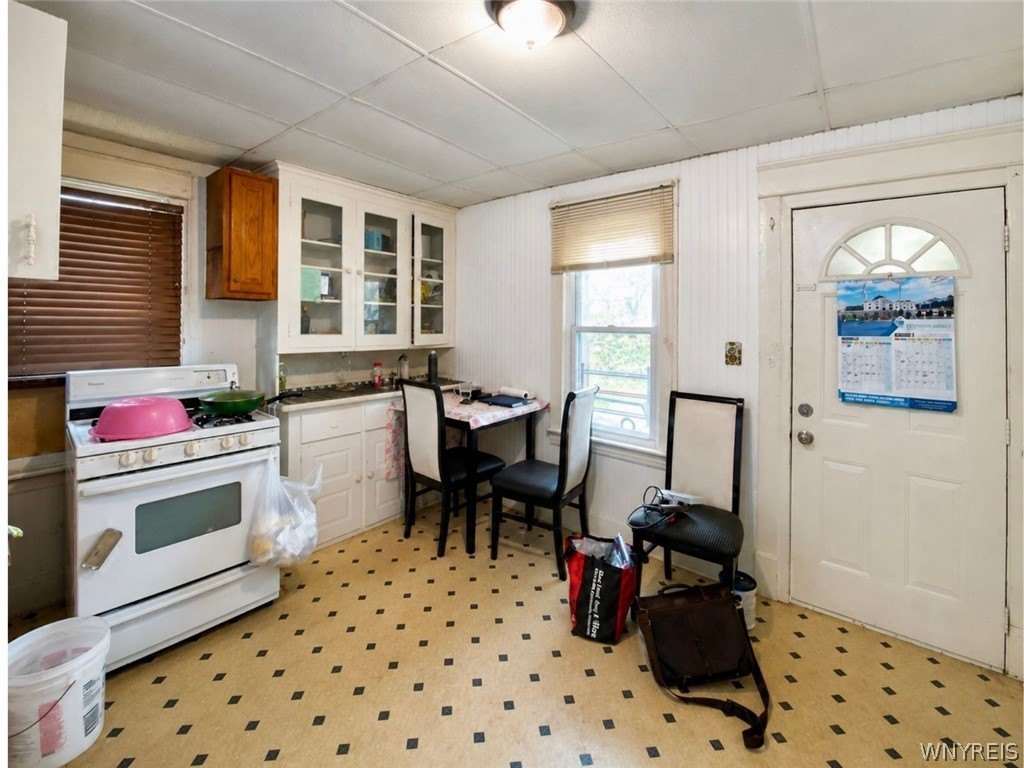
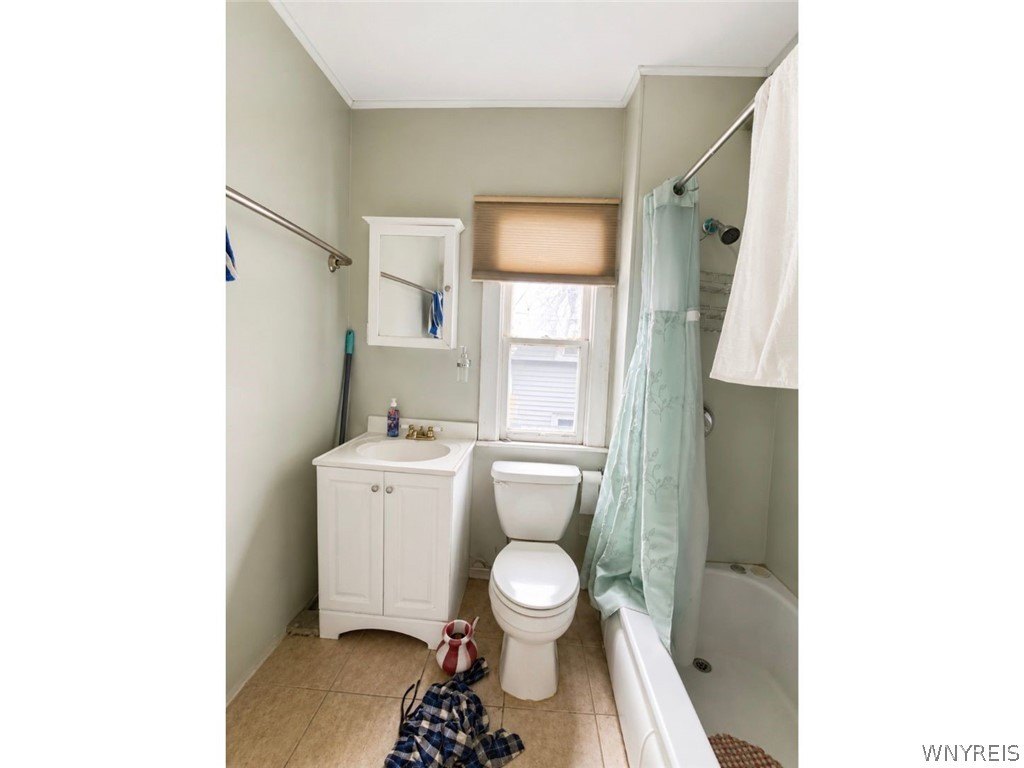
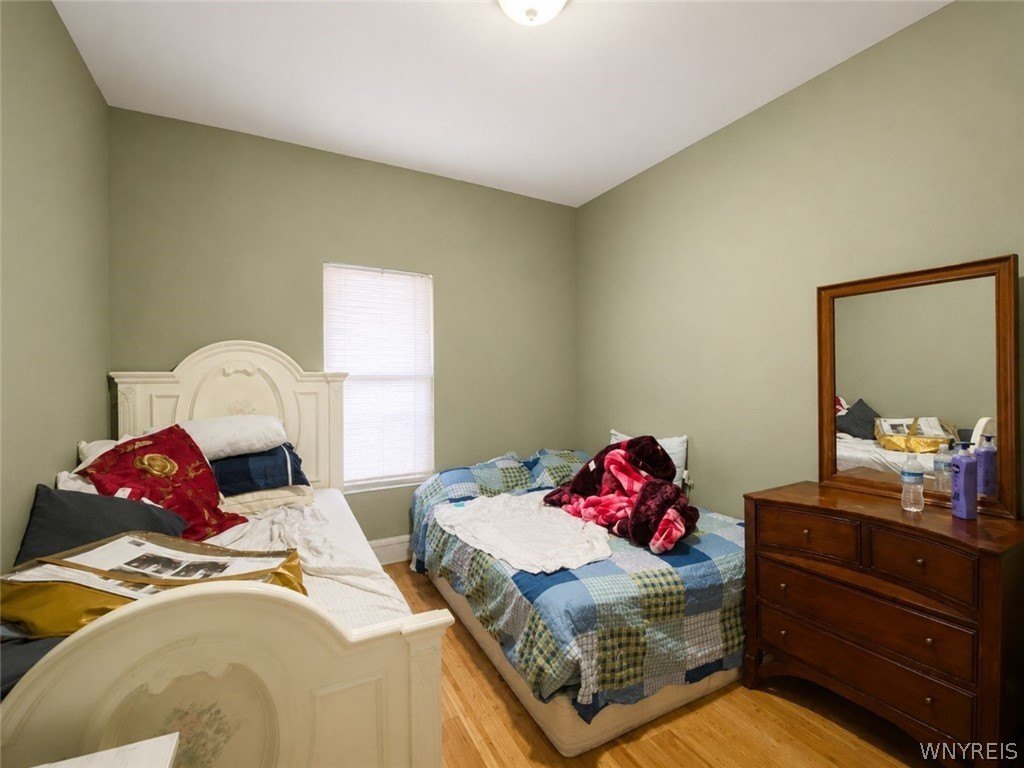
For Sale
$195,000
639 18th Street, Niagara Falls, NY 14301
Residential, Niagara Falls, NY
Property Size2,304 SF
Lot Size0.10 Acres
Price / SF$84.64
Days on Market141
Property Features for 639 18th Street
General Information
Property type
Residential Multi Family
Property subtype
Other
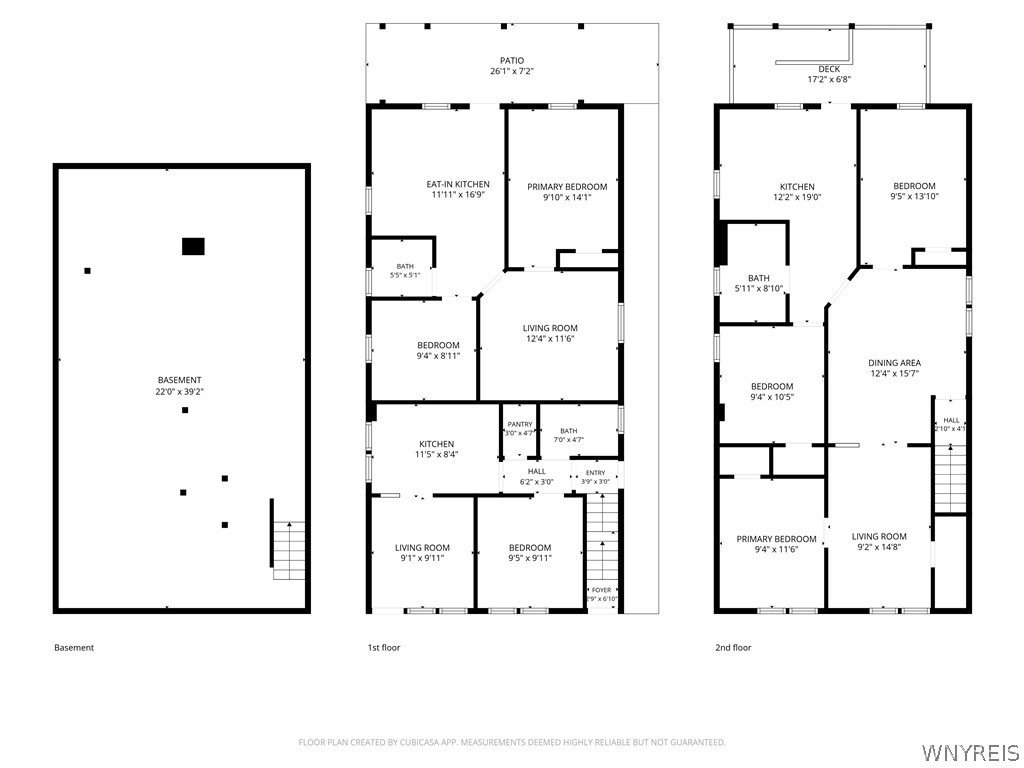
Bedrooms
6
Bathrooms
3
Full bathrooms
3
Rooms
Bathroom 1, Bathroom 2, Bedroom 1, Bedroom 4, Bedroom 5, Bathroom 3, Bedroom 6, Basement, Bedroom 2, Bedroom 3
Patio and Porch features
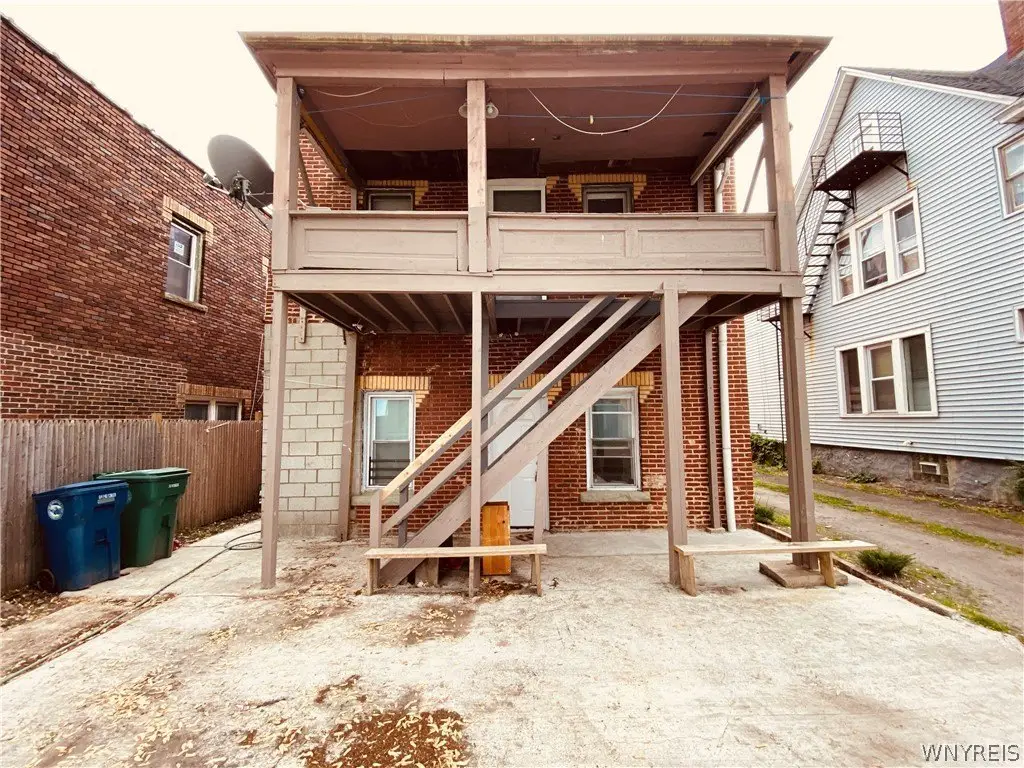
Porch, Patio
Exterior features
Balcony, Fence, Patio
Fencing
Fenced
Appliances
GasWaterHeater
Subdivision
Stedman Farm
Lot features
Near Public Transit, Rectangular, Rectangular Lot, Residential Lot
Elementary school district
Niagara Falls
Middle school district
Niagara Falls
High school district
Niagara Falls
Standard status
Active
APN
291100-159-024-0002-042-000
Size
2,304 SF
Lot size
0.10 Acres
Taxes and HOA fees
Tax Annual Amount
1263
Utilities
Heating system
Forced Air, Natural Gas
Water source
Public
Amenities
off-street parking
garage
covered porch
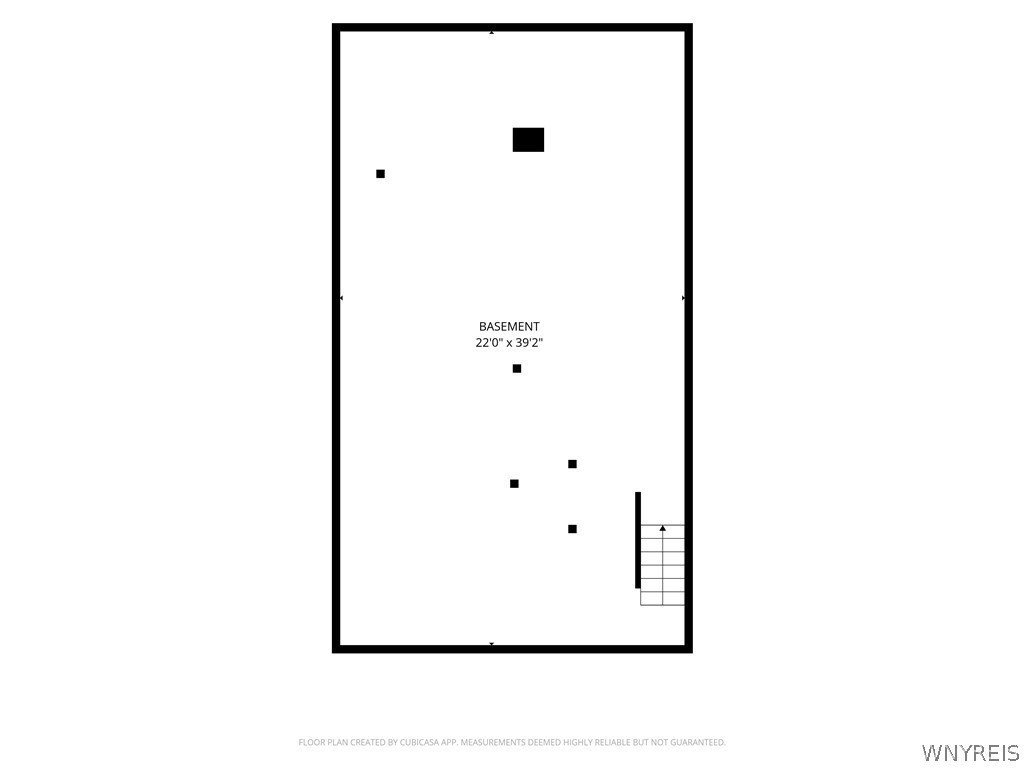
full basement
laundry hookups
Building Details
Year built
1920
Floors in Building
2
Number of units
3
Flooring type
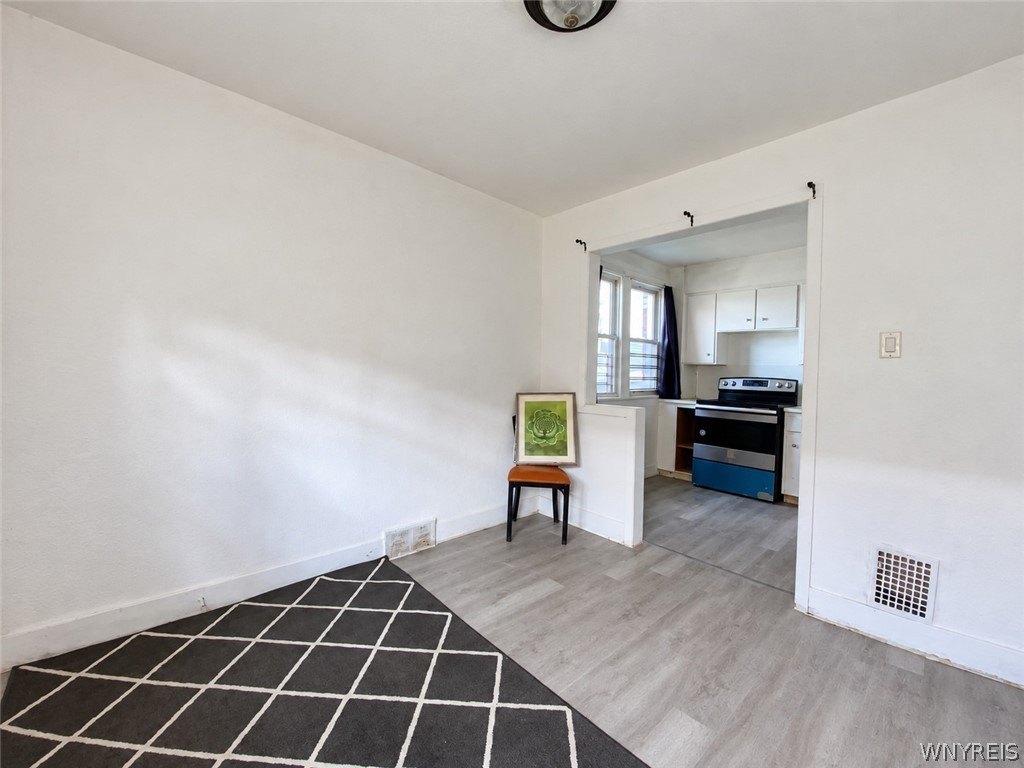
Laminate, Varies, Vinyl, Carpet
Building materials
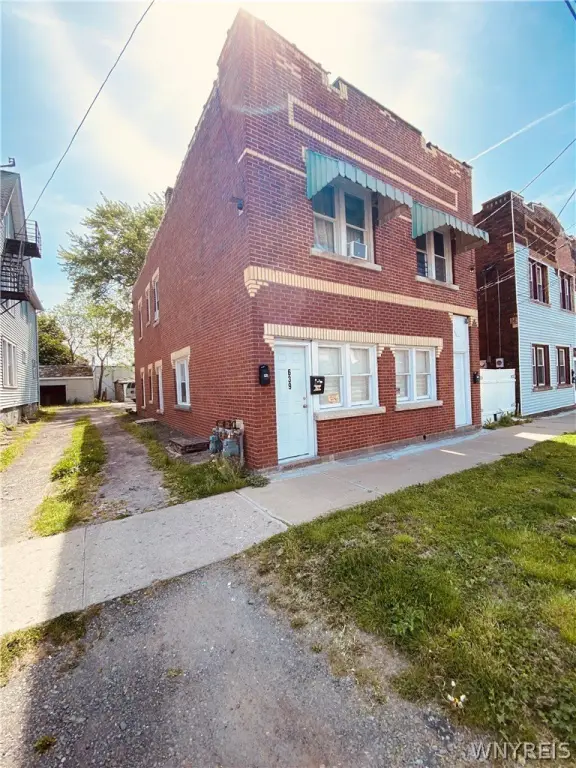
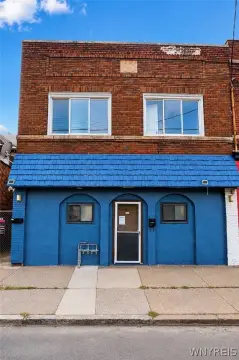
Brick
Roof type
Flat
Architectural style
Other
Listing Agency:
Keller Williams Realty WNY
(716) 832-3300
Listed By:
Tyrone DiMatteo · License #10401286049
(716) 578-7625
Added: May 29
Changed: Oct 12
Last Checked: Oct 16 at 6:06PM
MLS# B1685717
Copyright © 2026 New York State Alliance of MLSs, LLC. All rights reserved. All information provided by the listing agent/broker is deemed reliable but is not guaranteed and should be independently verified.

Ask AI about this property
Review the available facts, identify missing information and prepare questions for the agent.
Investment Insights
Based on property information with market context.
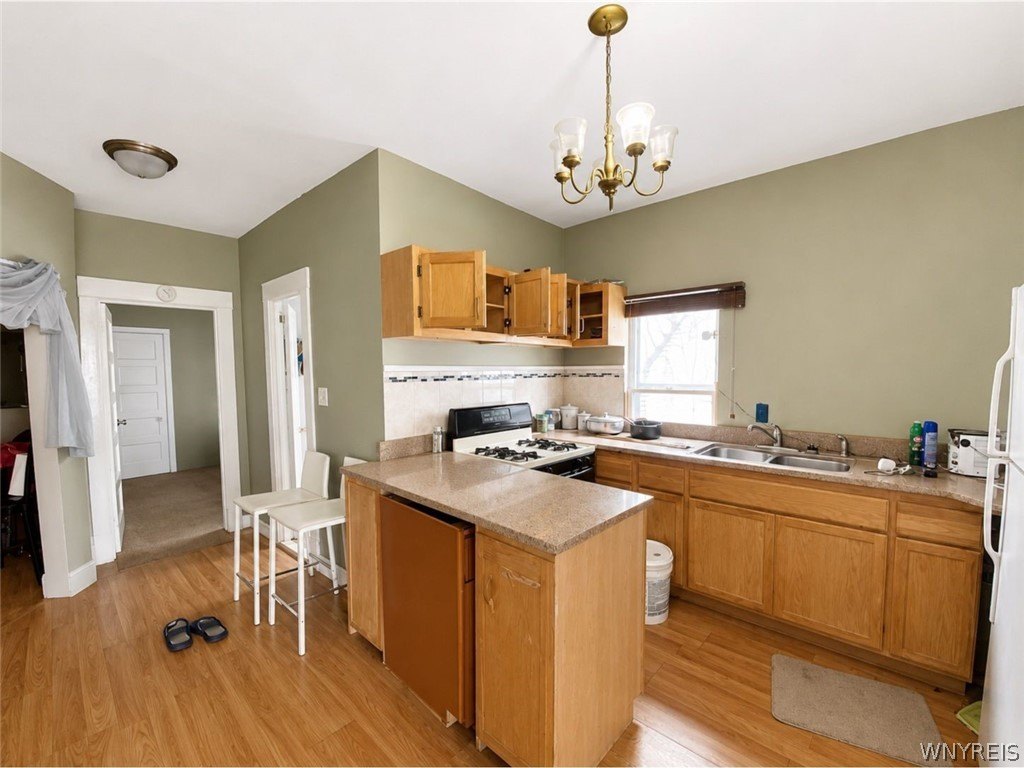
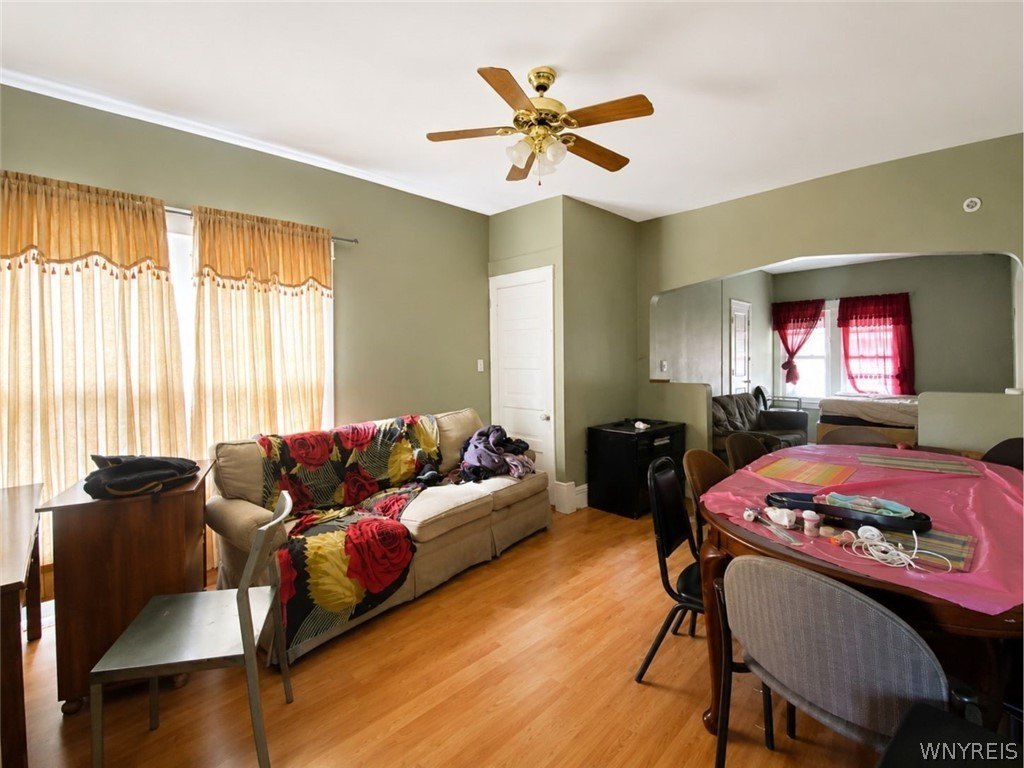
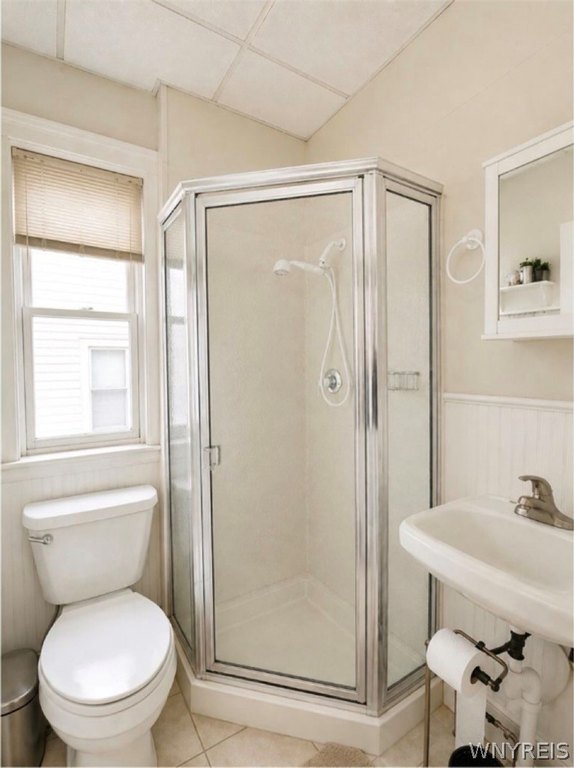
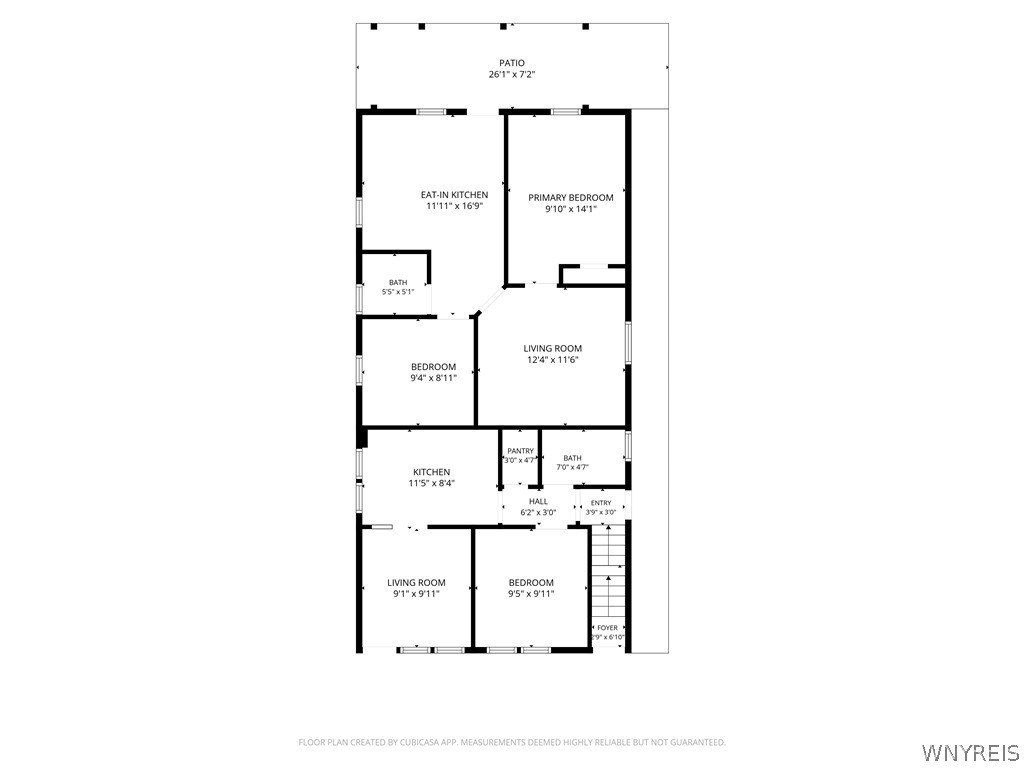
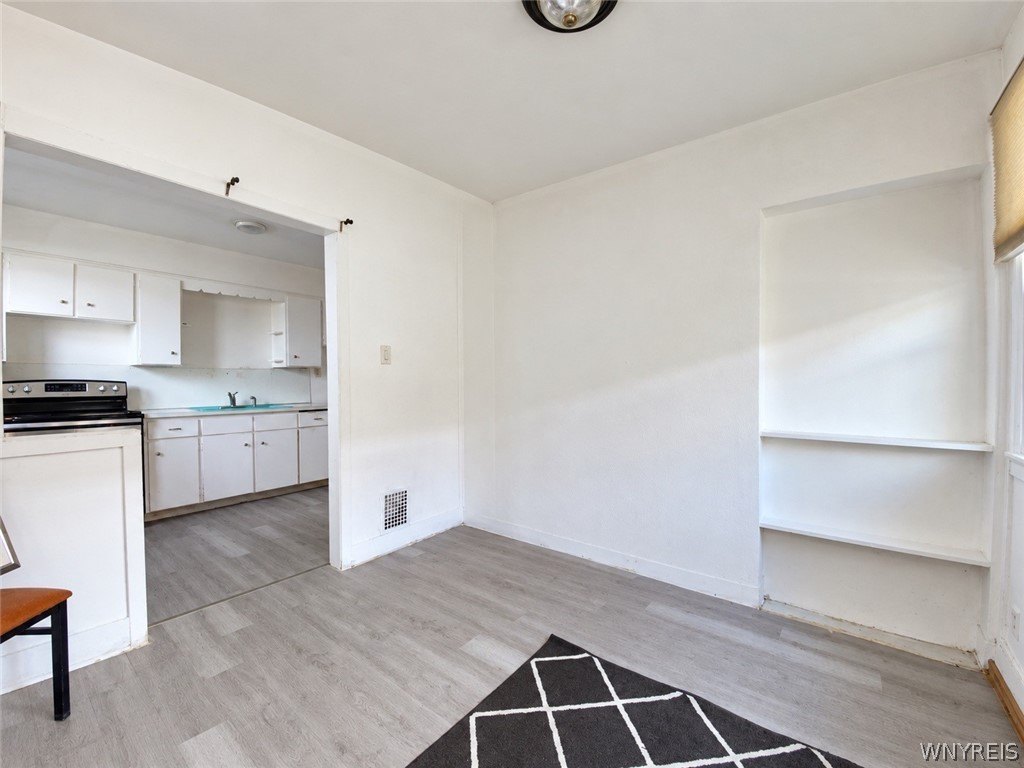
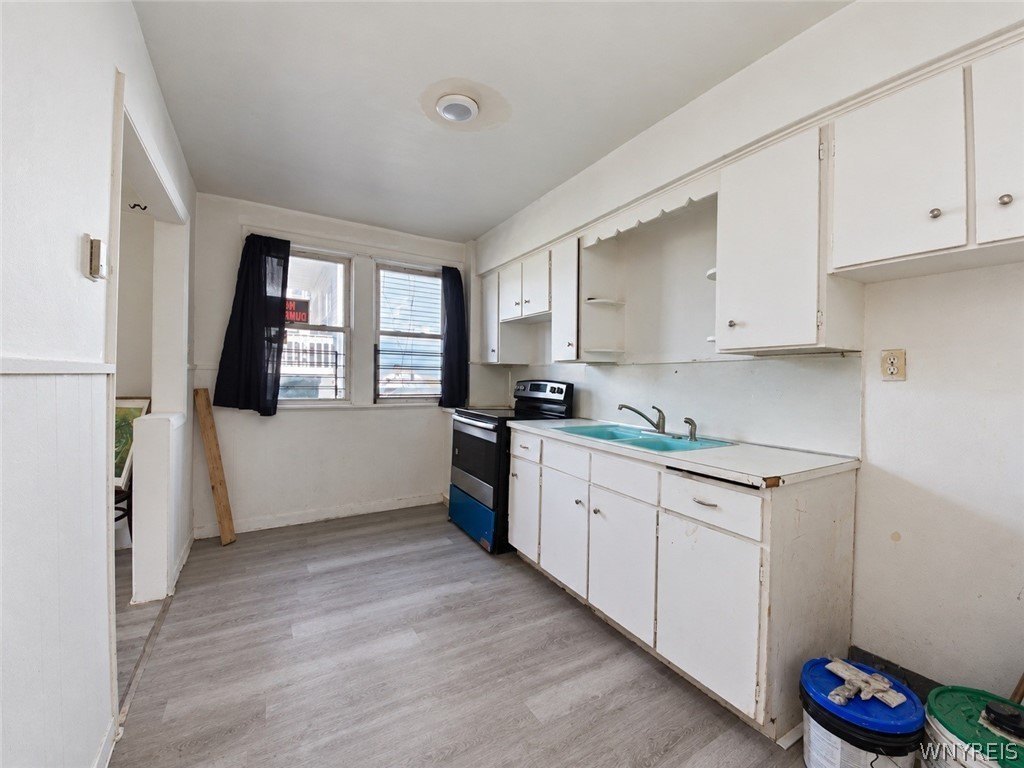
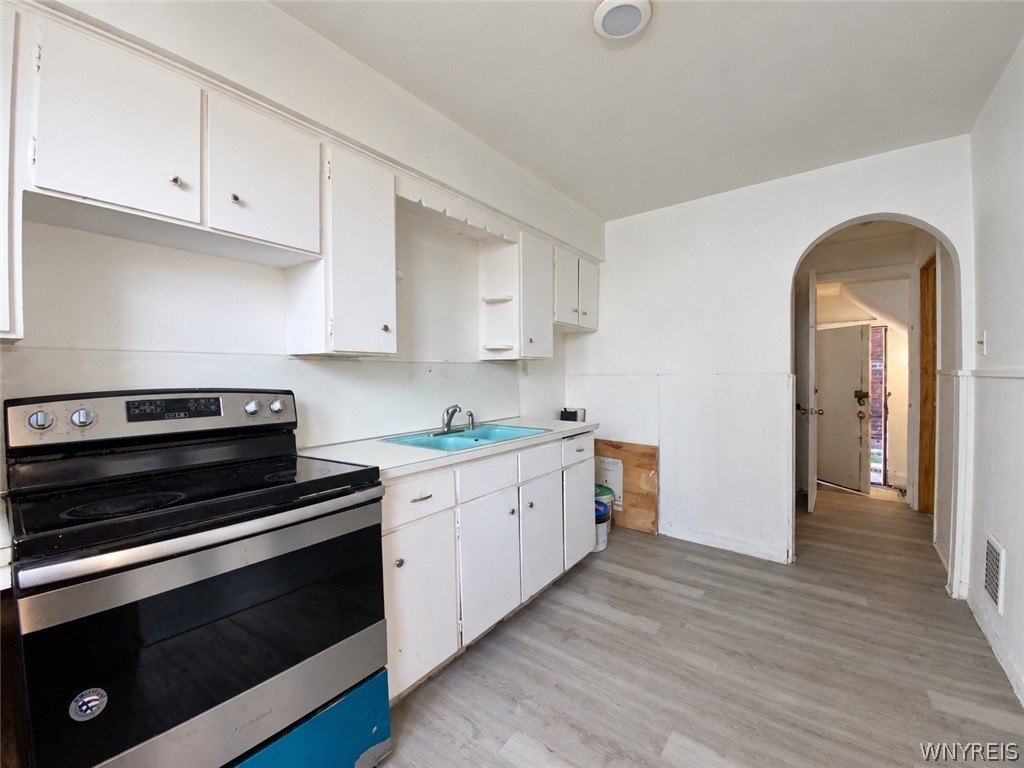
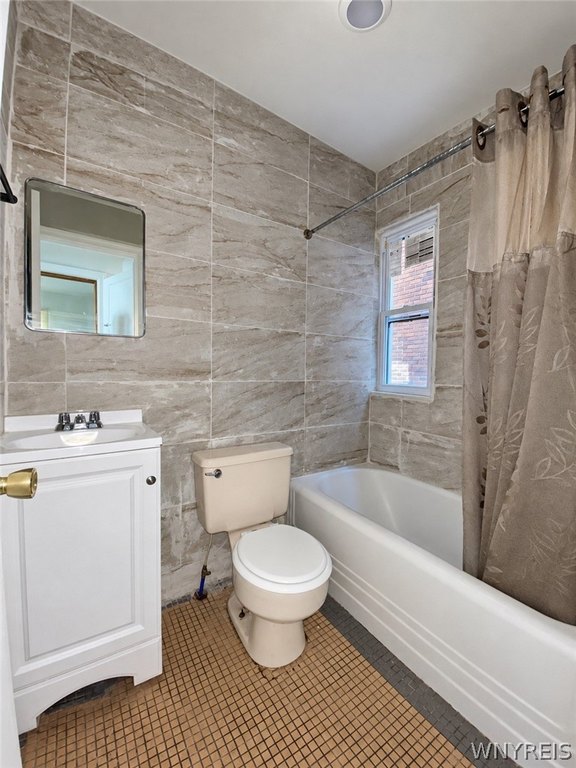
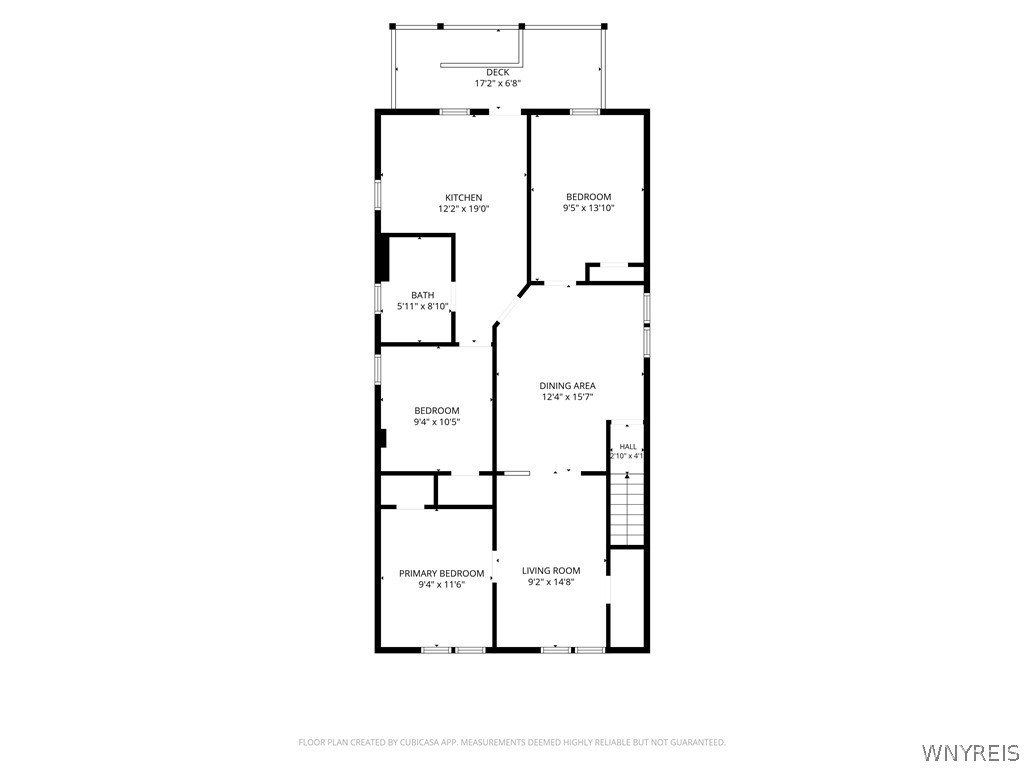
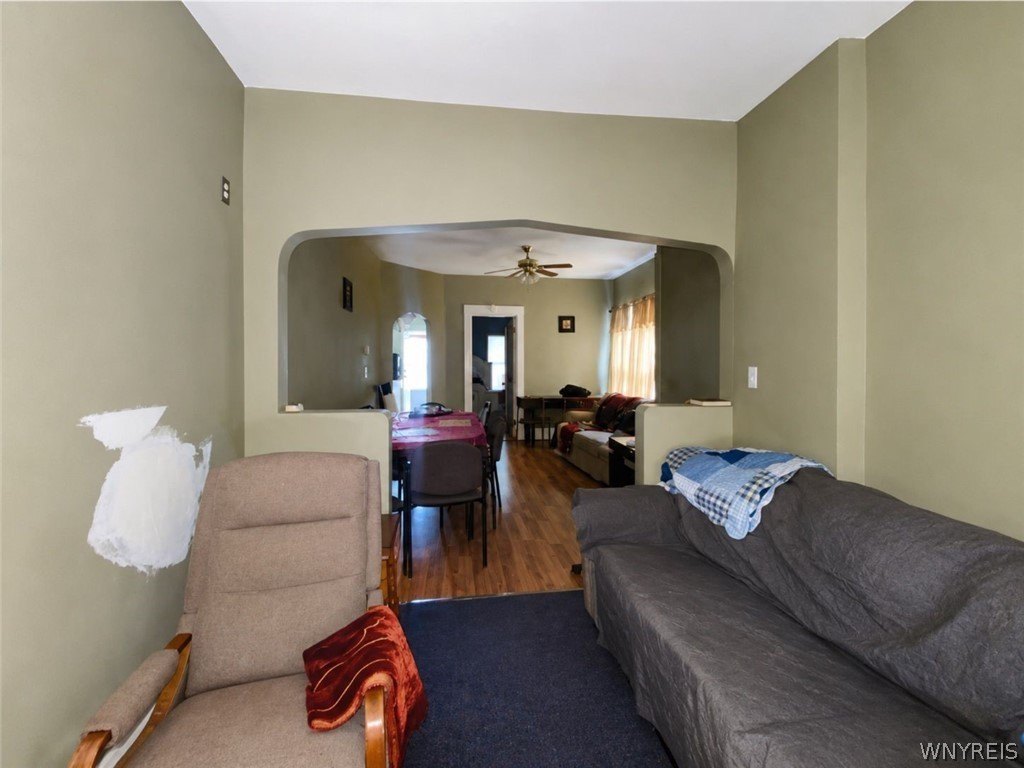
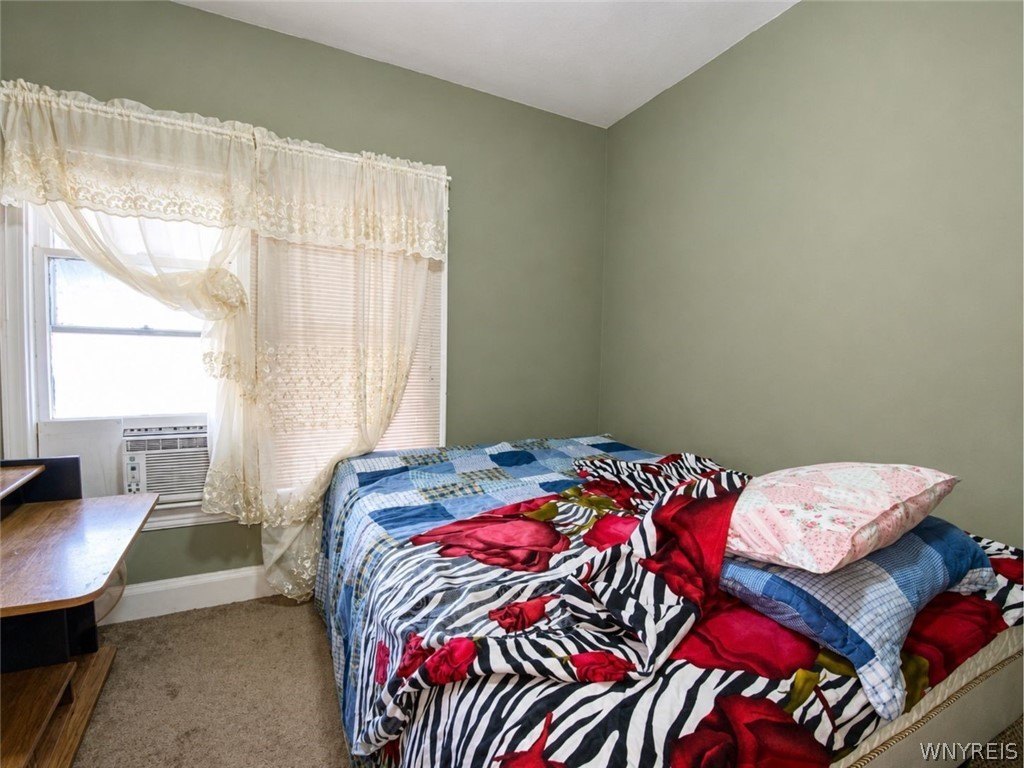
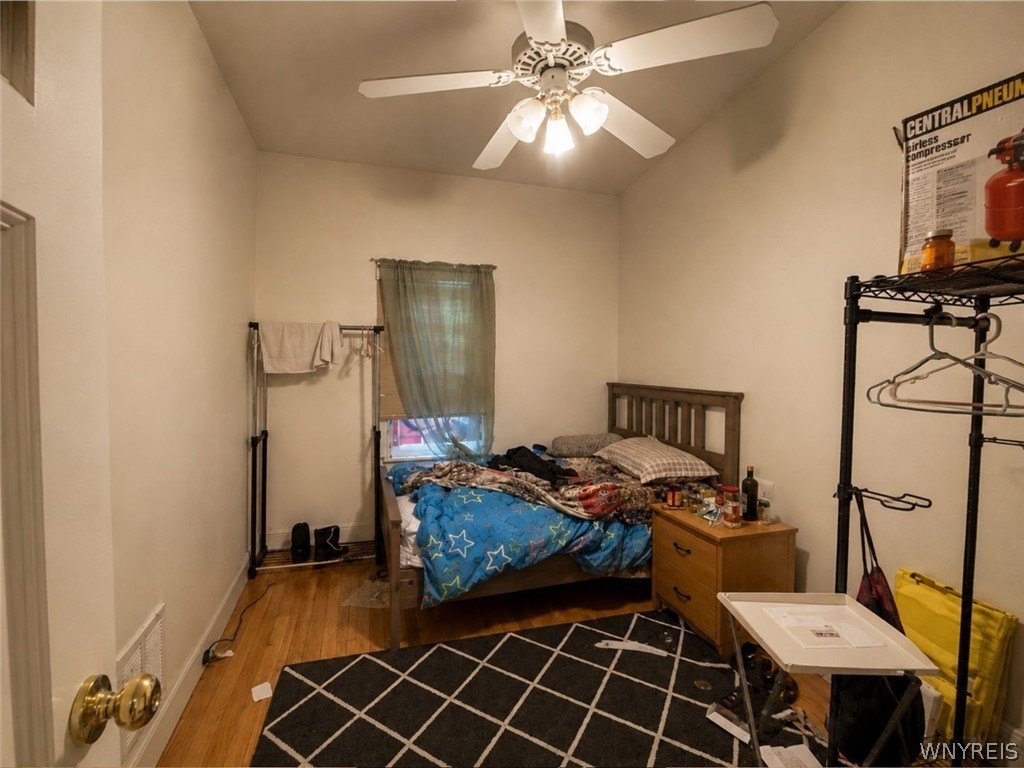
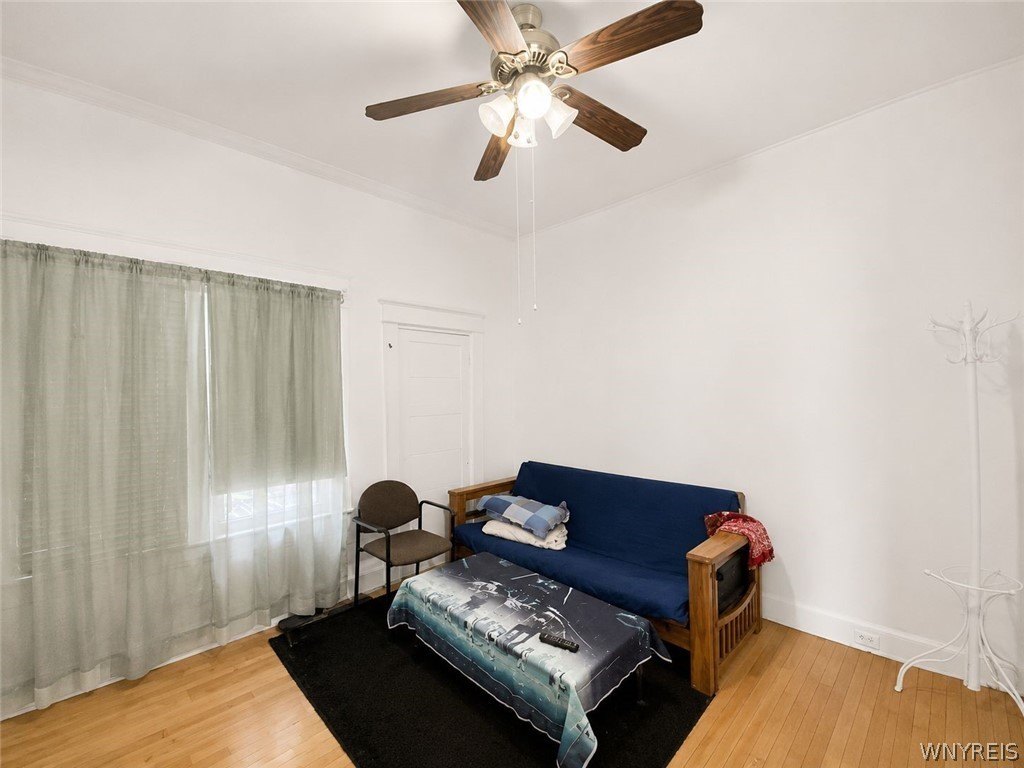
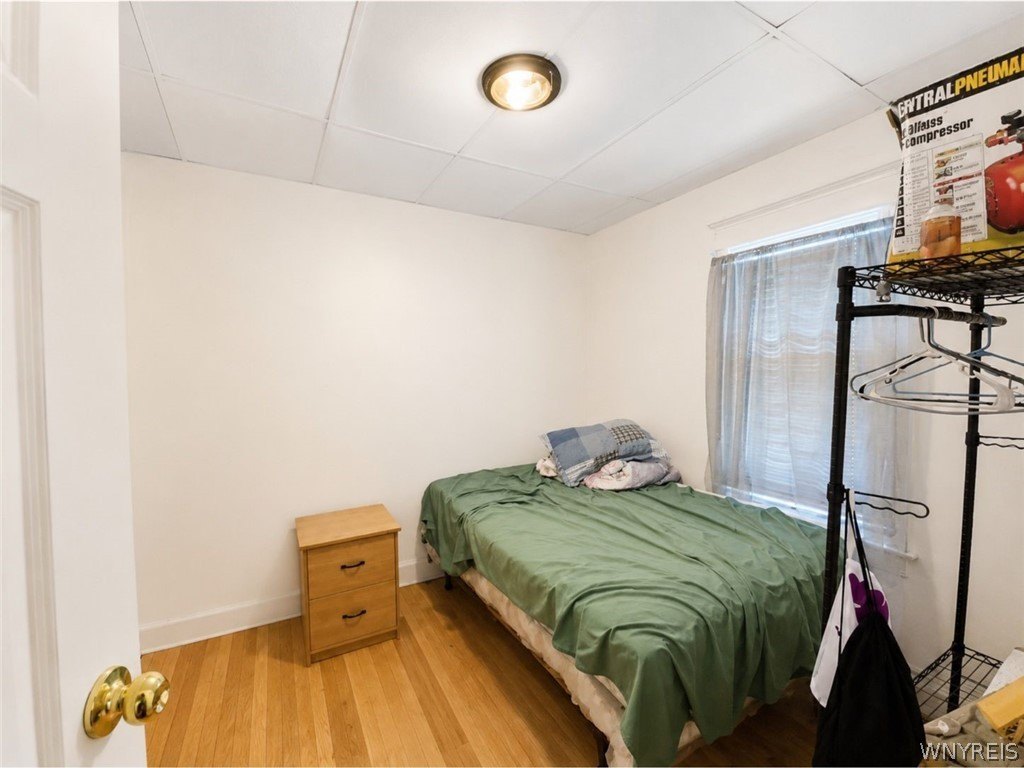
Located at 639 18th Street in Niagara Falls, this 2,304-square-foot triplex was built in 1920 with brick construction and a flat roof. The property contains three separate apartments: one one-bedroom unit, one two-bedroom unit, and one three-bedroom unit. Interior features include high ceilings, large windows, hardwood or laminate flooring in some areas, and a mix of updated kitchens and bathrooms.
Each apartment has separate gas and electric service, an individual heating system, and its own hot water tank. The property also includes a full basement with laundry hookups, a garage, off-street parking, covered porch space, patio areas, and fencing. Public water serves the building. Pine Avenue shops and restaurants, schools, parks, public transportation, downtown Niagara Falls, the Niagara Gorge, and area attractions are nearby.
Each apartment has separate gas and electric service, an individual heating system, and its own hot water tank. The property also includes a full basement with laundry hookups, a garage, off-street parking, covered porch space, patio areas, and fencing. Public water serves the building. Pine Avenue shops and restaurants, schools, parks, public transportation, downtown Niagara Falls, the Niagara Gorge, and area attractions are nearby.
Key Highlights
- 2,304‑square‑foot triplex with three separate apartments
- Unit mix includes 1‑bedroom, 2‑bedroom, and 3‑bedroom apartments
- Separate gas and electric service, heating systems, and hot water tanks
Property Analytics
Unlock full access to Insights
Subscribe to Realmo Intelligence
Open Analytics
Current Use
Lease Details
3
Residential units
Yes
Utilities to site
Location Intelligence
Trade Area within ½ mile
1,066
Businesses Nearby
Explore this area
Business Placement
Demographics for 14301, NY
12,618
Population
7,285
Households
1.7
Avg Household Size
38
Median Age
18%
College-Educated
85%
High-School Grad
2.1 sq mi
ZIP Area
6,009
Density / Sq Mi
$37,650
Median Household Income
$32,909
Median Earnings
$722
Median Rent
$79,200
Median Home Value
Check the figures for this property
Cap Rate, Value Estimation, Potential NOI and more
View Realmo Analytics
Market
Vacancy Rate% for Multifamily in Northeast region




Frequently Asked Questions
What type of property is this?
Triplex - Three-apartment residential income property with off-street parking, separate utilities, and basement laundry hookups.
Where is this triplex located?
The property is located at 639 18th Street Niagara Falls, NY.
What is the asking price?
The asking price for this property is $195,000.
What are key features of this property?
This property features: 2,304‑square‑foot triplex with three separate apartments; Unit mix includes 1‑bedroom, 2‑bedroom, and 3‑bedroom apartments; Separate gas and electric service, heating systems, and hot water tanks


