2-Bedroom Residential Income
For Sale
$449,000
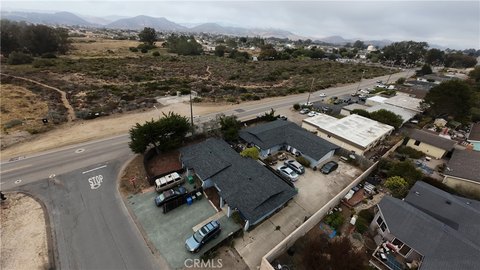
633 Ramona Avenue 31, Los Osos, CA 93402
Home with bright living areas, cathedral ceilings, stainless appliances, a den, and an adjoining sunroom.
Property Size1,440 SF
Price / SF$311.81
Days on Market48
Property Features for 633 Ramona Avenue 31
General Information
Standard status
Active
Size
1,440 SF
Property subtype
Manufactured In Park
Listing Agency:
LPT Realty, Inc
(877) 366-2213
Listed By:
Richard Margetson
(805) 528-5800
Source:
Realtyrightchoice
Added: Aug 30
Changed: Oct 6
Last Checked: Oct 14 at 10:36PM
Displayed information is deemed reliable but is not guaranteed and should be independently verified. All listing content including descriptions, pricing, images are the copyrighted material of LPT Realty, Inc

Ask AI about this property
Review the available facts, identify missing information and prepare questions for the agent.
Investment Insights
Based on property information with market context.
This 1,440-square-foot residence at Morro Shores includes 2 bedrooms and 2 baths. The living room receives natural light through three large windows and features cathedral ceilings. A spacious kitchen offers stainless appliances and a pantry, while the den includes a fireplace and built-in cabinetry. The den opens to a sunroom that connects with the outdoor side patio. Both bedrooms provide closet space, and the primary bath includes a linen closet and double-sink vanity.
The property is located at 633 Ramona Avenue, 31, in Los Osos, California. It is within walking distance of the Monday Farmer’s Market in Baywood, Sweet Springs Nature Preserve, and Sea Pines concerts on the green.
The property is located at 633 Ramona Avenue, 31, in Los Osos, California. It is within walking distance of the Monday Farmer’s Market in Baywood, Sweet Springs Nature Preserve, and Sea Pines concerts on the green.
Key Highlights
- 2 bedroom, 2 bath home at Morro Shores
- 1,440 square feet of interior space
- Living room with 3 large windows and cathedral ceilings
Financial Insights
Estimated NOI and Cap Rate
NOI / Yr
$27,799
Cap Rate
6.19%
Suggested Prices Based on Cap Rates
Cap Rate 5%
$555,980
$556.0K
Cap Rate 7%
$397,129
$397.1K
Cap Rate 9%
$308,878
$308.9K
Market Conditions
NOI Build-Up for 1,440 SF
Gross rent
$51.8K $36.00/SF
− Vacancy
−$1.3K −$0.90/SF
EGI
$50.5K $35.10/SF
− OpEx
−$22.7K −$15.80/SF
NOI
$27.8K $19.31/SF
Area
San Luis Obispo County, CA
Vacancy
2.50%
Lease Rate
$36.00 /SF/Yr
Expense Ratio
45.00%
Simulate Cap Rate and NOI
Suggested Prices Based on Cap Rates
Cap Rate 5%
$555,980
Cap Rate 7%
$397,129
Cap Rate 9%
$308,878
Alternative Uses
Best Use
Apartment 5plus
$397.1K
$347.5K – $463.3K
NOI $27,799 @ 7.0% cap · market cap 6.19%
Second Best
—
—
no second resolved use
Theoretical Best
Healthcare Medical
$566.3K
$495.5K – $660.7K
NOI $39,643 @ 7.0% cap · market cap 8.83%
Zoning and permitted uses should be independently verified with authorities.
How Realmo checks its estimates
Property Analytics
Unlock full access to Insights
Subscribe to Realmo Intelligence
Open Analytics
Current Use
Location Intelligence
Trade Area within ½ mile
490
Businesses Nearby
Explore this area
Business Placement
Demographics for 93402, CA
14,500
Population
6,586
Households
2.2
Avg Household Size
49
Median Age
50%
College-Educated
94%
High-School Grad
27.7 sq mi
ZIP Area
523
Density / Sq Mi
$103,839
Median Household Income
$43,002
Median Earnings
$1,909
Median Rent
$729,200
Median Home Value
Check the figures for this property
Cap Rate, Value Estimation, Potential NOI and more
View Realmo Analytics



Frequently Asked Questions
What type of property is this?
Residential income property - Home with bright living areas, cathedral ceilings, stainless appliances, a den, and an adjoining sunroom.
Where is this residential income property located?
The property is located at 633 Ramona Avenue 31 Los Osos, CA.
What is the asking price?
The asking price for this property is $449,000.
What are key features of this property?
This property features: 2 bedroom, 2 bath home at Morro Shores; 1,440 square feet of interior space; Living room with 3 large windows and cathedral ceilings


