Tudor-Style Office
For Sale
$214,900
629 N Jefferson Street, Jackson, MS 39202
Commercial Sale, Jackson, MS
Property Size1,843 SF
Lot Size0.15 Acres
Price / SF$116.60
Days on Market250
Property Features for 629 N Jefferson Street
General Information
Property type
Commercial Sale
Property subtype
Office
Zoning description
C1
Subdivision
Metes And Bounds
Directions
I-55 north from I-20 to High Street exit 96A towards Mississippi Fairgrounds. Continue on High Street to R. onto Jefferson Street. Property on L.
Standard status
Active
APN
24-14, 24-15
Size
1,843 SF
Lot size
0.15 Acres
Taxes and HOA fees
Tax Year
2025
Tax Description
40 FT W/S N JEFFERSON ST X 157 1/2 FT E & W IN SE COR LESS 10 FT OFF E/S FOR ST 2 A LOT 9 N J
Tax Annual Amount
1844
Legal Description
40 FT W/S N JEFFERSON ST X 157 1/2 FT E & W IN SE COR LESS 10 FT OFF E/S FOR ST 2 A LOT 9 N J
Building Details
Year built
1950
Listing Agency:
Overby, Inc.
(601) 366-8511
Listed By:
Amanda P Overby · License #B19487
(601) 624-4611
Added: Feb 7
Changed: Oct 8
Last Checked: Oct 15 at 6:06PM
MLS# 4138510
Copyright © 2026 MLS United. All rights reserved. All information provided by the listing agent/broker is deemed reliable but is not guaranteed and should be independently verified.

Ask AI about this property
Review the available facts, identify missing information and prepare questions for the agent.
Investment Insights
Based on property information with market context.
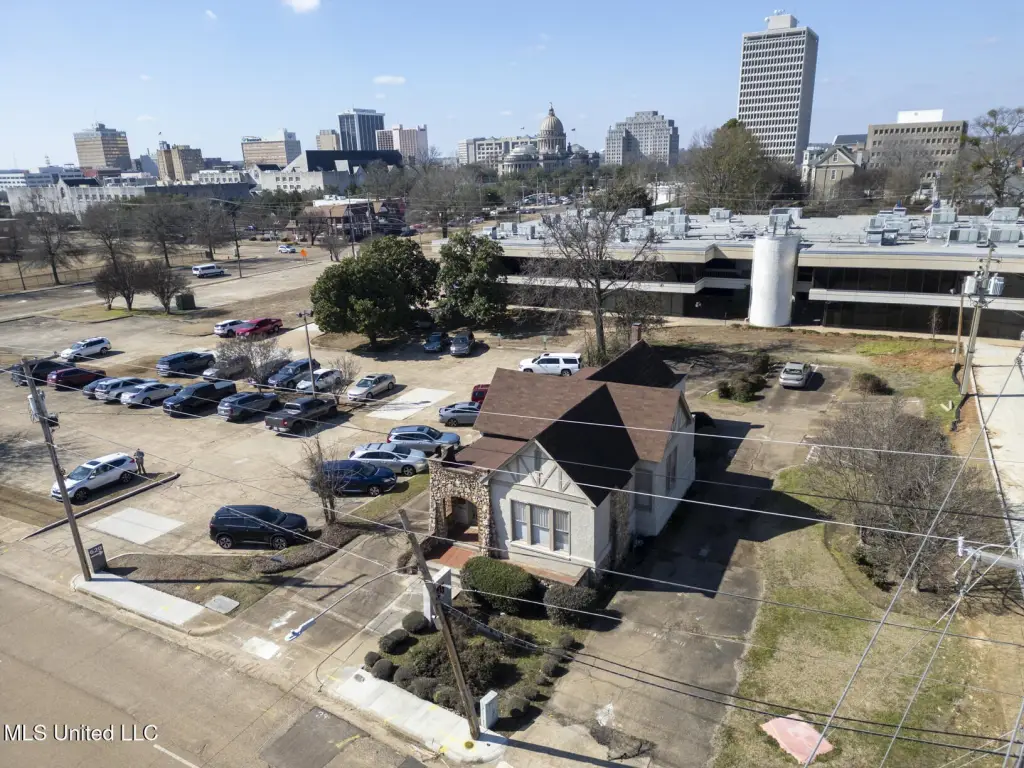
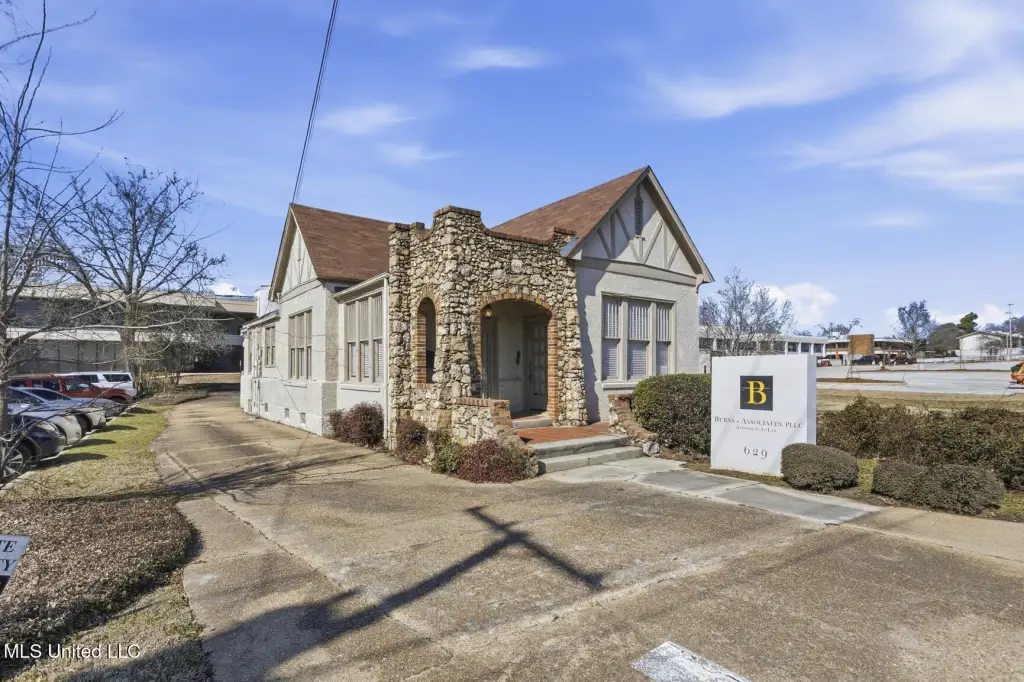
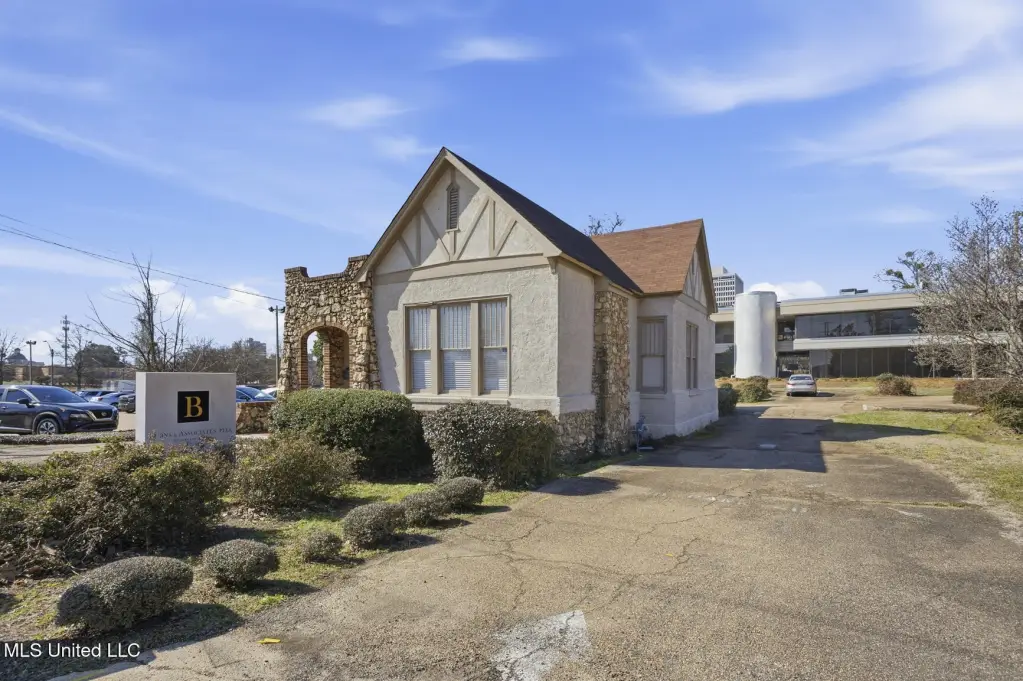
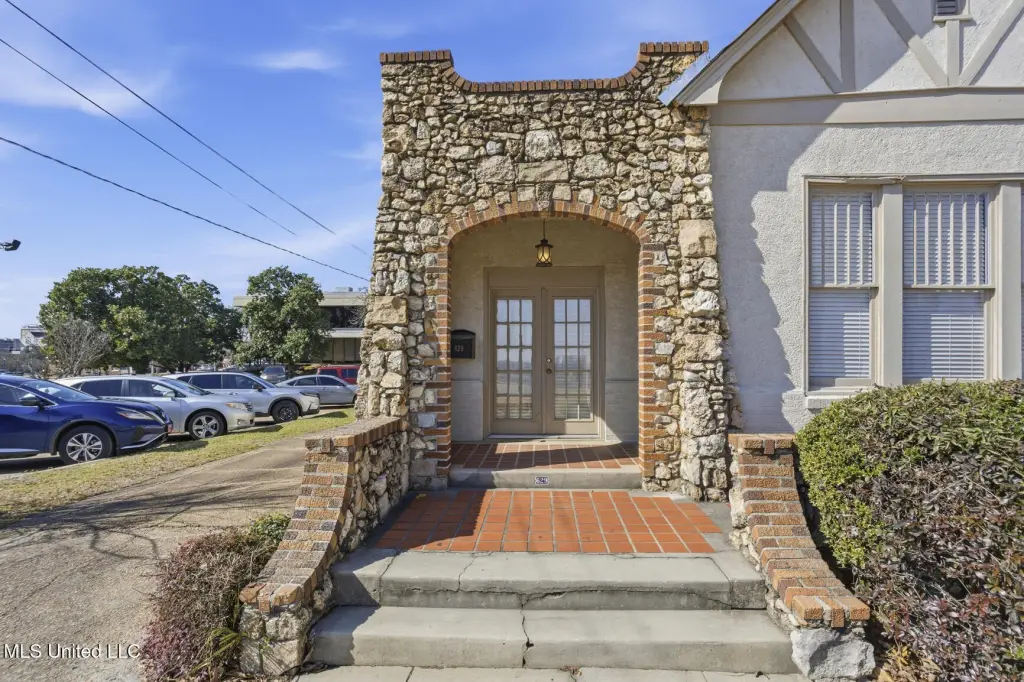
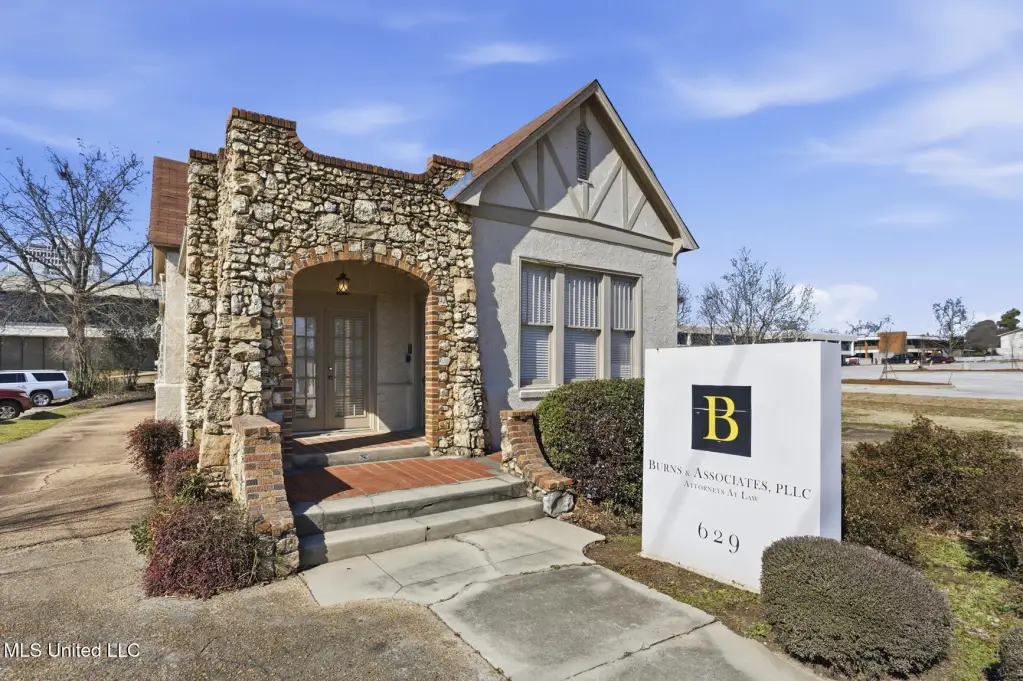
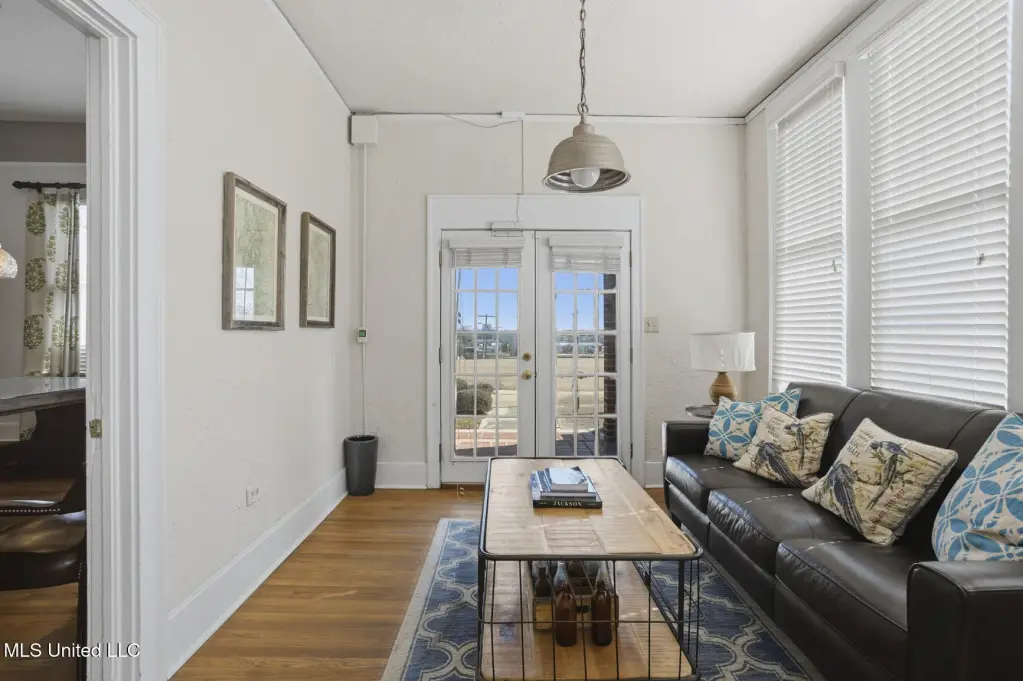
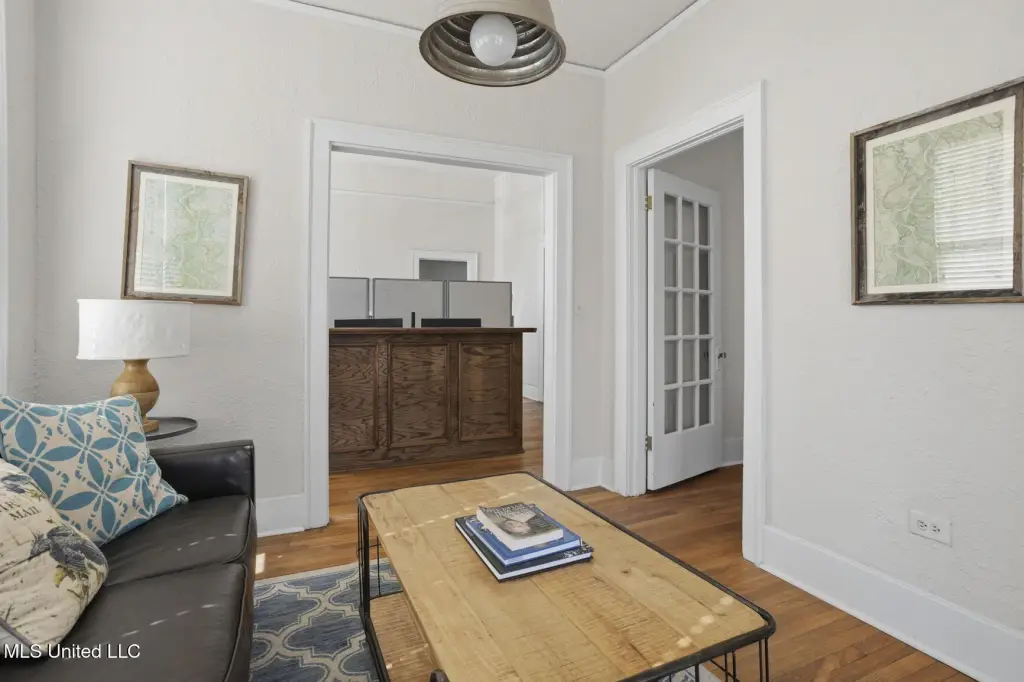
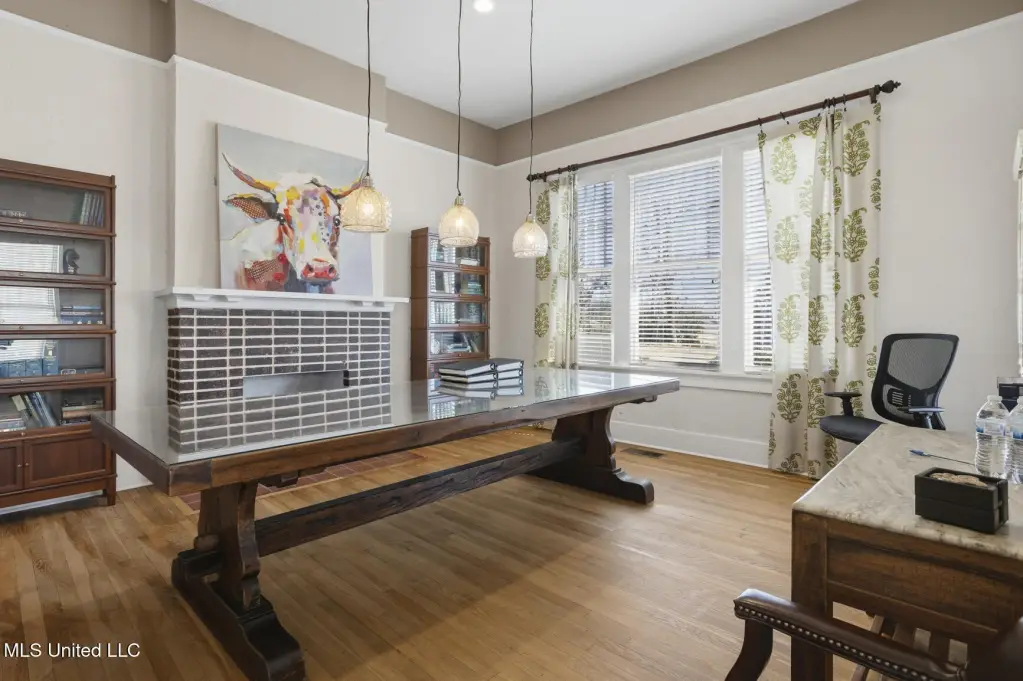
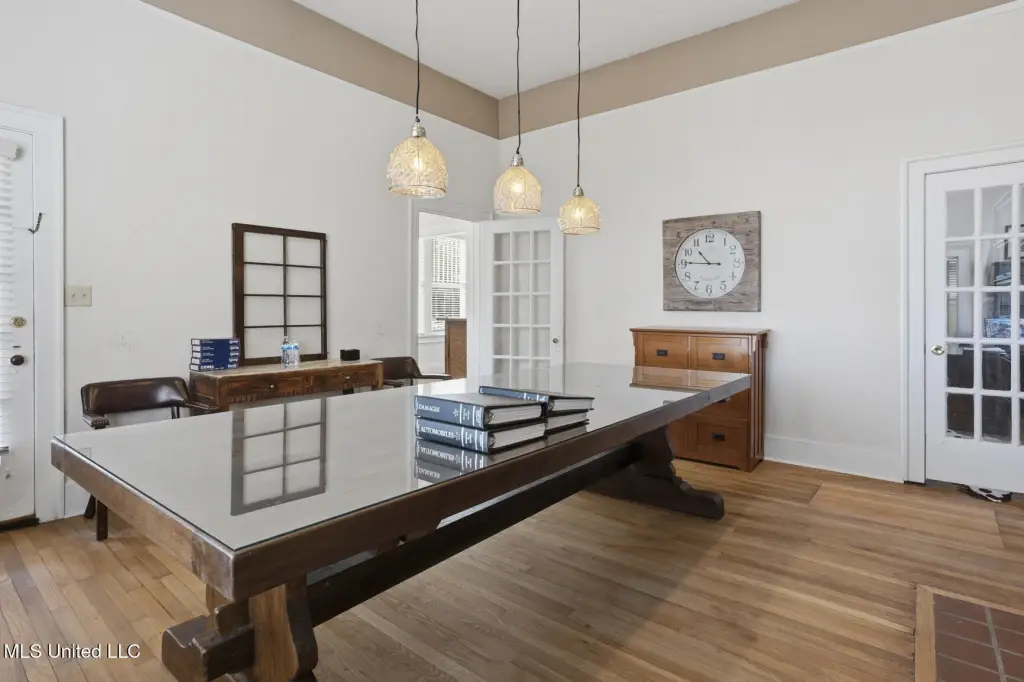
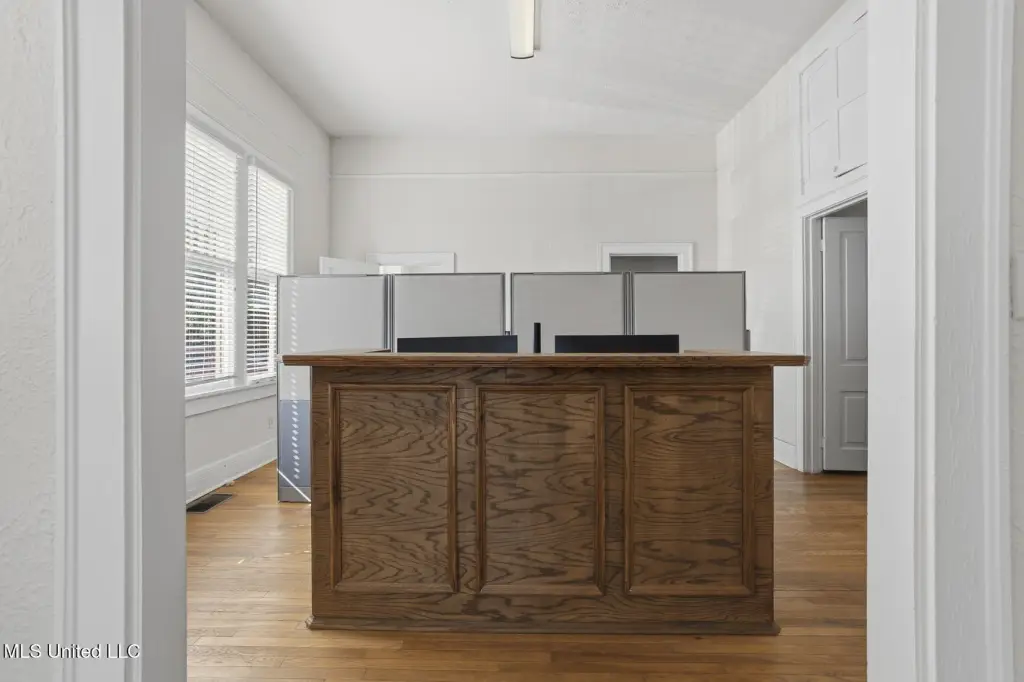
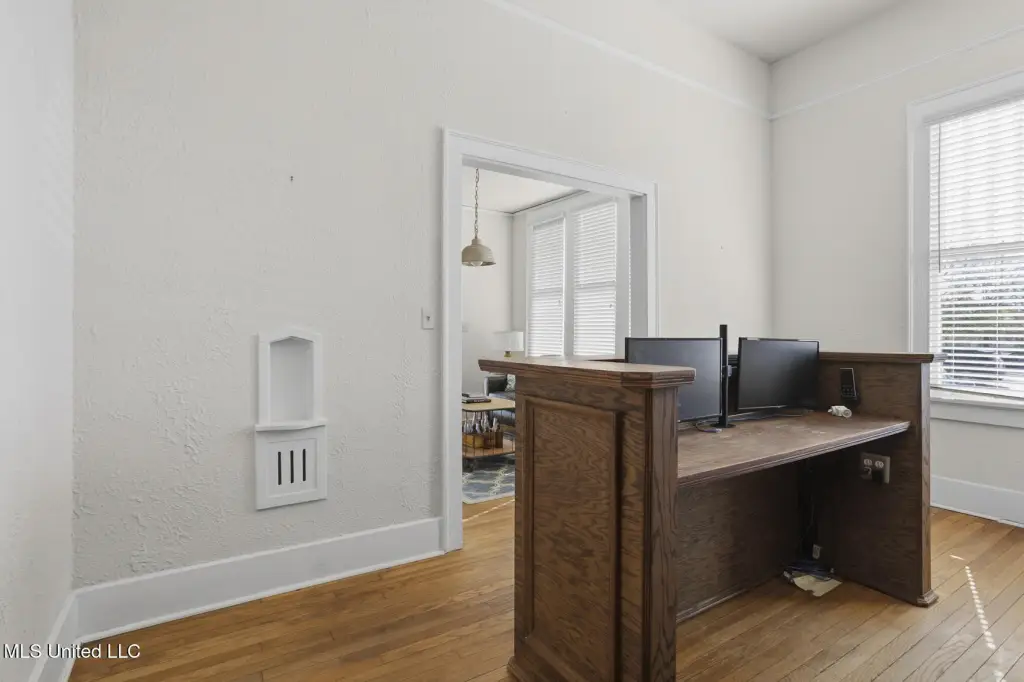
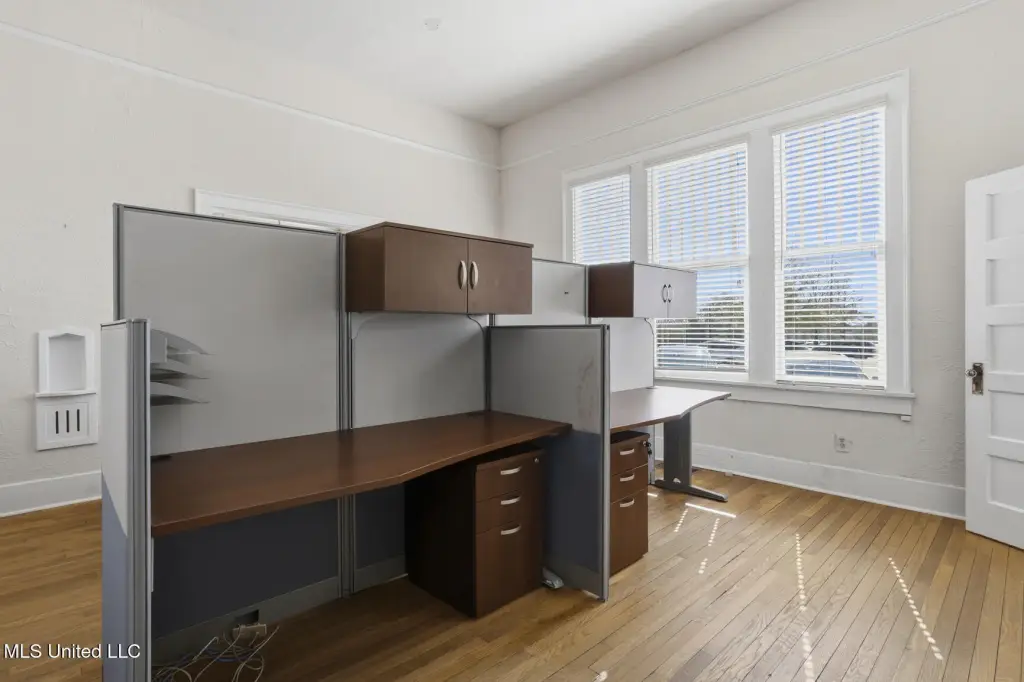
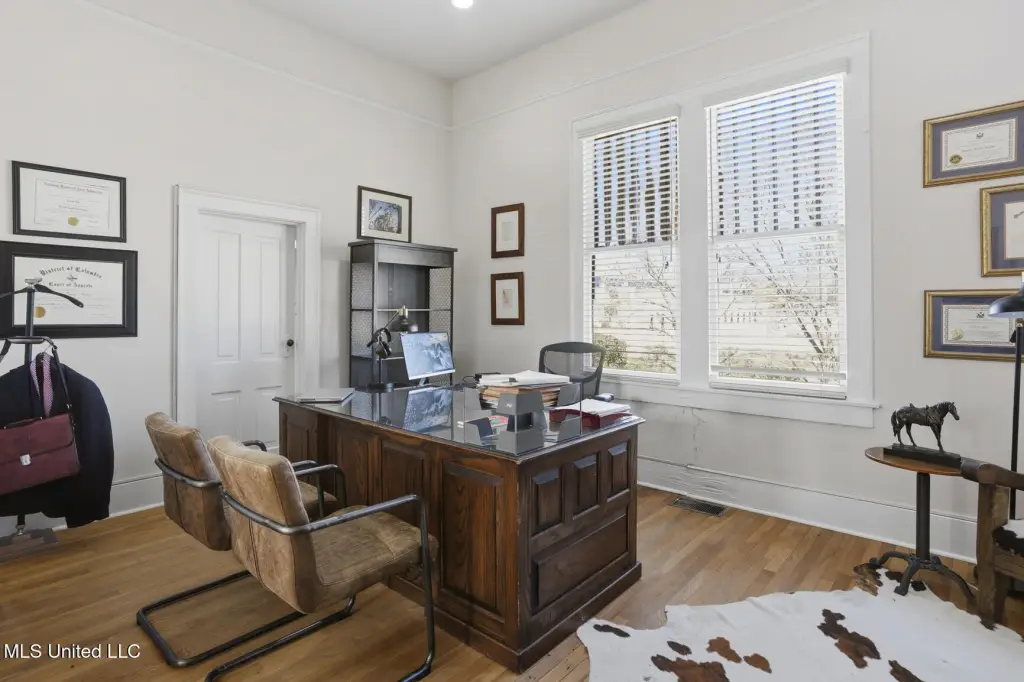
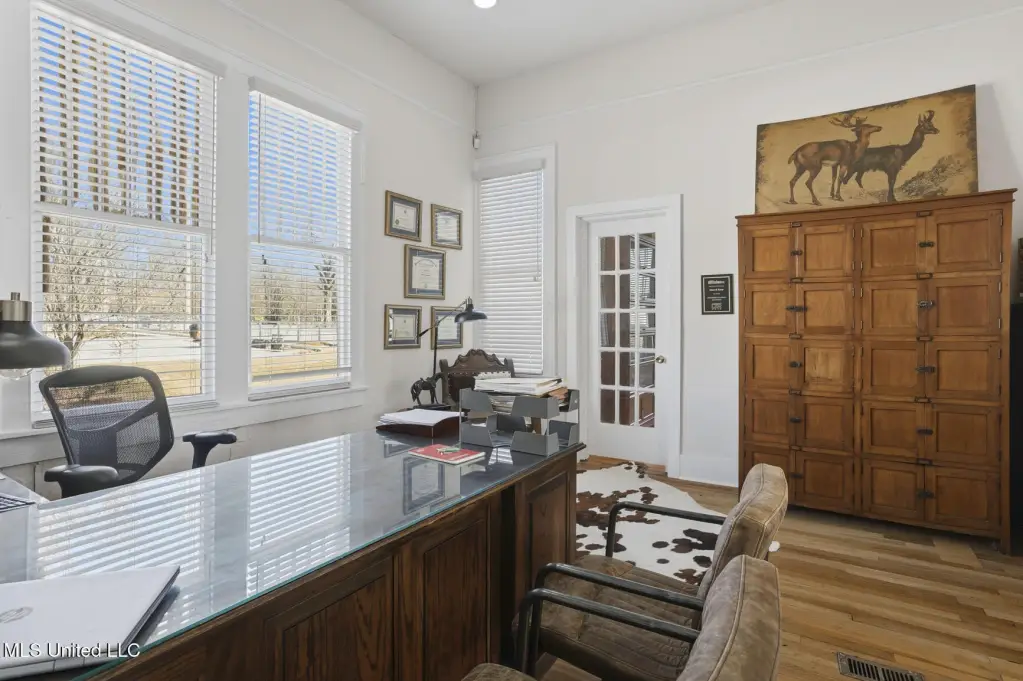
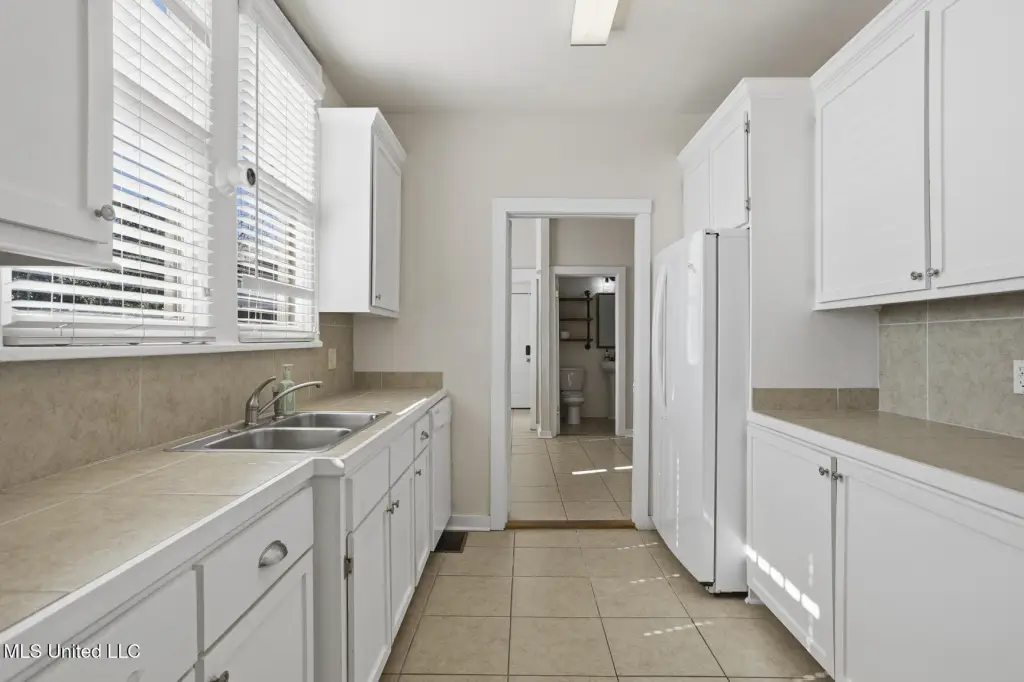
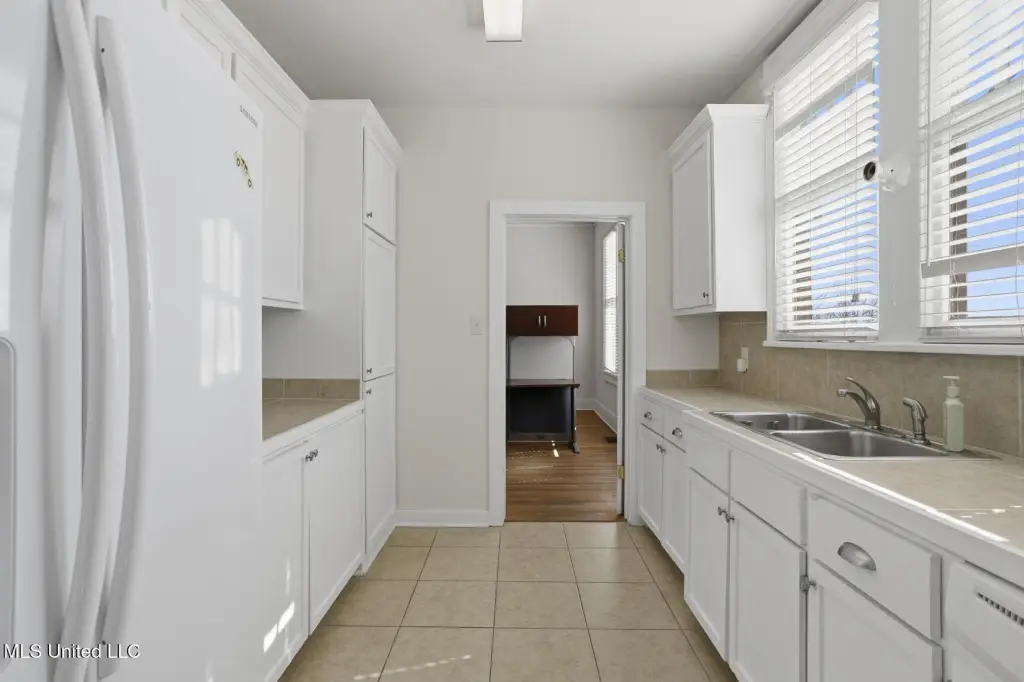
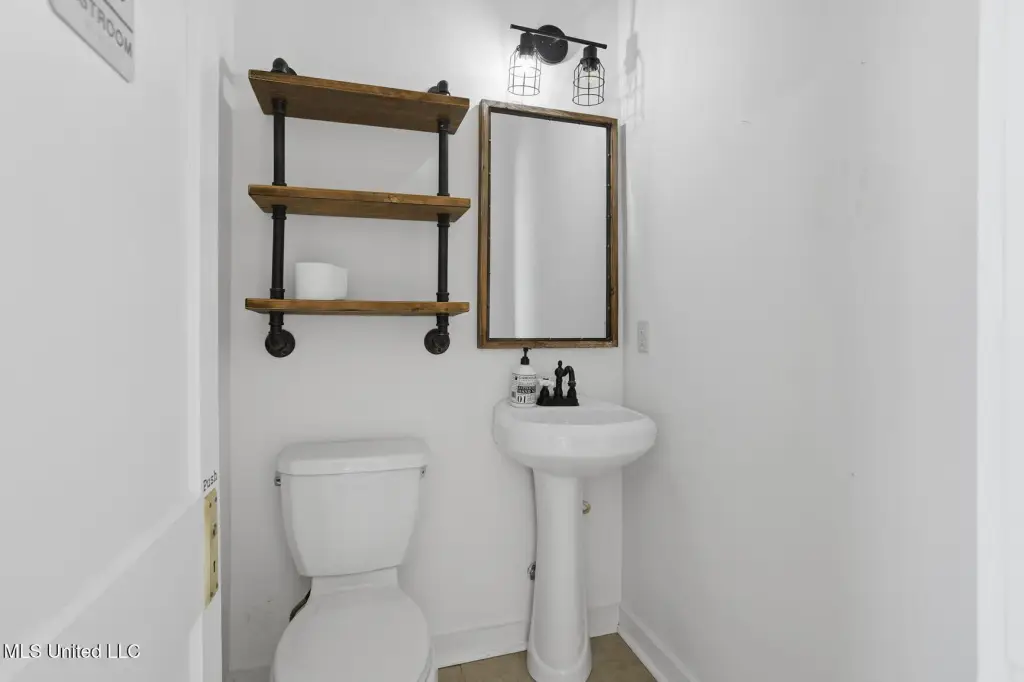
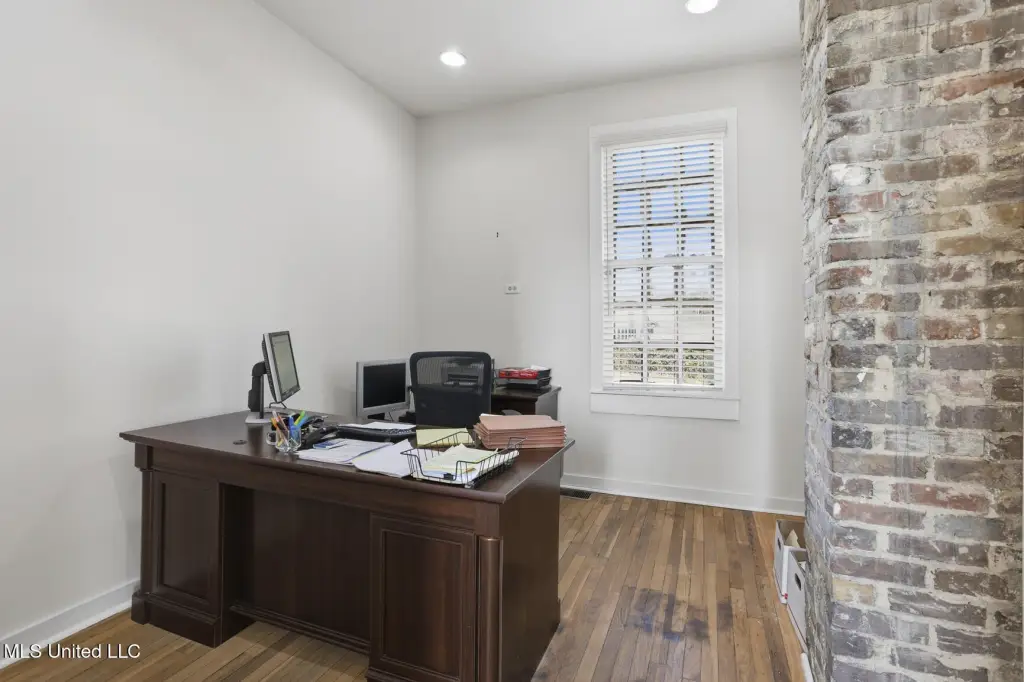
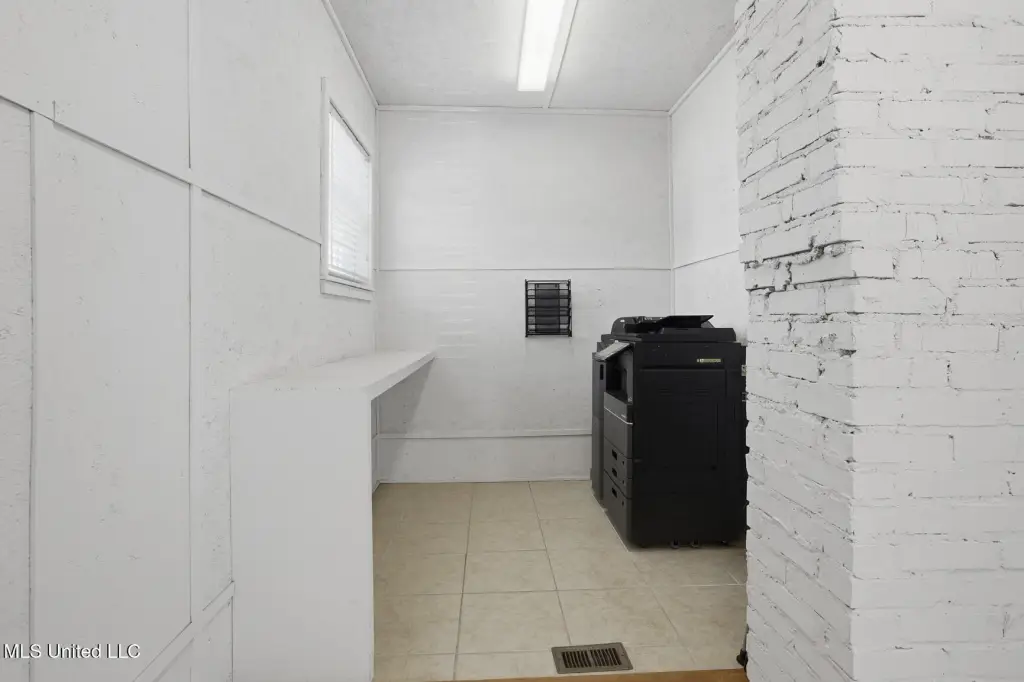
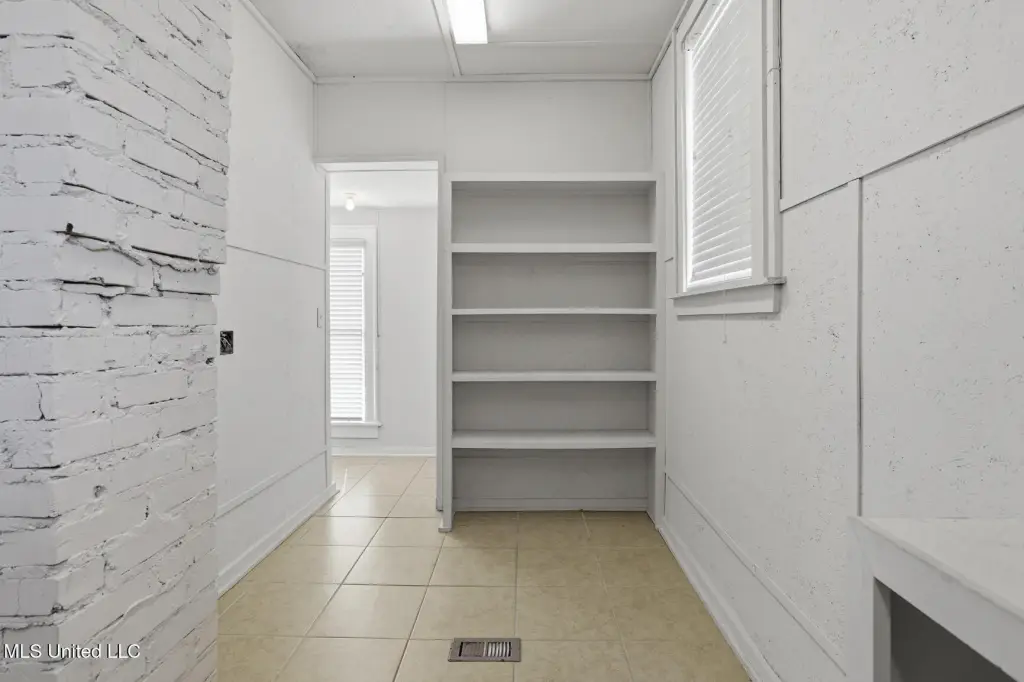
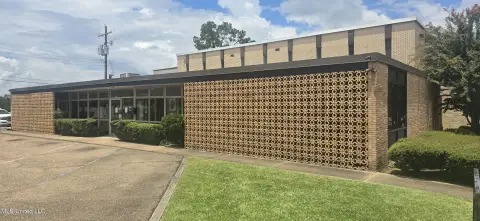
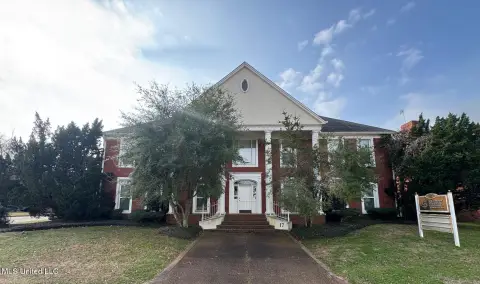
This 1,843-square-foot office property was built in 1950 and presents a Tudor-style exterior with a distinct standalone presence. Inside, the traditional arrangement includes multiple private offices, a reception area, and supporting spaces suited to a professional office operation.
The property is at 629 N Jefferson Street in Jackson, with access to High Street and I-55. Its position places the building between the State Capitol and the Belhaven and Fondren districts, with connections to North Jackson. Off-street parking is also provided.
The property is at 629 N Jefferson Street in Jackson, with access to High Street and I-55. Its position places the building between the State Capitol and the Belhaven and Fondren districts, with connections to North Jackson. Off-street parking is also provided.
Key Highlights
- 1,843‑square‑foot office building constructed in 1950
- Tudor‑style exterior at 629 N Jefferson Street, Jackson, MS 39202
- Multiple private offices plus reception and support areas
Financial Insights
Estimated NOI and Cap Rate
NOI / Yr
$17,224
Cap Rate
8.01%
Suggested Prices Based on Cap Rates
Cap Rate 5%
$344,480
$344.5K
Cap Rate 7%
$246,057
$246.1K
Cap Rate 9%
$191,378
$191.4K
Market Conditions
NOI Build-Up for 1,843 SF
Gross rent
$26.1K $14.16/SF
− Vacancy
−$3.1K −$1.70/SF
EGI
$23.0K $12.46/SF
− OpEx
−$5.7K −$3.12/SF
NOI
$17.2K $9.35/SF
Area
Jackson, MS
Vacancy
12.00%
Lease Rate
$14.16 /SF/Yr
Expense Ratio
25.00%
Simulate Cap Rate and NOI
Suggested Prices Based on Cap Rates
Cap Rate 5%
$344,480
Cap Rate 7%
$246,057
Cap Rate 9%
$191,378
Alternative Uses
Best Use
Office B
$246.1K
$215.3K – $287.1K
NOI $17,224 @ 7.0% cap · market cap 8.01%
Second Best
—
—
no second resolved use
Theoretical Best
Office A
$315.8K
$276.3K – $368.5K
NOI $22,107 @ 7.0% cap · market cap 10.29%
Zoning and permitted uses should be independently verified with authorities.
How Realmo checks its estimates
Property Analytics
Unlock full access to Insights
Subscribe to Realmo Intelligence
Open Analytics
Current Use
Lease Details
Yes
Highway access
Yes
Paved road access
Location Intelligence
Trade Area within ½ mile
2,591
Businesses Nearby
Explore this area
Business Placement
Demographics for 39202, MS
7,405
Population
4,332
Households
1.7
Avg Household Size
35
Median Age
42%
College-Educated
88%
High-School Grad
3.9 sq mi
ZIP Area
1,899
Density / Sq Mi
$41,250
Median Household Income
$32,111
Median Earnings
$876
Median Rent
$211,300
Median Home Value
Check the figures for this property
Cap Rate, Value Estimation, Potential NOI and more
View Realmo Analytics
Market
Vacancy Rate% for Office in South region







Frequently Asked Questions
What type of property is this?
Office building - Traditional layout with private offices, a reception area, and supporting workspace for professional users.
Where is this office building located?
The property is located at 629 N Jefferson Street Jackson, MS.
What is the asking price?
The asking price for this property is $214,900.
What are key features of this property?
This property features: 1,843‑square‑foot office building constructed in 1950; Tudor‑style exterior at 629 N Jefferson Street, Jackson, MS 39202; Multiple private offices plus reception and support areas


