Mixed-Use Retail and
For Sale
$1,645,000
629-641 Park, Hartford, CT 06106
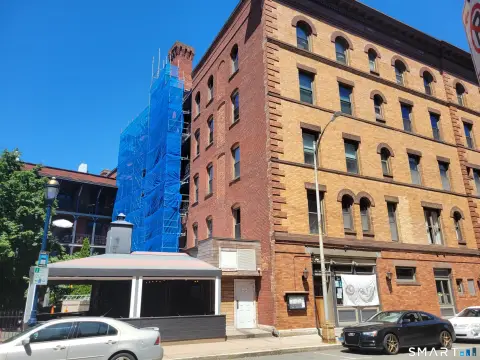
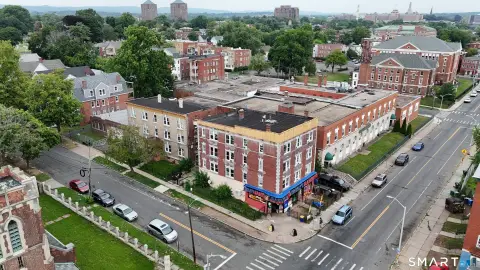
Two adjacent mixed-use buildings include apartments and street-level commercial storefronts plus a dedicated on-site parking lot.
Property Size1,910 SF
Price / SF$139.41
Days on Market96
Property Features for 629-641 Park
General Information
Standard status
Active
Size
1,910 SF
Property subtype
5 Family+
Lease Term
Listing ID: 24193407, Standard Status: Active, MLS Status: Active, Property Subtype: 5 Family+, 94 days on market
Additional Details
Highway Access
Yes
Multifamily Units
8
Building Details
Building Size
1,910 SF
Year Built
1910
Tenancy
Multi
Listing Agency:
Brass Moon Realty
(203) 945-1000
Listed By:
Ben Weinberg · License #RES.0813934
(917) 974-6356
Source:
Iverty
Added: Jul 21
Changed: Oct 23
Last Checked: Oct 23 at 10:36AM
Displayed information is deemed reliable but is not guaranteed and should be independently verified. All listing content including descriptions, pricing, images are the copyrighted material of Brass Moon Realty

Ask AI about this property
Review the available facts, identify missing information and prepare questions for the agent.
Investment Insights
Based on property information with market context.
This for-sale portfolio combines two adjacent mixed-use buildings at 629-633 and 637-641 Park Street. The property provides 11 income-producing units total, including 8 residential apartments and 3 street-level commercial storefronts. A dedicated on-site parking lot is included, supporting both the residential tenants and the commercial operations.
The commercial storefront spaces benefit from visibility and frontage along Park Street. The asset is positioned for convenient access to downtown Hartford, public transportation, I-84, shopping, restaurants, and neighborhood amenities.
Offered as one portfolio, the buildings create a diversified income mix between residential and commercial tenants, with the combined configuration designed to support ongoing cash flow through multiple revenue streams.
The commercial storefront spaces benefit from visibility and frontage along Park Street. The asset is positioned for convenient access to downtown Hartford, public transportation, I-84, shopping, restaurants, and neighborhood amenities.
Offered as one portfolio, the buildings create a diversified income mix between residential and commercial tenants, with the combined configuration designed to support ongoing cash flow through multiple revenue streams.
Key Highlights
- Two adjacent mixed‑use buildings offered as one portfolio at 629‑633 and 637‑641 Park Street, Hartford (built 1910)
- 11 total income‑producing units: 8 residential apartments and 3 street‑level commercial storefronts
- Dedicated on‑site parking lot serving residents and commercial tenants
Financial Insights
Estimated NOI and Cap Rate
NOI / Yr
$150,450
Cap Rate
9.15%
Suggested Prices Based on Cap Rates
Cap Rate 5%
$3,009,000
$3.0M
Cap Rate 7%
$2,149,286
$2.1M
Cap Rate 9%
$1,671,667
$1.7M
Market Conditions
NOI Build-Up for 11,800 SF
Gross rent
$283.2K $24.00/SF
− Vacancy
−$42.5K −$3.60/SF
EGI
$240.7K $20.40/SF
− OpEx
−$90.3K −$7.65/SF
NOI
$150.5K $12.75/SF
Area
Hartford, CT
Vacancy
15.00%
Lease Rate
$24.00 /SF/Yr
Expense Ratio
37.50%
Simulate Cap Rate and NOI
Suggested Prices Based on Cap Rates
Cap Rate 5%
$3,009,000
Cap Rate 7%
$2,149,286
Cap Rate 9%
$1,671,667
Alternative Uses
Best Use
Apartment 5plus
$2.27M
$1.99M – $2.65M
NOI $159,198 @ 7.0% cap · market cap 9.68%
Second Best
Mixed Use
$2.15M
$1.88M – $2.51M
NOI $150,450 @ 7.0% cap · market cap 9.15%
Theoretical Best
Office A
$3.52M
$3.08M – $4.10M
NOI $246,207 @ 7.0% cap · market cap 14.97%
Zoning and permitted uses should be independently verified with authorities.
How Realmo checks its estimates
Property Analytics
Contact the owner directly
Get the owner's phone numbers and email
Open Analytics
Current Use
Lease Details
8
Residential units
Multi-tenant
Tenancy
Yes
Highway access
Location Intelligence
Trade Area within ½ mile
4,911
Businesses Nearby
Explore this area
Business Placement
Demographics for 06106, CT
38,036
Population
16,938
Households
2.2
Avg Household Size
33
Median Age
17%
College-Educated
70%
High-School Grad
4.2 sq mi
ZIP Area
9,056
Density / Sq Mi
$47,542
Median Household Income
$31,395
Median Earnings
$1,237
Median Rent
$201,600
Median Home Value
Check the figures for this property
Cap Rate, Value Estimation, Potential NOI and more
View Realmo Analytics
Market
Vacancy Rate% for Multifamily in Northeast region






Frequently Asked Questions
What type of property is this?
Mixed-use property - Two adjacent mixed-use buildings include apartments and street-level commercial storefronts plus a dedicated on-site parking lot.
Where is this mixed-use property located?
The property is located at 629-641 Park Hartford, CT.
What is the asking price?
The asking price for this property is $1,645,000.
What are key features of this property?
This property features: Two adjacent mixed‑use buildings offered as one portfolio at 629‑633 and 637‑641 Park Street, Hartford (built 1910); 11 total income‑producing units: 8 residential apartments and 3 street‑level commercial storefronts; Dedicated on‑site parking lot serving residents and commercial tenants