Corner-Lot Legal
For Sale
$358,500
Pending
6160 CHARLES STREET, Philadelphia, PA 19135
Fully occupied multifamily property with private laundry in every unit and recent building upgrades.
Property Size1,850 SF
Days on Market110
Property Features for 6160 CHARLES STREET
General Information
Standard status
Pending
Size
1,850 SF
Property subtype
Triplex
Occupancy
100%
Site & Location
Neighborhood
Northeast Philadelphia
Highway Access
Yes
Additional Details
Multifamily Units
3
Taxes and HOA fees
Annual Taxes
$3,554
Amenities
private washer and dryer
Building Details
Building Size
1,850 SF
Year Built
1945
Tenancy
Multi
Listing Agency:
Keller Williams Real Estate - Newtown
Listed By:
Emilio john DiCicco · License #RS358289
(215) 669-4347
Source:
Mainlinekw
Added: Jul 7
Changed: Oct 21
Last Checked: Oct 23 at 2:39PM
Displayed information is deemed reliable but is not guaranteed and should be independently verified. All listing content including descriptions, pricing, images are the copyrighted material of Keller Williams Real Estate - Newtown

Ask AI about this property
Review the available facts, identify missing information and prepare questions for the agent.
Investment Insights
Based on property information with market context.
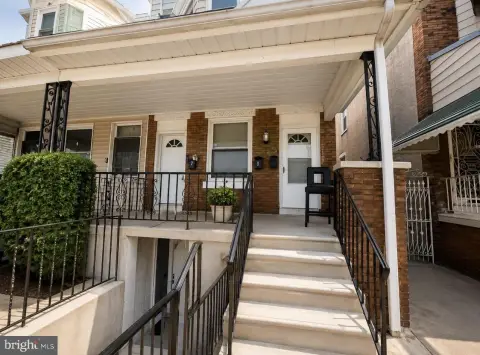
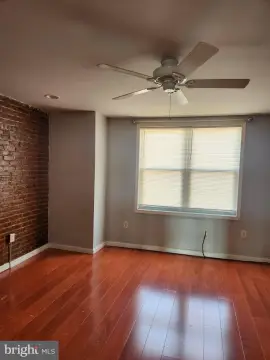
This legal triplex contains three residential units within an 1,850-square-foot property built in 1945. The building has been maintained during 22 years of ownership, with a flat roof installed in 2021, replacement windows and repairs, and updates to the second-floor and ground-floor units. Each apartment includes its own washer and dryer, while separate hot water heaters were replaced in 2021, 2024, and 2026.
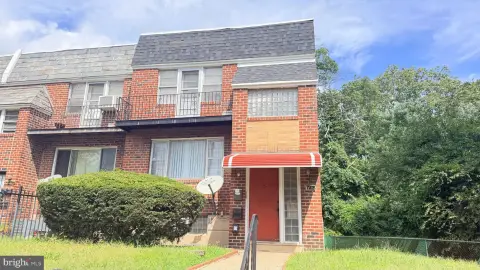
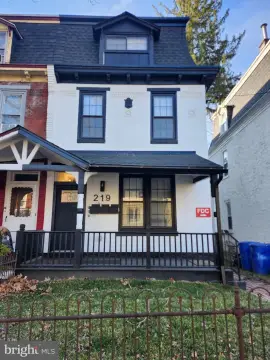
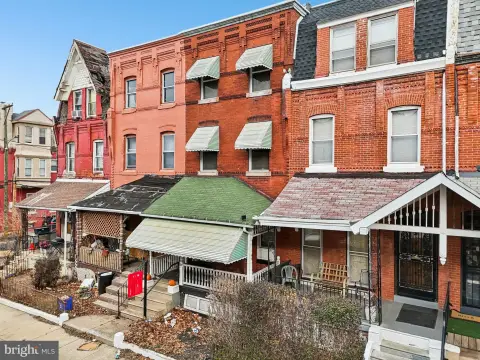
The property is fully occupied, and all current leases run through March 1, 2027. Positioned on a corner lot, the end-of-row building includes an oversized front-yard setback, additional side yard, and mature evergreen landscaping. Its Philadelphia location provides access to major highways and bridges connecting to New Jersey.
The property is fully occupied, and all current leases run through March 1, 2027. Positioned on a corner lot, the end-of-row building includes an oversized front-yard setback, additional side yard, and mature evergreen landscaping. Its Philadelphia location provides access to major highways and bridges connecting to New Jersey.
Key Highlights
- Legal triplex with 3 residential units
- 1,850 SF property built in 1945
- Fully occupied; current leases expire March 1, 2027
Financial Insights
Estimated NOI and Cap Rate
NOI / Yr
$31,570
Cap Rate
8.81%
Suggested Prices Based on Cap Rates
Cap Rate 5%
$631,400
$631.4K
Cap Rate 7%
$451,000
$451.0K
Cap Rate 9%
$350,778
$350.8K
Market Conditions
NOI Build-Up for 1,850 SF
Gross rent
$47.7K $25.80/SF
− Vacancy
−$2.6K −$1.42/SF
EGI
$45.1K $24.38/SF
− OpEx
−$13.5K −$7.31/SF
NOI
$31.6K $17.06/SF
Area
Philadelphia, PA
Vacancy
5.51%
Lease Rate
$25.80 /SF/Yr
Expense Ratio
30.00%
Simulate Cap Rate and NOI
Suggested Prices Based on Cap Rates
Cap Rate 5%
$631,400
Cap Rate 7%
$451,000
Cap Rate 9%
$350,778
Alternative Uses
Best Use
Multifamily LT 5
$451.0K
$394.6K – $526.2K
NOI $31,570 @ 7.0% cap · market cap 8.81%
Second Best
Apartment 5plus
$415.7K
$363.8K – $485.0K
NOI $29,100 @ 7.0% cap · market cap 8.12%
Theoretical Best
—
—
same as Best Use
Zoning and permitted uses should be independently verified with authorities.
How Realmo checks its estimates
Property Analytics
Contact the owner directly
Get the owner's phone numbers and email
Open Analytics
Lease Details
3
Residential units
100%
Occupancy
Multi-tenant
Tenancy
Yes
Highway access
Location Intelligence
Trade Area within ½ mile
986
Businesses Nearby
Explore this area
Business Placement
Demographics for 19135, PA
35,422
Population
14,323
Households
2.5
Avg Household Size
34
Median Age
16%
College-Educated
82%
High-School Grad
2.3 sq mi
ZIP Area
15,401
Density / Sq Mi
$51,817
Median Household Income
$38,673
Median Earnings
$1,197
Median Rent
$182,900
Median Home Value
Check the figures for this property
Cap Rate, Value Estimation, Potential NOI and more
View Realmo Analytics
Market
Vacancy Rate% for Multifamily in Northeast region




Frequently Asked Questions
What type of property is this?
Triplex - Fully occupied multifamily property with private laundry in every unit and recent building upgrades.
Where is this triplex located?
The property is located at 6160 CHARLES STREET Philadelphia, PA.
What is the asking price?
The asking price for this property is $358,500.
What are key features of this property?
This property features: Legal triplex with 3 residential units; 1,850 SF property built in 1945; Fully occupied; current leases expire March 1, 2027


