Charming Leased Care Home
For Sale
$670,000
6133 Petty St Sw, Covington, GA 30014
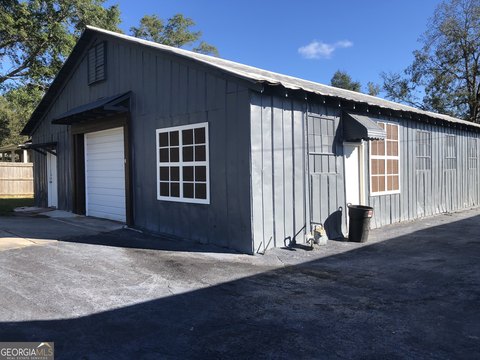
Fully leased, well-maintained 8-bed personal care home in Covington, GA.
Property Size1,755 SF
Price / SF$381.77
Days on Market590
Property Features for 6133 Petty St Sw
General Information
Standard status
Active
Size
1,755 SF
Taxes and HOA fees
Annual Taxes
$1,618
Listing Agency:
Platinum Access
Listed By:
Yolanda Rolle · License #338657
(404) 250-9360
Source:
Exprealty
Added: Mar 6, 2025
Changed: Oct 10
Last Checked: Oct 16 at 2:09PM
Displayed information is deemed reliable but is not guaranteed and should be independently verified. All listing content including descriptions, pricing, images are the copyrighted material of Platinum Access

Ask AI about this property
Review the available facts, identify missing information and prepare questions for the agent.
Investment Insights
Based on property information with market context.
This is an 8-bed semi-private personal care home located in Newton County, Georgia. The property is fully leased and situated approximately one mile from Covington Square. The facility includes 5 bedrooms and 2 ADA-compliant bathrooms, along with ADA ramps for accessibility. Enhanced safety features include a fully sprinkled fire suppression system. Recent upgrades to the property include a new roof, fresh paint, and newly installed engineered flooring. The property has a total size of 1755 square feet. The center is fully furnished and designed for comfort and accessibility. This property is intended for use as an assisted living facility or healthcare property, presenting a potential investment opportunity with a 6% CAP rate.
Key Highlights
- 100% Leased with a 6% CAP Rate: Provides immediate and stable income stream.
- Prime Location: Just a mile from Covington Square in Newton County, Georgia.
- Fully Operational 8‑Bed Facility: Ready for immediate use.
Financial Insights
Estimated NOI and Cap Rate
NOI / Yr
$23,577
Cap Rate
3.52%
Suggested Prices Based on Cap Rates
Cap Rate 5%
$471,540
$471.5K
Cap Rate 7%
$336,814
$336.8K
Cap Rate 9%
$261,967
$262.0K
Market Conditions
NOI Build-Up for 1,755 SF
Gross rent
$45.7K $26.04/SF
− Vacancy
−$2.8K −$1.61/SF
EGI
$42.9K $24.43/SF
− OpEx
−$19.3K −$10.99/SF
NOI
$23.6K $13.43/SF
Area
Newton County, GA
Vacancy
6.20%
Lease Rate
$26.04 /SF/Yr
Expense Ratio
45.00%
Simulate Cap Rate and NOI
Suggested Prices Based on Cap Rates
Cap Rate 5%
$471,540
Cap Rate 7%
$336,814
Cap Rate 9%
$261,967
Alternative Uses
Best Use
Apartment 5plus
$336.8K
$294.7K – $393.0K
NOI $23,577 @ 7.0% cap · market cap 3.52%
Second Best
—
—
no second resolved use
Theoretical Best
Office A
$490.6K
$429.3K – $572.4K
NOI $34,341 @ 7.0% cap · market cap 5.13%
Zoning and permitted uses should be independently verified with authorities.
How Realmo checks its estimates
Property Analytics
Unlock full access to Insights
Subscribe to Realmo Intelligence
Open Analytics
Current Use
Location Intelligence
Trade Area within ½ mile
59
Businesses Nearby
Balanced
Demand for This Use
Explore this area
Business Placement
Demographics for 30014, GA
39,247
Population
16,159
Households
2.4
Avg Household Size
39
Median Age
24%
College-Educated
86%
High-School Grad
120.7 sq mi
ZIP Area
325
Density / Sq Mi
$71,055
Median Household Income
$37,714
Median Earnings
$1,199
Median Rent
$253,900
Median Home Value
Check the figures for this property
Cap Rate, Value Estimation, Potential NOI and more
View Realmo Analytics




Similar Off Market Nearby
- Prema at Ashton Hills — 10050 Eagle Dr, Covington, GA 30014
- C7 Assists LLC — 8215 sterling ln, covington, ga 30014
- Peachtree Care Center of Covington — 6133 Petty St SW, Covington, GA 30014
Frequently Asked Questions
What type of property is this?
Assisted living facility - Fully leased, well-maintained 8-bed personal care home in Covington, GA.
Where is this assisted living facility located?
The property is located at 6133 Petty St Sw Covington, GA.
What is the asking price?
The asking price for this property is $670,000.
What are key features of this property?
This property features: 100% Leased with a 6% CAP Rate: Provides immediate and stable income stream.; Prime Location: Just a mile from Covington Square in Newton County, Georgia.; Fully Operational 8‑Bed Facility: Ready for immediate use.