Double-Wide Mixed-Use Income
For Sale
$2,750,000
61214 S 4th Street, Philadelphia, PA 19147
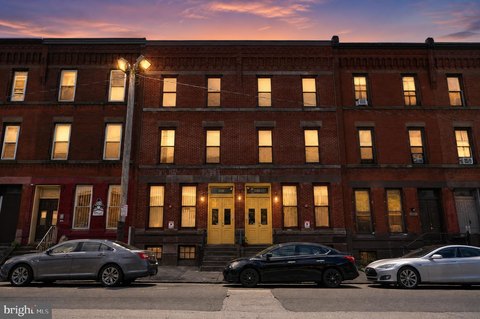
Two contiguous buildings offer fully leased ground-floor retail and apartments with separately metered utilities.
Property Size8,000 SF
Price / SF$343.75
Days on Market231
Property Features for 61214 S 4th Street
General Information
Standard status
Active
Size
8,000 SF
Property subtype
Commercial
Occupancy
100%
Lease Term
[]
Additional Details
Business Included
Yes
Multifamily Units
8
Building Details
Year Built
1900
Tenancy
Multi
Listing Agency:
MAXWELL REALTY COMPANY
Listed By:
Nancy L Alperin · License #RM050817L
(215) 620-0099
Source:
Deepcreeklake
Added: Mar 1
Changed: Oct 16
Last Checked: Oct 16 at 8:42AM
Displayed information is deemed reliable but is not guaranteed and should be independently verified. All listing content including descriptions, pricing, images are the copyrighted material of MAXWELL REALTY COMPANY

Ask AI about this property
Review the available facts, identify missing information and prepare questions for the agent.
Investment Insights
Based on property information with market context.
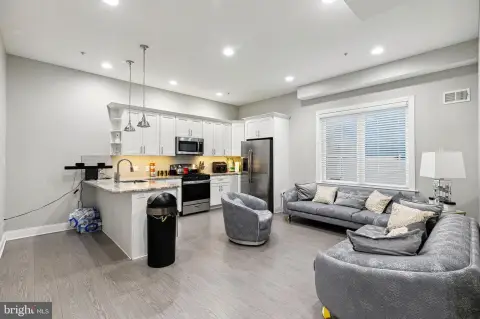
This double-wide mixed-use property consists of two contiguous buildings delivering a total of 10 fully leased units, with eight residential apartments and two ground-floor commercial spaces. The residential units are accessed via a private, gated entrance on Leithgow Street, and the current unit mix includes four two-bedroom apartments and four bi-level one-bedroom units. Apartment finishes include hardwood flooring, granite countertops, stainless steel appliances, custom cherry cabinetry, designer-tiled bathrooms, and central air conditioning, along with access to a rooftop deck. The property totals approximately 8,000 square feet.
The two ground-floor storefront spaces are currently occupied by established tenants under long-term leases, operating as a UPS store and a nail salon. The storefronts have visibility and multiple points of egress. Utilities, including water, are separately metered and paid directly by tenants.
For investors and operators seeking a stabilized mixed-use asset, the property offers a blend of residential income and street-level retail tenancy, with tenant-paid utilities helping simplify owner expenses. The gated residential access and dedicated apartment amenities support day-to-day livability, while the long-term commercial occupants provide ongoing operating continuity.
The two ground-floor storefront spaces are currently occupied by established tenants under long-term leases, operating as a UPS store and a nail salon. The storefronts have visibility and multiple points of egress. Utilities, including water, are separately metered and paid directly by tenants.
For investors and operators seeking a stabilized mixed-use asset, the property offers a blend of residential income and street-level retail tenancy, with tenant-paid utilities helping simplify owner expenses. The gated residential access and dedicated apartment amenities support day-to-day livability, while the long-term commercial occupants provide ongoing operating continuity.
Key Highlights
- Two contiguous buildings at 612–614 S. 4th Street with 10 fully leased units (8 residential + 2 ground‑floor commercial).
- Residential unit mix: four 2‑bedroom apartments and four bi‑level 1‑bedroom units across approx. 8,000 SF.
- Residential finishes include hardwood flooring, granite countertops, stainless steel appliances, custom cherry cabinetry, designer‑tiled bathrooms, and central air.
Financial Insights
Estimated NOI and Cap Rate
NOI / Yr
$125,836
Cap Rate
4.58%
Suggested Prices Based on Cap Rates
Cap Rate 5%
$2,516,720
$2.5M
Cap Rate 7%
$1,797,657
$1.8M
Cap Rate 9%
$1,398,178
$1.4M
Market Conditions
NOI Build-Up for 8,000 SF
Gross rent
$242.9K $30.36/SF
− Vacancy
−$14.1K −$1.76/SF
EGI
$228.8K $28.60/SF
− OpEx
−$103.0K −$12.87/SF
NOI
$125.8K $15.73/SF
Area
Philadelphia, PA
Vacancy
5.80%
Lease Rate
$30.36 /SF/Yr
Expense Ratio
45.00%
Simulate Cap Rate and NOI
Suggested Prices Based on Cap Rates
Cap Rate 5%
$2,516,720
Cap Rate 7%
$1,797,657
Cap Rate 9%
$1,398,178
Alternative Uses
Best Use
Apartment 5plus
$1.80M
$1.57M – $2.10M
NOI $125,836 @ 7.0% cap · market cap 4.58%
Second Best
Mixed Use
$1.36M
$1.19M – $1.58M
NOI $95,040 @ 7.0% cap · market cap 3.46%
Theoretical Best
Multifamily LT 5
$1.95M
$1.71M – $2.28M
NOI $136,519 @ 7.0% cap · market cap 4.96%
Zoning and permitted uses should be independently verified with authorities.
How Realmo checks its estimates
Property Analytics
Unlock full access to Insights
Subscribe to Realmo Intelligence
Open Analytics
Current Use
Lease Details
8
Residential units
100%
Occupancy
Multi-tenant
Tenancy
Turnkey business
Opportunity
Location Intelligence
Trade Area within ½ mile
521
Businesses Nearby
Explore this area
Business Placement
Demographics for 19147, PA
41,096
Population
20,735
Households
2
Avg Household Size
36
Median Age
69%
College-Educated
93%
High-School Grad
1.3 sq mi
ZIP Area
31,612
Density / Sq Mi
$104,190
Median Household Income
$71,905
Median Earnings
$1,679
Median Rent
$524,900
Median Home Value
Check the figures for this property
Cap Rate, Value Estimation, Potential NOI and more
View Realmo Analytics
Market
Vacancy Rate% for Multifamily in Northeast region






Frequently Asked Questions
What type of property is this?
Mixed-use property - Two contiguous buildings offer fully leased ground-floor retail and apartments with separately metered utilities.
Where is this mixed-use property located?
The property is located at 61214 S 4th Street Philadelphia, PA.
What is the asking price?
The asking price for this property is $2,750,000.
What are key features of this property?
This property features: Two contiguous buildings at 612–614 S. 4th Street with 10 fully leased units (8 residential + 2 ground‑floor commercial).; Residential unit mix: four 2‑bedroom apartments and four bi‑level 1‑bedroom units across approx. 8,000 SF.; Residential finishes include hardwood flooring, granite countertops, stainless steel appliances, custom cherry cabinetry, designer‑tiled bathrooms, and central air.