Updated Four-Unit
For Sale
$349,000
612 Rue Saint Martin, Hammond, LA 70403
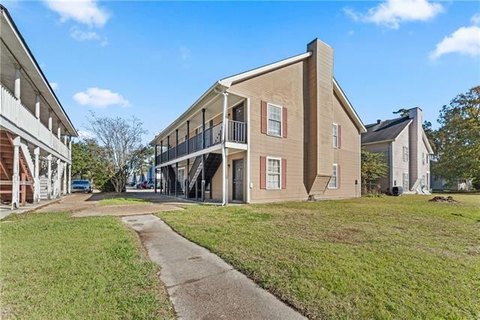
Four occupied two-bedroom units with individual utility metering and recent exterior improvements.
Property Size3,200 SF
Price / SF$109.06
Days on Market304
Property Features for 612 Rue Saint Martin
General Information
Standard status
Active
Size
3,200 SF
Property subtype
Residential Income
Units
Unit Mix
4 x 2BR/1BA
Multifamily Units
4
Listing Agency:
Realty Executives Florida Parishes
(985) 956-7477
Listed By:
Sam DiVittorio · License #995688138
(985) 320-0263
Source:
Exprealty
Added: Dec 16, 2025
Changed: Oct 8
Last Checked: Oct 15 at 4:05AM
Displayed information is deemed reliable but is not guaranteed and should be independently verified. All listing content including descriptions, pricing, images are the copyrighted material of Realty Executives Florida Parishes

Ask AI about this property
Review the available facts, identify missing information and prepare questions for the agent.
Investment Insights
Based on property information with market context.
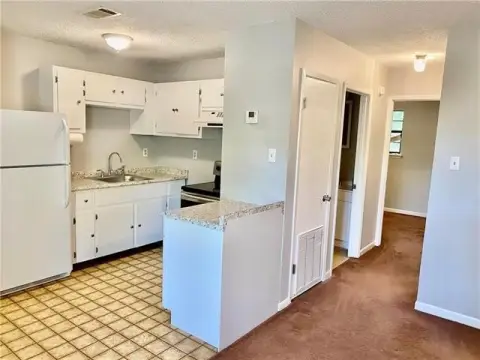
This 3,200-square-foot quadplex contains four two-bedroom, one-bath units. All four apartments are occupied, and each residence has separate metering for utilities. Tenants are responsible for utility costs, while city garbage, sewer, and water services are available to the property. The exterior has been recently updated, with additional improvements completed inside some units.
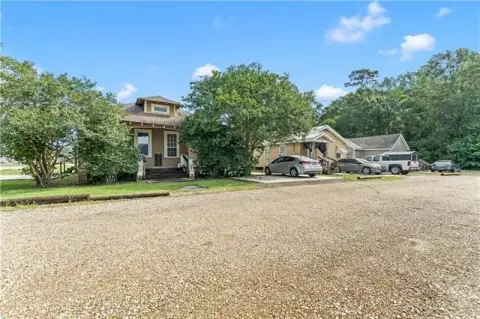
The property is located at 612 Rue Saint Martin in Hammond, near SELU campus, downtown, shopping, restaurants, hospitals, and I-55. It is in Flood Zone X, and flood insurance is not required.
The property is located at 612 Rue Saint Martin in Hammond, near SELU campus, downtown, shopping, restaurants, hospitals, and I-55. It is in Flood Zone X, and flood insurance is not required.
Key Highlights
- Four 2 bed/1bth units within a 3,200‑square‑foot quadplex
- Property stays occupied across all four units
- Each unit is individually metered for all utilities
Financial Insights
Estimated NOI and Cap Rate
NOI / Yr
$24,066
Cap Rate
6.90%
Suggested Prices Based on Cap Rates
Cap Rate 5%
$481,320
$481.3K
Cap Rate 7%
$343,800
$343.8K
Cap Rate 9%
$267,400
$267.4K
Market Conditions
NOI Build-Up for 3,200 SF
Gross rent
$37.6K $11.76/SF
− Vacancy
−$3.3K −$1.02/SF
EGI
$34.4K $10.74/SF
− OpEx
−$10.3K −$3.22/SF
NOI
$24.1K $7.52/SF
Area
Tangipahoa County, LA
Vacancy
8.64%
Lease Rate
$11.76 /SF/Yr
Expense Ratio
30.00%
Simulate Cap Rate and NOI
Suggested Prices Based on Cap Rates
Cap Rate 5%
$481,320
Cap Rate 7%
$343,800
Cap Rate 9%
$267,400
Alternative Uses
Best Use
Multifamily LT 5
$343.8K
$300.8K – $401.1K
NOI $24,066 @ 7.0% cap · market cap 6.90%
Second Best
Apartment 5plus
$298.9K
$261.6K – $348.8K
NOI $20,926 @ 7.0% cap · market cap 6.00%
Theoretical Best
Office A
$882.1K
$771.9K – $1.03M
NOI $61,749 @ 7.0% cap · market cap 17.69%
Zoning and permitted uses should be independently verified with authorities.
How Realmo checks its estimates
Property Analytics
Unlock full access to Insights
Subscribe to Realmo Intelligence
Open Analytics
Current Use
Lease Details
4
Residential units
Location Intelligence
Trade Area within ½ mile
743
Businesses Nearby
Explore this area
Business Placement
Demographics for 70403, LA
29,737
Population
13,577
Households
2.2
Avg Household Size
37
Median Age
24%
College-Educated
84%
High-School Grad
42.3 sq mi
ZIP Area
703
Density / Sq Mi
$50,547
Median Household Income
$32,603
Median Earnings
$992
Median Rent
$207,600
Median Home Value
Check the figures for this property
Cap Rate, Value Estimation, Potential NOI and more
View Realmo Analytics
Market
Vacancy Rate% for Multifamily in South region






Frequently Asked Questions
What type of property is this?
Quadplex - Four occupied two-bedroom units with individual utility metering and recent exterior improvements.
Where is this quadplex located?
The property is located at 612 Rue Saint Martin Hammond, LA.
What is the asking price?
The asking price for this property is $349,000.
What are key features of this property?
This property features: Four 2 bed/1bth units within a 3,200‑square‑foot quadplex; Property stays occupied across all four units; Each unit is individually metered for all utilities


