Single-Tenant Garden
For Sale
Contact for pricing
6024 4th St, Lubbock, TX 79416
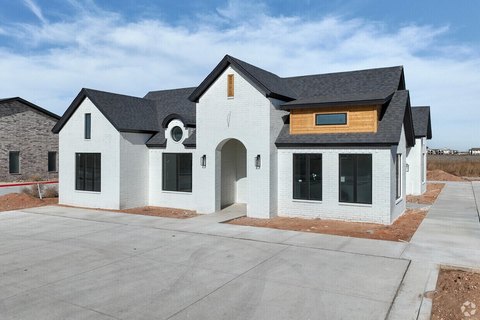
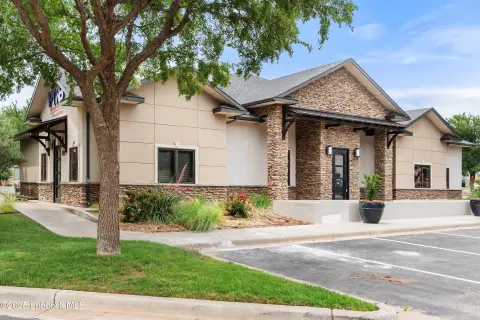
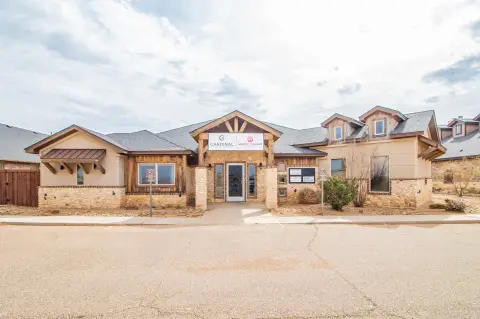
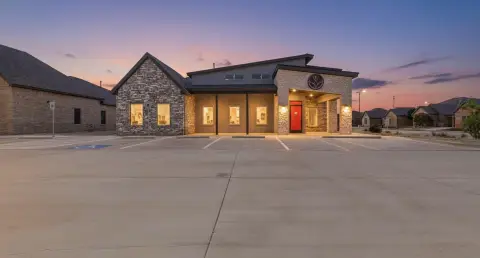
Modern professional suite with private offices, client reception, employee break space, and medical-use potential.
Property Size3,333 SF
Price / SF$285
Days on Market225
Property Features for 6024 4th St
General Information
Standard status
Active
Size
3,333 SF
Class
A
Property subtype
Office
Zoning
HC
Additional Details
Highway Access
Yes
Building Details
Year Built
2026
Buildings
1
Stories
1
Units
1
Tenancy
Single
Listing Agency:
McDougal Realtors
Listed By:
Ethan Quisenberry · License #TX
(806) 317-0234
Source:
Crexi
Added: Mar 6
Changed: Oct 15
Last Checked: Oct 16 at 6:12AM
Displayed information is deemed reliable but is not guaranteed and should be independently verified. All listing content including descriptions, pricing, images are the copyrighted material of McDougal Realtors

Ask AI about this property
Review the available facts, identify missing information and prepare questions for the agent.
Investment Insights
Based on property information with market context.
This 3,333-square-foot office building is configured for a single occupant and includes 14 private offices, two restrooms, a break area, and a lobby. The arrangement supports separate workspaces alongside shared areas for staff and visitors. Built in 2026, the property is identified as HC-zoned and can accommodate professional or medical office operations as supported by its existing layout.
The building sits at 6024 4th St in Lubbock, along 4th Street between Milwaukee Avenue and Frankford Avenue. Access to Loop 289 and the Marsha Sharp Freeway adds connectivity for employees, clients, and business visitors. The property is part of the 4th Street Garden Offices development and is presented as a garden-office asset.
The building sits at 6024 4th St in Lubbock, along 4th Street between Milwaukee Avenue and Frankford Avenue. Access to Loop 289 and the Marsha Sharp Freeway adds connectivity for employees, clients, and business visitors. The property is part of the 4th Street Garden Offices development and is presented as a garden-office asset.
Key Highlights
- 3,333‑square‑foot single‑tenant office building
- 14 private offices with two restrooms, break area, and lobby
- Built in 2026
Financial Insights
Estimated NOI and Cap Rate
NOI / Yr
$44,768
Cap Rate
4.71%
Suggested Prices Based on Cap Rates
Cap Rate 5%
$895,360
$895.4K
Cap Rate 7%
$639,543
$639.5K
Cap Rate 9%
$497,422
$497.4K
Market Conditions
NOI Build-Up for 3,333 SF
Gross rent
$82.0K $24.60/SF
− Vacancy
−$7.4K −$2.21/SF
EGI
$74.6K $22.39/SF
− OpEx
−$29.8K −$8.95/SF
NOI
$44.8K $13.43/SF
Area
Lubbock, TX
Vacancy
9.00%
Lease Rate
$24.60 /SF/Yr
Expense Ratio
40.00%
Simulate Cap Rate and NOI
Suggested Prices Based on Cap Rates
Cap Rate 5%
$895,360
Cap Rate 7%
$639,543
Cap Rate 9%
$497,422
Alternative Uses
Best Use
Healthcare Medical
$639.5K
$559.6K – $746.1K
NOI $44,768 @ 7.0% cap · market cap 4.71%
Second Best
Office B
$622.4K
$544.6K – $726.2K
NOI $43,571 @ 7.0% cap · market cap 4.59%
Theoretical Best
Office A
$840.3K
$735.2K – $980.3K
NOI $58,818 @ 7.0% cap · market cap 6.19%
Zoning and permitted uses should be independently verified with authorities.
How Realmo checks its estimates
Property Analytics
Unlock full access to Insights
Subscribe to Realmo Intelligence
Open Analytics
Current Use
Lease Details
Single-tenant
Tenancy
Yes
Highway access
Location Intelligence
Trade Area within ½ mile
294
Businesses Nearby
Explore this area
Business Placement
Demographics for 79416, TX
36,251
Population
16,094
Households
2.3
Avg Household Size
30
Median Age
39%
College-Educated
93%
High-School Grad
32.1 sq mi
ZIP Area
1,129
Density / Sq Mi
$65,200
Median Household Income
$34,258
Median Earnings
$1,269
Median Rent
$196,900
Median Home Value
Check the figures for this property
Cap Rate, Value Estimation, Potential NOI and more
View Realmo Analytics
Market
Vacancy Rate% for Office in South region





Frequently Asked Questions
What type of property is this?
Office building - Modern professional suite with private offices, client reception, employee break space, and medical-use potential.
Where is this office building located?
The property is located at 6024 4th St Lubbock, TX.
What is the asking price?
The asking price for this property is $949,905.
What are key features of this property?
This property features: 3,333‑square‑foot single‑tenant office building; 14 private offices with two restrooms, break area, and lobby; Built in 2026