Heated Mixed-Use Property with Garage
For Sale
$399,000
60095 State Highway 30, Grand Gorge, NY 12474
Automotive shop with a residential component and adaptable office area.
Property Size3,000 SF
Price / SF$133
Days on Market89
Property Features for 60095 State Highway 30
General Information
Standard status
Active
Size
3,000 SF
Building Details
Year Built
1940
Listing Agency:
Coldwell Banker Timberland Properties
Listed By:
Erin Darran · License #10401383826
(607) 386-3671
Source:
Skinnercnyrealty
Added: Jul 20
Changed: Oct 5
Last Checked: Oct 7 at 2:45PM
Displayed information is deemed reliable but is not guaranteed and should be independently verified. All listing content including descriptions, pricing, images are the copyrighted material of Coldwell Banker Timberland Properties

Ask AI about this property
Review the available facts, identify missing information and prepare questions for the agent.
Investment Insights
Based on property information with market context.
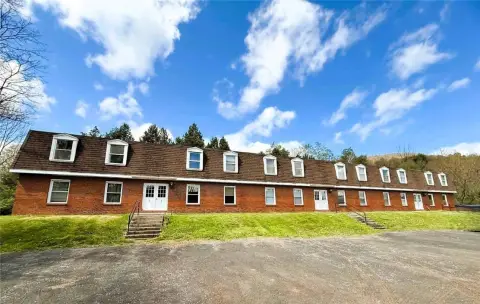
Built in 1940, this mixed-use property combines an automotive service building with residential accommodations and flexible office space. The shop includes four garage bays, a 4-post lift, 3-phase electric service, and full heating for year-round operations. Additional space can support reception, administration, or other office functions.
The residential portion includes 2 bedrooms, 1 full bathroom, and 2 half bathrooms. A loft-style bedroom overlooks the great room, which features cathedral ceilings with tongue-and-groove pine finishes. The home also includes a galley kitchen and adjoining dining area.
Located at 60095 State Highway 30 in Grand Gorge, the property occupies approximately 0.65 acres and directly borders the Catskill Scenic Trail. The trail provides access to hiking, cross-country skiing, and snowmobiling, while ski resorts, golf courses, and the New York Safety Track are within the surrounding area.
The residential portion includes 2 bedrooms, 1 full bathroom, and 2 half bathrooms. A loft-style bedroom overlooks the great room, which features cathedral ceilings with tongue-and-groove pine finishes. The home also includes a galley kitchen and adjoining dining area.
Located at 60095 State Highway 30 in Grand Gorge, the property occupies approximately 0.65 acres and directly borders the Catskill Scenic Trail. The trail provides access to hiking, cross-country skiing, and snowmobiling, while ski resorts, golf courses, and the New York Safety Track are within the surrounding area.
Key Highlights
- Four garage bays with a 4‑post lift
- 3‑phase electric service and full heating
- Residential component with 2 bedrooms, 1 full bathroom, and 2 half bathrooms
Financial Insights
Estimated NOI and Cap Rate
NOI / Yr
$28,980
Cap Rate
7.26%
Suggested Prices Based on Cap Rates
Cap Rate 5%
$579,600
$579.6K
Cap Rate 7%
$414,000
$414.0K
Cap Rate 9%
$322,000
$322.0K
Market Conditions
NOI Build-Up for 3,000 SF
Gross rent
$50.4K $16.80/SF
− Vacancy
−$4.0K −$1.34/SF
EGI
$46.4K $15.46/SF
− OpEx
−$17.4K −$5.80/SF
NOI
$29.0K $9.66/SF
Area
Delaware County, NY
Vacancy
8.00%
Lease Rate
$16.80 /SF/Yr
Expense Ratio
37.50%
Simulate Cap Rate and NOI
Suggested Prices Based on Cap Rates
Cap Rate 5%
$579,600
Cap Rate 7%
$414,000
Cap Rate 9%
$322,000
Alternative Uses
Best Use
Office B
$1.26M
$1.10M – $1.47M
NOI $88,133 @ 7.0% cap · market cap 22.09%
Second Best
Retail
$724.2K
$633.7K – $845.0K
NOI $50,697 @ 7.0% cap · market cap 12.71%
Theoretical Best
Office A
$1.47M
$1.29M – $1.72M
NOI $103,032 @ 7.0% cap · market cap 25.82%
Zoning and permitted uses should be independently verified with authorities.
How Realmo checks its estimates
Property Analytics
Unlock full access to Insights
Subscribe to Realmo Intelligence
Open Analytics
Current Use
Location Intelligence
Trade Area within ½ mile
56
Businesses Nearby
Explore this area
Business Placement
Demographics for 12474, NY
1,128
Population
1,015
Households
1.1
Avg Household Size
55
Median Age
32%
College-Educated
91%
High-School Grad
47.3 sq mi
ZIP Area
24
Density / Sq Mi
$54,462
Median Household Income
$40,455
Median Earnings
$840
Median Rent
$213,300
Median Home Value
Check the figures for this property
Cap Rate, Value Estimation, Potential NOI and more
View Realmo Analytics
Market
Vacancy Rate% for Office in Northeast region

Frequently Asked Questions
What type of property is this?
Mixed-use property - Automotive shop with a residential component and adaptable office area.
Where is this mixed-use property located?
The property is located at 60095 State Highway 30 Grand Gorge, NY.
What is the asking price?
The asking price for this property is $399,000.
What are key features of this property?
This property features: Four garage bays with a 4‑post lift; 3‑phase electric service and full heating; Residential component with 2 bedrooms, 1 full bathroom, and 2 half bathrooms


