Multi-Unit Warehouse with Four
For Sale
$2,300,000
60 South Mountain Drive, Decatur, AL 35603
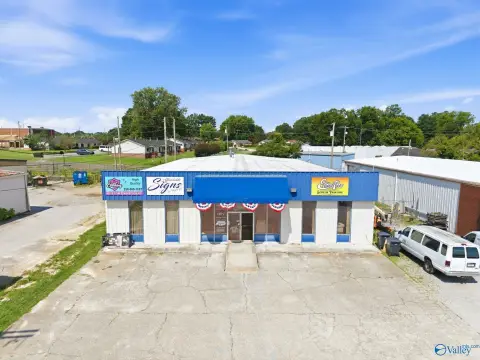
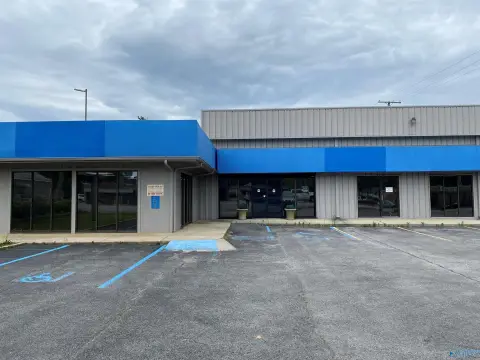
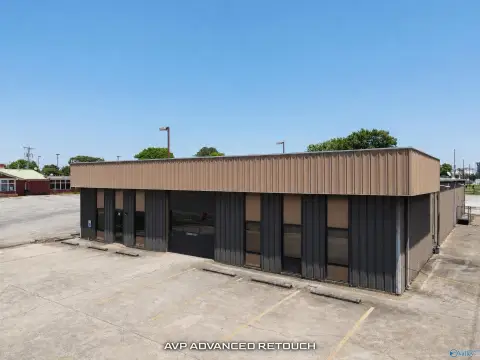
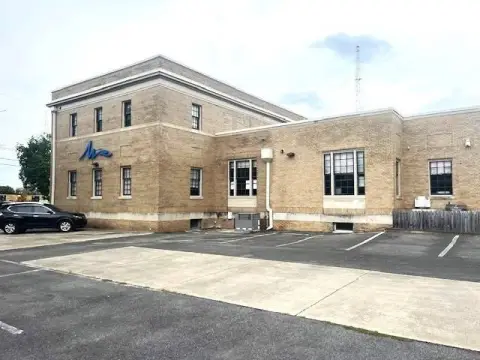
Multi-unit warehouse offers four units in a 22,500 SF facility with a 1992 foundation.
Property Size22,500 SF
Price / SF$102.22
Days on Market112
Property Features for 60 South Mountain Drive
General Information
Standard status
Active
Size
22,500 SF
Property subtype
Industrial
Zoning
Unzoned
Occupancy
75%
Site & Location
Highway Access
Yes
Road Access
Yes
Building Details
Building Size
22,500 SF
Year Built
1992
Tenancy
Multi
Listed By:
Paula Prestwood · License #AL #000043492-0
(256) 227-1524
Source:
Gatewaycommercial
Added: Jun 25
Changed: Oct 13
Last Checked: Oct 12 at 5:15PM
Displayed information is deemed reliable but is not guaranteed and should be independently verified. All listing content including descriptions, pricing, images are the copyrighted material of Paula Prestwood
Investment Insights
Based on property information with market context.
This 22,500 SF warehouse/distribution building is arranged as four separate units and has a solid foundation that was built in 1992. The property is presented as unzoned, providing flexibility for an industrial owner looking to operate or reposition a multi-tenant setup. Current leasing activity is reported at 75% occupancy, supporting ongoing income from the existing unit mix.
The property is located at 60 South Mountain Drive in the Decatur area and is described as being on high-traffic AL Hwy 20. With its straightforward industrial configuration and four-unit layout, the building is designed to serve multiple tenant needs under one ownership structure.
For investors and industrial operators, the four-unit design can be a practical fit for those seeking a warehouse asset with more than one tenant in place. The unzoned status may also be relevant for buyers evaluating how best to use and manage the property over time. Overall, this offering combines a mid-sized warehouse building with an established foundation and a current occupancy level, creating a workable platform for industrial ownership on a heavily traveled corridor.
The property is located at 60 South Mountain Drive in the Decatur area and is described as being on high-traffic AL Hwy 20. With its straightforward industrial configuration and four-unit layout, the building is designed to serve multiple tenant needs under one ownership structure.
For investors and industrial operators, the four-unit design can be a practical fit for those seeking a warehouse asset with more than one tenant in place. The unzoned status may also be relevant for buyers evaluating how best to use and manage the property over time. Overall, this offering combines a mid-sized warehouse building with an established foundation and a current occupancy level, creating a workable platform for industrial ownership on a heavily traveled corridor.
Key Highlights
- 22,500 SF industrial/warehouse building built in 1992
- 4‑unit setup in the 22,500 SF facility
- Unzoned property
Financial Insights
Estimated NOI and Cap Rate
NOI / Yr
$132,614
Cap Rate
5.77%
Suggested Prices Based on Cap Rates
Cap Rate 5%
$2,652,280
$2.7M
Cap Rate 7%
$1,894,486
$1.9M
Cap Rate 9%
$1,473,489
$1.5M
Market Conditions
NOI Build-Up for 22,500 SF
Gross rent
$167.4K $7.44/SF
− Vacancy
−$11.4K −$0.51/SF
EGI
$156.0K $6.93/SF
− OpEx
−$23.4K −$1.04/SF
NOI
$132.6K $5.89/SF
Area
Morgan County, AL
Vacancy
6.80%
Lease Rate
$7.44 /SF/Yr
Expense Ratio
15.00%
Simulate Cap Rate and NOI
Suggested Prices Based on Cap Rates
Cap Rate 5%
$2,652,280
Cap Rate 7%
$1,894,486
Cap Rate 9%
$1,473,489
Alternative Uses
Best Use
Warehouse
$1.89M
$1.66M – $2.21M
NOI $132,614 @ 7.0% cap · market cap 5.77%
Second Best
Industrial
$1.64M
$1.44M – $1.91M
NOI $114,865 @ 7.0% cap · market cap 4.99%
Theoretical Best
Office A
$4.68M
$4.10M – $5.46M
NOI $327,672 @ 7.0% cap · market cap 14.25%
Zoning and permitted uses should be independently verified with authorities.
How Realmo checks its estimates
Property Analytics
Unlock full access to Insights
Subscribe to Realmo Intelligence
Open Analytics
Current Use
Lease Details
75%
Occupancy
Multi-tenant
Tenancy
Yes
Highway access
Yes
Paved road access
Location Intelligence
Trade Area within ½ mile
7
Businesses Nearby
Well-served
Demand for This Use
Explore this area
Business Placement
Demographics for 35603, AL
32,380
Population
14,509
Households
2.2
Avg Household Size
42
Median Age
29%
College-Educated
91%
High-School Grad
71.0 sq mi
ZIP Area
456
Density / Sq Mi
$78,237
Median Household Income
$47,458
Median Earnings
$857
Median Rent
$235,600
Median Home Value
Check the figures for this property
Cap Rate, Value Estimation, Potential NOI and more
View Realmo Analytics
Market
Vacancy Rate% for Industrial in South region

Questions? Ask Rey
Realmo’s AI knows this listing — price, zoning, demand, history. Ask anything.





Frequently Asked Questions
What type of property is this?
Warehouse - Multi-unit warehouse offers four units in a 22,500 SF facility with a 1992 foundation.
Where is this warehouse located?
The property is located at 60 South Mountain Drive Decatur, AL.
What is the asking price?
The asking price for this property is $2,300,000.
What are key features of this property?
This property features: 22,500 SF industrial/warehouse building built in 1992; 4‑unit setup in the 22,500 SF facility; Unzoned property