Renovated 8-Unit Apartment
For Sale
Contact for pricing
60 New York Avenue, Brooklyn, NY 20001
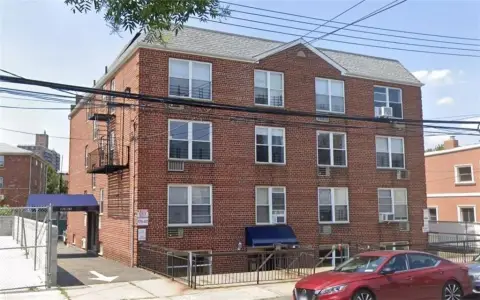
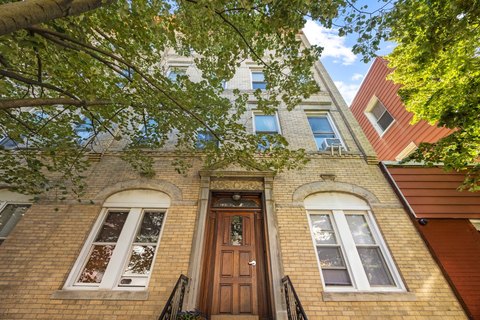
Eight four-bedroom residences are fully occupied and operate on a free-market basis.
Property Size9,584 SF
Price / SF$485.18
Days on Market60
Property Features for 60 New York Avenue
General Information
Standard status
Active
Size
9,584 SF
Property subtype
Multifamily
Zoning
C8-2
Occupancy
100%
Investment Type
Stabilized
Net Operating Income
$339,450
Units
Unit Mix
8 x 4BR
Multifamily Units
8
Building Details
Year Built
1931
Buildings
1
Units
8
Tenancy
Multi
Listing Agency:
Marcus & Millichap - Manhattan
Listed By:
Dan Greenblatt · License #NY 10301215921
Source:
Crexi
Added: Aug 7
Changed: Sep 23
Last Checked: Oct 4 at 7:23AM
Displayed information is deemed reliable but is not guaranteed and should be independently verified. All listing content including descriptions, pricing, images are the copyrighted material of Marcus & Millichap - Manhattan
Investment Insights
Based on property information with market context.
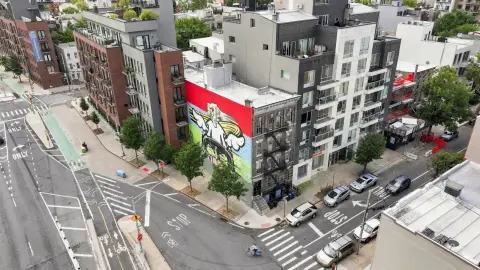
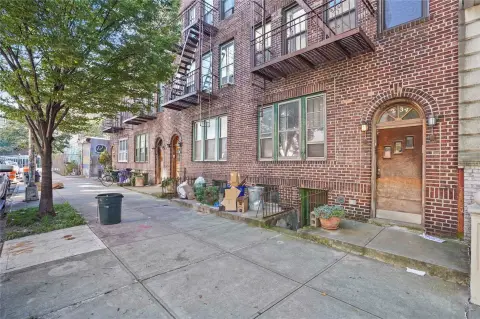
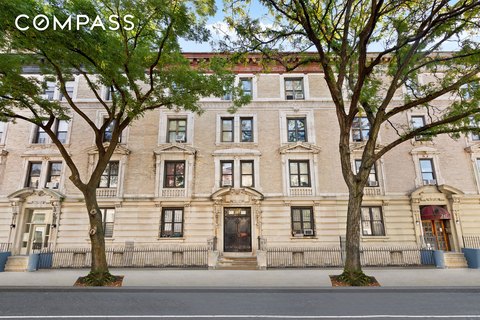
This 8-unit apartment building at 60 New York Avenue in Crown Heights, Brooklyn, was built in 1931 and has undergone a full renovation. The property contains 9,584 square feet, with four bedrooms in each residence. All units are designated free market and the building is fully occupied.
Units 1L and 1R offer a potential configuration for duplex access to the basement, along with private backyard access. The property also includes documentation related to deregulation. Its residential layout and existing occupancy provide a clear multifamily profile within Brooklyn.
Units 1L and 1R offer a potential configuration for duplex access to the basement, along with private backyard access. The property also includes documentation related to deregulation. Its residential layout and existing occupancy provide a clear multifamily profile within Brooklyn.
Key Highlights
- 8 residential units, each with 4 bedrooms
- 9,584 square feet in total
- Fully renovated multifamily building
Financial Insights
Estimated NOI and Cap Rate
NOI / Yr
$292,590
Cap Rate
6.29%
Suggested Prices Based on Cap Rates
Cap Rate 5%
$5,851,800
$5.9M
Cap Rate 7%
$4,179,857
$4.2M
Cap Rate 9%
$3,251,000
$3.3M
Market Conditions
NOI Build-Up for 9,584 SF
Gross rent
$542.8K $56.64/SF
− Vacancy
−$10.9K −$1.13/SF
EGI
$532.0K $55.51/SF
− OpEx
−$239.4K −$24.98/SF
NOI
$292.6K $30.53/SF
Area
Brooklyn, NY
Vacancy
2.00%
Lease Rate
$56.64 /SF/Yr
Expense Ratio
45.00%
Simulate Cap Rate and NOI
Suggested Prices Based on Cap Rates
Cap Rate 5%
$5,851,800
Cap Rate 7%
$4,179,857
Cap Rate 9%
$3,251,000
Alternative Uses
Best Use
Apartment 5plus
$4.18M
$3.66M – $4.88M
NOI $292,590 @ 7.0% cap · market cap 6.29%
Second Best
—
—
no second resolved use
Theoretical Best
Specialty Retail
$7.94M
$6.94M – $9.26M
NOI $555,489 @ 7.0% cap · market cap 11.95%
Zoning and permitted uses should be independently verified with authorities.
Property Analytics
Unlock full access to Insights
Subscribe to Realmo Intelligence
Open Analytics
Current Use
Lease Details
8
Residential units
Location Intelligence
Trade Area within ½ mile
6,367
Businesses Nearby
Explore this area
Business Placement
Check the figures for this property
Cap Rate, Value Estimation, Potential NOI and more
View Realmo Analytics
Market
Vacancy Rate% for Multifamily in Northeast region

Questions? Ask Rey
Realmo’s AI knows this listing — price, zoning, demand, history. Ask anything.




Frequently Asked Questions
What type of property is this?
Apartment building - Eight four-bedroom residences are fully occupied and operate on a free-market basis.
Where is this apartment building located?
The property is located at 60 New York Avenue Brooklyn, NY.
What is the asking price?
The asking price for this property is $4,650,000.
What are key features of this property?
This property features: 8 residential units, each with 4 bedrooms; 9,584 square feet in total; Fully renovated multifamily building