Renovation Triplex
For Sale
$650,000
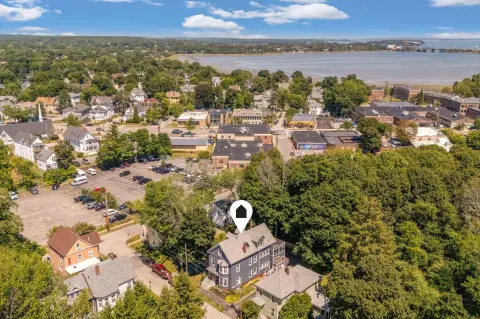
6 Horton Place, Portland, ME 04102
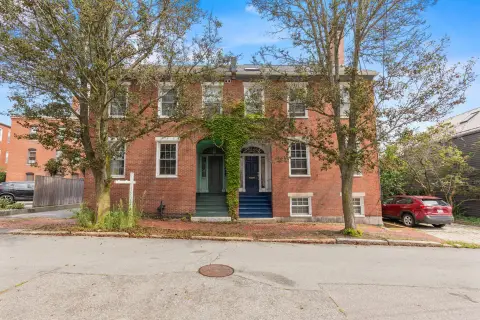
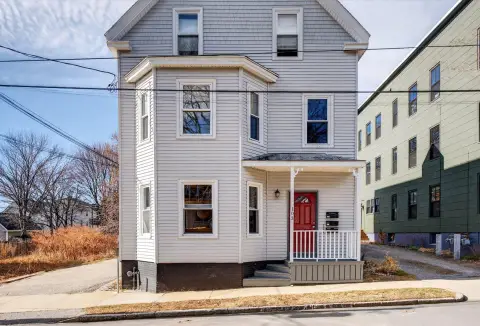
Three-unit triplex offered as a renovation project after water damage, providing a full interior reset for the next owner.
Property Size3,636 SF
Price / SF$178.77
Days on Market369

Ask AI about this property
Review the available facts, identify missing information and prepare questions for the agent.
Property Features for 6 Horton Place
General Information
Standard status
Active
Size
3,636 SF
Property subtype
Multi-family
Additional Details
Multifamily Units
3
Building Details
Year Built
1900
Listing Agency:
Ashby Real Estate
Listed By:
Sheldon Ashby
(207) 797-0000
Source:
Greatislandrealty
Added: Oct 12, 2025
Changed: Oct 15
Last Checked: Oct 14 at 11:54PM
Displayed information is deemed reliable but is not guaranteed and should be independently verified. All listing content including descriptions, pricing, images are the copyrighted material of Ashby Real Estate
Investment Insights
Based on property information with market context.
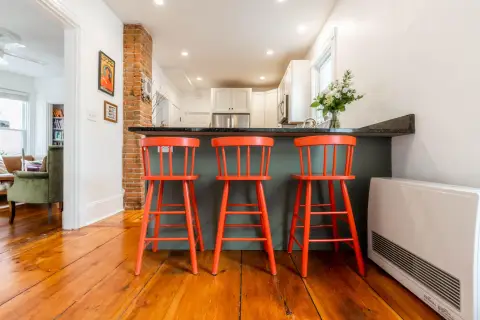
This three-unit triplex is being sold as a renovation project following water damage from frozen pipes. The property has been gutted down to the studs, leaving the interior largely stripped back and ready for new layouts, finishes, and systems decisions. It is configured as a multi-family income building with three separate units, making it well suited for an owner-operator contractor or an investor looking to complete the restoration through to re-lease.
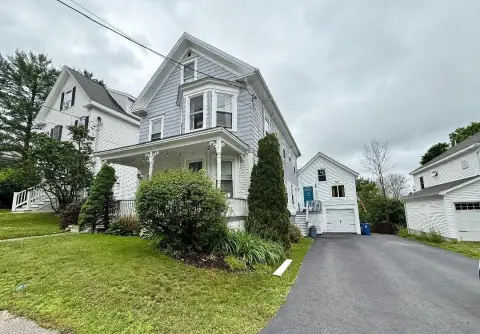
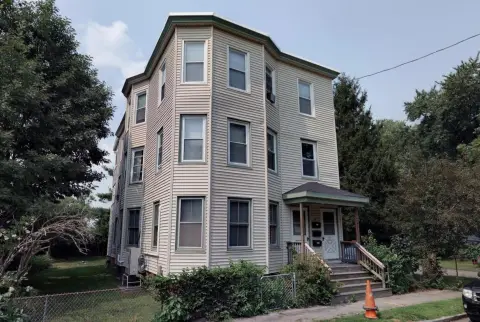
The property is located at 6 Horton Place in Portland, Maine. The provided information does not include details on exterior condition, unit interiors beyond the gutted state, or specific site improvements, so prospective buyers should plan to verify the full scope of work during due diligence.
For investors and contractors, the appeal here is the clear “start from the studs” condition after the water event. Completion will require redevelopment of interior spaces and finishing, and the next owner will be able to tailor the property to the intended rental configuration. The building’s three-unit structure also supports a straightforward path to restoring a multi-family income property once renovation and permitting are completed.
The property is located at 6 Horton Place in Portland, Maine. The provided information does not include details on exterior condition, unit interiors beyond the gutted state, or specific site improvements, so prospective buyers should plan to verify the full scope of work during due diligence.
For investors and contractors, the appeal here is the clear “start from the studs” condition after the water event. Completion will require redevelopment of interior spaces and finishing, and the next owner will be able to tailor the property to the intended rental configuration. The building’s three-unit structure also supports a straightforward path to restoring a multi-family income property once renovation and permitting are completed.
Key Highlights
- 3‑unit triplex offered as a renovation project after water damage from frozen pipes
- Property has been gutted down to the studs, providing a full interior reset
- Year built: 1900
Financial Insights
Estimated NOI and Cap Rate
NOI / Yr
$59,778
Cap Rate
9.20%
Suggested Prices Based on Cap Rates
Cap Rate 5%
$1,195,560
$1.2M
Cap Rate 7%
$853,971
$854.0K
Cap Rate 9%
$664,200
$664.2K
Market Conditions
NOI Build-Up for 3,636 SF
Gross rent
$115.6K $31.80/SF
− Vacancy
−$6.9K −$1.91/SF
EGI
$108.7K $29.89/SF
− OpEx
−$48.9K −$13.45/SF
NOI
$59.8K $16.44/SF
Area
Cumberland County, ME
Vacancy
6.00%
Lease Rate
$31.80 /SF/Yr
Expense Ratio
45.00%
Simulate Cap Rate and NOI
Suggested Prices Based on Cap Rates
Cap Rate 5%
$1,195,560
Cap Rate 7%
$853,971
Cap Rate 9%
$664,200
Alternative Uses
Best Use
Multifamily LT 5
$917.9K
$803.2K – $1.07M
NOI $64,254 @ 7.0% cap · market cap 9.89%
Second Best
Apartment 5plus
$854.0K
$747.2K – $996.3K
NOI $59,778 @ 7.0% cap · market cap 9.20%
Theoretical Best
Office A
$999.4K
$874.4K – $1.17M
NOI $69,955 @ 7.0% cap · market cap 10.76%
Zoning and permitted uses should be independently verified with authorities.
How Realmo checks its estimates
Property Analytics
Unlock full access to Insights
Subscribe to Realmo Intelligence
Open Analytics
Current Use
Lease Details
3
Residential units
Location Intelligence
Trade Area within ½ mile
4,612
Businesses Nearby
Explore this area
Business Placement
Demographics for 04102, ME
18,002
Population
8,633
Households
2.1
Avg Household Size
38
Median Age
62%
College-Educated
96%
High-School Grad
6.0 sq mi
ZIP Area
3,000
Density / Sq Mi
$79,631
Median Household Income
$47,898
Median Earnings
$1,435
Median Rent
$464,100
Median Home Value
Check the figures for this property
Cap Rate, Value Estimation, Potential NOI and more
View Realmo Analytics
Market
Vacancy Rate% for Multifamily in Northeast region


Frequently Asked Questions
What type of property is this?
Triplex - Three-unit triplex offered as a renovation project after water damage, providing a full interior reset for the next owner.
Where is this triplex located?
The property is located at 6 Horton Place Portland, ME.
What is the asking price?
The asking price for this property is $650,000.
What are key features of this property?
This property features: 3‑unit triplex offered as a renovation project after water damage from frozen pipes; Property has been gutted down to the studs, providing a full interior reset; Year built: 1900


