Dearborn Property with Ample
For Sale
$599,000
Pending
5824 CHASE Rd, Dearborn, MI 48126
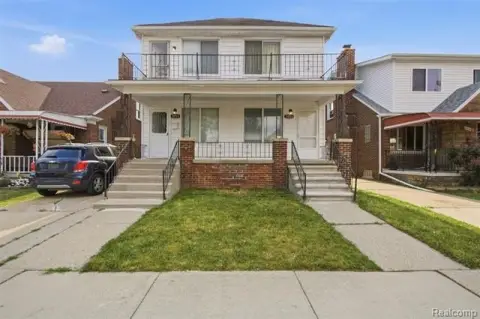
Updated property with frontage and secured, gated parking lot.
Property Size3,414 SF
Lot Size0.28 Acres
Days on Market313
Property Features for 5824 CHASE Rd
General Information
Standard status
Pending
Size
3,414 SF
Lot size
0.28 Acres
Property subtype
Commercial
Building Details
Building Size
3,414 SF
Year Built
1929
Listing Agency:
RE/MAX Team 2000
Listed By:
Yousef Beydoun · License #6501354088
(313) 561-0900
Source:
Elliman
Added: Nov 27, 2025
Changed: Oct 3
Last Checked: Oct 5 at 4:53PM
Displayed information is deemed reliable but is not guaranteed and should be independently verified. All listing content including descriptions, pricing, images are the copyrighted material of RE/MAX Team 2000
Investment Insights
Based on property information with market context.
This Dearborn property presents a purchase opportunity with several updates, including a newer roof, parking lot, and interior improvements. It features 120 feet of frontage and ample on-site parking. The lot is secured and gated, with 2 car ports. The property offers multiple use possibilities, suitable for an end user or investor.
Key Highlights
- Rare Dearborn Purchase Opportunity
- 120 feet of Frontage with ample onsite parking
- Newer roof and interior improvements
Financial Insights
Estimated NOI and Cap Rate
NOI / Yr
$42,050
Cap Rate
7.02%
Suggested Prices Based on Cap Rates
Cap Rate 5%
$841,000
$841.0K
Cap Rate 7%
$600,714
$600.7K
Cap Rate 9%
$467,222
$467.2K
Market Conditions
NOI Build-Up for 3,414 SF
Gross rent
$63.5K $18.60/SF
− Vacancy
−$3.4K −$1.00/SF
EGI
$60.1K $17.60/SF
− OpEx
−$18.0K −$5.28/SF
NOI
$42.0K $12.32/SF
Area
Dearborn, MI
Vacancy
5.40%
Lease Rate
$18.60 /SF/Yr
Expense Ratio
30.00%
Simulate Cap Rate and NOI
Suggested Prices Based on Cap Rates
Cap Rate 5%
$841,000
Cap Rate 7%
$600,714
Cap Rate 9%
$467,222
Alternative Uses
Best Use
Retail
$600.7K
$525.6K – $700.8K
NOI $42,050 @ 7.0% cap · market cap 7.02%
Second Best
Industrial
$286.2K
$250.4K – $333.9K
NOI $20,034 @ 7.0% cap · market cap 3.34%
Theoretical Best
Office A
$753.1K
$659.0K – $878.7K
NOI $52,720 @ 7.0% cap · market cap 8.80%
Zoning and permitted uses should be independently verified with authorities.
Property Analytics
Unlock full access to Insights
Subscribe to Realmo Intelligence
Open Analytics
Current Use
Location Intelligence
Trade Area within ½ mile
892
Businesses Nearby
51k
Monthly Visits Nearby
Under-served
Demand for This Use
Explore this area
Business Placement
Foot Traffic Nearby
Shops & Services 100%
Chase Bank
Shops & Services
19,334 visits/mo
0.2 miles
Exxon
Shops & Services
11,244 visits/mo
0.2 miles
Shell
Shops & Services
8,472 visits/mo
0.4 miles
BP
Shops & Services
5,850 visits/mo
0.5 miles
Chase Bank
Shops & Services
4,091 visits/mo
0.1 miles
Demographics for 48126, MI
55,863
Population
16,919
Households
3.3
Avg Household Size
28
Median Age
24%
College-Educated
74%
High-School Grad
8.4 sq mi
ZIP Area
6,650
Density / Sq Mi
$42,353
Median Household Income
$27,724
Median Earnings
$1,222
Median Rent
$200,600
Median Home Value
Check the figures for this property
Cap Rate, Value Estimation, Potential NOI and more
View Realmo Analytics
Market
Vacancy Rate% for Retail in Midwest region

Questions? Ask Rey
Realmo’s AI knows this listing — price, zoning, demand, history. Ask anything.


Similar Off Market Nearby
- Enterprise Rent-A-Car — 4950 Greenfield Rd, Dearborn, MI 48126
- TMF Detroit Slingshot Rentals — 5724 Chase Rd, Dearborn, MI 48126
- ATM — 6827 Greenfield Rd, Detroit, MI 48228
- Vehicle Skinz — 7020 Chase Rd Rear Garage Entrance, Dearborn, MI 48126
Frequently Asked Questions
What type of property is this?
Parking lot & garage - Updated property with frontage and secured, gated parking lot.
Where is this parking lot & garage located?
The property is located at 5824 CHASE Rd Dearborn, MI.
What is the asking price?
The asking price for this property is $599,000.
What are key features of this property?
This property features: Rare Dearborn Purchase Opportunity; 120 feet of Frontage with ample onsite parking; Newer roof and interior improvements



