Neighborhood Bakery with
For Sale
$974,500
57 East Street, Ipswich, MA 01938
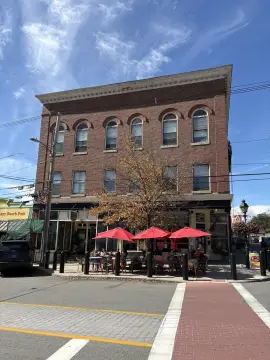
Two-level food service and retail setup includes a professional kitchen and a private-entry two-bedroom apartment.
Property Size2,419 SF
Price / SF$402.85
Days on Market393
Property Features for 57 East Street
General Information
Standard status
Active
Size
2,419 SF
Property subtype
Commercial
Zoning
0130 IR
Additional Details
Business Included
Yes
Multifamily Units
1
Taxes and HOA fees
Annual Taxes
$4,672
Building Details
Building Size
2,419 SF
Year Built
1909
Stories
2
Listing Agency:
eXp Realty LLC
(888) 854-7493
Listed By:
The North Shore Realty Group
(978) 710-9388
Source:
Churchillprop
Added: Sep 23, 2025
Changed: Oct 6
Last Checked: Oct 19 at 3:38AM
Displayed information is deemed reliable but is not guaranteed and should be independently verified. All listing content including descriptions, pricing, images are the copyrighted material of eXp Realty LLC

Ask AI about this property
Review the available facts, identify missing information and prepare questions for the agent.
Investment Insights
Based on property information with market context.
This property combines a neighborhood-focused food and retail operation with residential space. The first floor includes a professional industrial kitchen that is currently set up as a bakery serving lunch and dinner, along with retail convenience components described in the listing. The second floor offers a two-bedroom, one-bath apartment with a large living room/dining room and a private entrance. An out-building of 342 square feet, previously used as a bait shop and currently used for extra storage, adds additional operational flexibility.
The property is located on East Street in Ipswich and is described as being a short distance to the Ipswich River. The Ipswich River boat launch and park are noted as moments away. Convenient parking and visibility are also highlighted in the remarks, supporting day-to-day customer access for the retail and food service uses.
For operators and buyers seeking an income-producing live-work arrangement, the configuration allows the food service and retail operation to run on the main level while the separate apartment provides an additional use within the same building. The presence of a fully equipped kitchen and on-site storage supports ongoing food preparation and service, while the private entrance to the apartment offers practical separation between commercial and residential access.
The property is located on East Street in Ipswich and is described as being a short distance to the Ipswich River. The Ipswich River boat launch and park are noted as moments away. Convenient parking and visibility are also highlighted in the remarks, supporting day-to-day customer access for the retail and food service uses.
For operators and buyers seeking an income-producing live-work arrangement, the configuration allows the food service and retail operation to run on the main level while the separate apartment provides an additional use within the same building. The presence of a fully equipped kitchen and on-site storage supports ongoing food preparation and service, while the private entrance to the apartment offers practical separation between commercial and residential access.
Key Highlights
- 1909 two‑level property with food service/retail setup and a private‑entry 2‑bedroom, 1‑bath apartment on the second floor
- First floor includes a professional industrial kitchen set up for high‑volume food service (currently a bakery serving lunch and dinner)
- Continued use described for neighborhood bakery/restaurant/convenience store/retail package store with wine and malt beverages
Financial Insights
Estimated NOI and Cap Rate
NOI / Yr
$44,713
Cap Rate
4.59%
Suggested Prices Based on Cap Rates
Cap Rate 5%
$894,260
$894.3K
Cap Rate 7%
$638,757
$638.8K
Cap Rate 9%
$496,811
$496.8K
Market Conditions
NOI Build-Up for 2,419 SF
Gross rent
$61.0K $25.20/SF
− Vacancy
−$1.3K −$0.55/SF
EGI
$59.6K $24.65/SF
− OpEx
−$14.9K −$6.16/SF
NOI
$44.7K $18.48/SF
Area
Essex County, MA
Vacancy
2.20%
Lease Rate
$25.20 /SF/Yr
Expense Ratio
25.00%
Simulate Cap Rate and NOI
Suggested Prices Based on Cap Rates
Cap Rate 5%
$894,260
Cap Rate 7%
$638,757
Cap Rate 9%
$496,811
Alternative Uses
Best Use
Specialty Retail
$638.8K
$558.9K – $745.2K
NOI $44,713 @ 7.0% cap · market cap 4.59%
Second Best
Retail
$567.8K
$496.8K – $662.4K
NOI $39,745 @ 7.0% cap · market cap 4.08%
Theoretical Best
Office A
$1.43M
$1.25M – $1.67M
NOI $100,243 @ 7.0% cap · market cap 10.29%
Zoning and permitted uses should be independently verified with authorities.
How Realmo checks its estimates
Property Analytics
Unlock full access to Insights
Subscribe to Realmo Intelligence
Open Analytics
Current Use
Lease Details
1
Residential units
Turnkey business
Opportunity
Location Intelligence
Trade Area within ½ mile
508
Businesses Nearby
2k
Monthly Visits Nearby
Under-served
Demand for This Use
Explore this area
Business Placement
Foot Traffic Nearby
Shops & Services 100%
TD Bank
Shops & Services
2,321 visits/mo
0.5 miles
Demographics for 01938, MA
13,785
Population
6,270
Households
2.2
Avg Household Size
51
Median Age
57%
College-Educated
98%
High-School Grad
32.1 sq mi
ZIP Area
429
Density / Sq Mi
$124,405
Median Household Income
$62,161
Median Earnings
$1,525
Median Rent
$701,400
Median Home Value
Check the figures for this property
Cap Rate, Value Estimation, Potential NOI and more
View Realmo Analytics
Market
Vacancy Rate% for Retail in Northeast region





Frequently Asked Questions
What type of property is this?
Conventional restaurant - Two-level food service and retail setup includes a professional kitchen and a private-entry two-bedroom apartment.
Where is this conventional restaurant located?
The property is located at 57 East Street Ipswich, MA.
What is the asking price?
The asking price for this property is $974,500.
What are key features of this property?
This property features: 1909 two‑level property with food service/retail setup and a private‑entry 2‑bedroom, 1‑bath apartment on the second floor; First floor includes a professional industrial kitchen set up for high‑volume food service (currently a bakery serving lunch and dinner); Continued use described for neighborhood bakery/restaurant/convenience store/retail package store with wine and malt beverages


