Office Building with Private
For Sale
$2,400,000
5619 N Classen Blvd., Oklahoma City, OK 73118
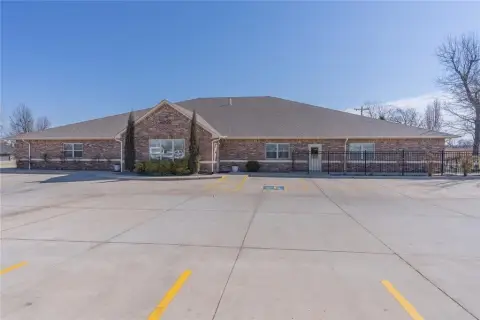
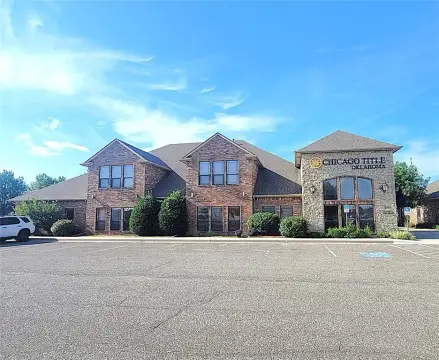
Office building featuring 23 private offices and covered parking.
Property Size12,098 SF
Days on Market232
Property Features for 5619 N Classen Blvd.
General Information
Standard status
Active
Size
12,098 SF
Class
A
Property subtype
Office
Building Details
Building Size
12,098 SF
Year Built
2008
Listing Agency:
Creek Price Edwards and Company - Oklahoma City
Listed By:
Tre Dupuy
(405) 412-3810
Source:
Tcnworldwide
Added: Mar 6
Changed: Oct 7
Last Checked: Oct 23 at 5:05AM
Displayed information is deemed reliable but is not guaranteed and should be independently verified. All listing content including descriptions, pricing, images are the copyrighted material of Creek Price Edwards and Company - Oklahoma City

Ask AI about this property
Review the available facts, identify missing information and prepare questions for the agent.
Investment Insights
Based on property information with market context.
This office building features a total of 23 private offices, with 22 positioned along the window line. The property includes an executive office complete with a private bathroom and breakroom, as well as an executive lounge equipped with a fireplace. Break areas are located on both the first and second floors. Covered parking is available, offering direct access to the building. The property also features a high-density file storage system and a back-up generator. Approximately 90 parking spaces are available. The owner is willing to consider a sale leaseback of the second floor. The building is located at the Deep Fork Creek Office Park.
Key Highlights
- Total of 23 private offices, with 22 boasting window views.
- Covered parking provides direct building access.
- Benefit from the added security of a back‑up generator.
Financial Insights
Estimated NOI and Cap Rate
NOI / Yr
$172,121
Cap Rate
7.17%
Suggested Prices Based on Cap Rates
Cap Rate 5%
$3,442,420
$3.4M
Cap Rate 7%
$2,458,871
$2.5M
Cap Rate 9%
$1,912,456
$1.9M
Market Conditions
NOI Build-Up for 12,098 SF
Gross rent
$302.0K $24.96/SF
− Vacancy
−$72.5K −$5.99/SF
EGI
$229.5K $18.97/SF
− OpEx
−$57.4K −$4.74/SF
NOI
$172.1K $14.23/SF
Area
Oklahoma City, OK
Vacancy
24.00%
Lease Rate
$24.96 /SF/Yr
Expense Ratio
25.00%
Simulate Cap Rate and NOI
Suggested Prices Based on Cap Rates
Cap Rate 5%
$3,442,420
Cap Rate 7%
$2,458,871
Cap Rate 9%
$1,912,456
Alternative Uses
Best Use
Office B
$2.46M
$2.15M – $2.87M
NOI $172,121 @ 7.0% cap · market cap 7.17%
Second Best
—
—
no second resolved use
Theoretical Best
Specialty Retail
$4.14M
$3.62M – $4.83M
NOI $289,626 @ 7.0% cap · market cap 12.07%
Zoning and permitted uses should be independently verified with authorities.
How Realmo checks its estimates
Property Analytics
Contact the owner directly
Get the owner's phone numbers and email
Open Analytics
Current Use
Location Intelligence
Trade Area within ½ mile
1,793
Businesses Nearby
Explore this area
Business Placement
Demographics for 73118, OK
13,521
Population
7,856
Households
1.7
Avg Household Size
37
Median Age
49%
College-Educated
92%
High-School Grad
4.8 sq mi
ZIP Area
2,817
Density / Sq Mi
$69,321
Median Household Income
$45,494
Median Earnings
$1,064
Median Rent
$252,500
Median Home Value
Check the figures for this property
Cap Rate, Value Estimation, Potential NOI and more
View Realmo Analytics
Market
Vacancy Rate% for Office in Oklahoma City, OK






Frequently Asked Questions
What type of property is this?
Office building - Office building featuring 23 private offices and covered parking.
Where is this office building located?
The property is located at 5619 N Classen Blvd. Oklahoma City, OK.
What is the asking price?
The asking price for this property is $2,400,000.
What are key features of this property?
This property features: Total of 23 private offices, with 22 boasting window views.; Covered parking provides direct building access.; Benefit from the added security of a back‑up generator.


