Three-Unit Mixed-Use
For Sale
$309,000
5556 Market St, Philadelphia, PA 19139
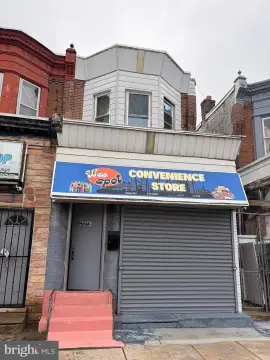
CMX2 zoning supports a ground-level commercial component alongside residential space.
Property Size2,009 SF
Price / SF$153.81
Days on Market97
Property Features for 5556 Market St
General Information
Standard status
Active
Size
2,009 SF
Total Parking Spaces
2
Zoning
CMX2
Site & Location
Road Access
Yes
Public Transit
Yes
Units
Unit Mix
1 x 1BR, 1 x 2BR
Multifamily Units
2
Amenities
private fenced yard
off-street parking
enclosed porch
high-efficiency gas forced air heat
central air
Building Details
Year Built
1920
Buildings
1
Tenancy
Multi
Listing Agency:
KW Empower
Listed By:
Carlos Masip · License #AB068852
(215) 400-2600
Source:
Teamgaddy
Added: Jul 9
Changed: Oct 4
Last Checked: Oct 12 at 10:10PM
Displayed information is deemed reliable but is not guaranteed and should be independently verified. All listing content including descriptions, pricing, images are the copyrighted material of KW Empower
Investment Insights
Based on property information with market context.
This 2,009-square-foot mixed-use building dates to 1920 and contains three units. The ground level provides commercial space under CMX2 zoning, while the residential portion includes a one-bedroom apartment and a two-bedroom apartment. Residential improvements include kitchens, baths, updated flooring, heating systems, central air in the upper unit, an enclosed porch, and a private fenced yard. The property also includes a washer/dryer and new plumbing in the first-floor apartment.
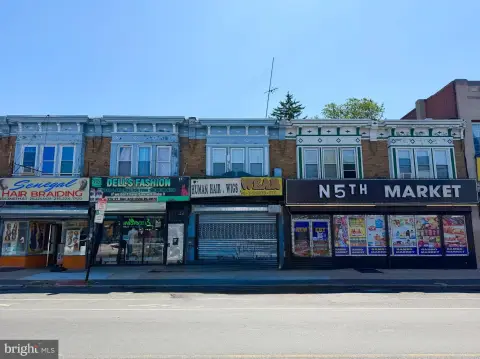
Located on the south side of Market Street in Philadelphia, the building is adjacent to the University of Pennsylvania and a short walk from the SEPTA 56th Street EL stop. Nearby transit connects with the University of Pennsylvania, Drexel University, and downtown Philadelphia.
The lot extends 125 feet deep and includes a rear alley/private driveway plus off-street parking for 1–2 cars. The second-floor enclosed porch offers additional flexible space within the existing layout.
Located on the south side of Market Street in Philadelphia, the building is adjacent to the University of Pennsylvania and a short walk from the SEPTA 56th Street EL stop. Nearby transit connects with the University of Pennsylvania, Drexel University, and downtown Philadelphia.
The lot extends 125 feet deep and includes a rear alley/private driveway plus off-street parking for 1–2 cars. The second-floor enclosed porch offers additional flexible space within the existing layout.
Key Highlights
- Three‑unit configuration with commercial space and two residential apartments
- 2,009 SF mixed‑use building constructed in 1920
- Ground‑floor commercial component with CMX2 zoning
Financial Insights
Estimated NOI and Cap Rate
NOI / Yr
$23,867
Cap Rate
7.72%
Suggested Prices Based on Cap Rates
Cap Rate 5%
$477,340
$477.3K
Cap Rate 7%
$340,957
$341.0K
Cap Rate 9%
$265,189
$265.2K
Market Conditions
NOI Build-Up for 2,009 SF
Gross rent
$43.4K $21.60/SF
− Vacancy
−$5.2K −$2.59/SF
EGI
$38.2K $19.01/SF
− OpEx
−$14.3K −$7.13/SF
NOI
$23.9K $11.88/SF
Area
Philadelphia, PA
Vacancy
12.00%
Lease Rate
$21.60 /SF/Yr
Expense Ratio
37.50%
Simulate Cap Rate and NOI
Suggested Prices Based on Cap Rates
Cap Rate 5%
$477,340
Cap Rate 7%
$340,957
Cap Rate 9%
$265,189
Alternative Uses
Best Use
Apartment 5plus
$451.4K
$395.0K – $526.7K
NOI $31,601 @ 7.0% cap · market cap 10.23%
Second Best
Mixed Use
$341.0K
$298.3K – $397.8K
NOI $23,867 @ 7.0% cap · market cap 7.72%
Theoretical Best
Multifamily LT 5
$489.8K
$428.5K – $571.4K
NOI $34,283 @ 7.0% cap · market cap 11.09%
Zoning and permitted uses should be independently verified with authorities.
How Realmo checks its estimates
Property Analytics
Unlock full access to Insights
Subscribe to Realmo Intelligence
Open Analytics
Current Use
Lease Details
2
Residential units
Multi-tenant
Tenancy
Yes
Paved road access
Location Intelligence
Trade Area within ½ mile
2,277
Businesses Nearby
Explore this area
Business Placement
Demographics for 19139, PA
43,281
Population
23,896
Households
1.8
Avg Household Size
36
Median Age
22%
College-Educated
86%
High-School Grad
1.8 sq mi
ZIP Area
24,045
Density / Sq Mi
$38,701
Median Household Income
$34,796
Median Earnings
$1,110
Median Rent
$118,700
Median Home Value
Check the figures for this property
Cap Rate, Value Estimation, Potential NOI and more
View Realmo Analytics
Market
Vacancy Rate% for Multifamily in Northeast region

Questions? Ask Rey
Realmo’s AI knows this listing — price, zoning, demand, history. Ask anything.






Frequently Asked Questions
What type of property is this?
Mixed-use property - CMX2 zoning supports a ground-level commercial component alongside residential space.
Where is this mixed-use property located?
The property is located at 5556 Market St Philadelphia, PA.
What is the asking price?
The asking price for this property is $309,000.
What are key features of this property?
This property features: Three‑unit configuration with commercial space and two residential apartments; 2,009 SF mixed‑use building constructed in 1920; Ground‑floor commercial component with CMX2 zoning


