Remodeled Mixed-Use
For Sale
$419,900
5549 N 5TH STREET, Philadelphia, PA 19120
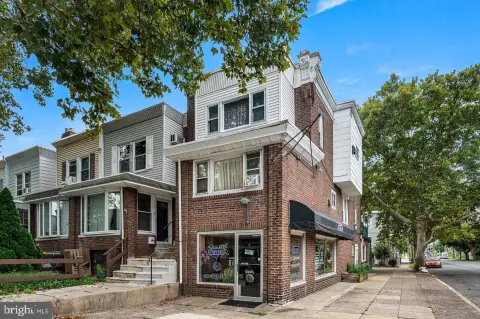
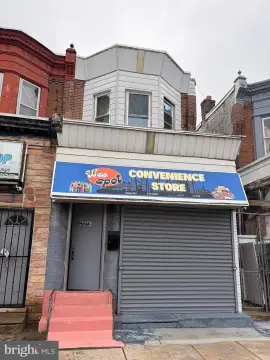
Retail storefront with an upstairs two-bedroom apartment and separate entrances.
Property Size1,950 SF
Price / SF$215.33
Days on Market54
Property Features for 5549 N 5TH STREET
General Information
Standard status
Active
Size
1,950 SF
Total Parking Spaces
1
Property subtype
Commercial
Additional Details
Highway Access
Yes
Building Details
Year Built
1910
Buildings
1
Listing Agency:
Century 21 Advantage Gold-South Philadelphia
(215) 465-1400
Listed By:
Phong D Lam · License #RS307378
(267) 918-1880
Source:
Cummingsrealtors
Added: Aug 26
Changed: Oct 16
Last Checked: Oct 16 at 8:22AM
Displayed information is deemed reliable but is not guaranteed and should be independently verified. All listing content including descriptions, pricing, images are the copyrighted material of Century 21 Advantage Gold-South Philadelphia

Ask AI about this property
Review the available facts, identify missing information and prepare questions for the agent.
Investment Insights
Based on property information with market context.
This 1,950-square-foot mixed-use property combines a renovated retail storefront with a spacious second-floor apartment. The commercial area includes glass entry features, LED lighting, tile flooring, shelving, open cabinetry, a built-in sink, rear storage, a half bathroom, and an automatic roll-up security door. A one-car driveway and unfinished basement provide additional utility. The property was built in 1910 and has updated electrical and plumbing systems.
The upper residence has two bedrooms, one full bathroom, a living room, dining area, and kitchen with oak cabinetry, appliances, recessed lighting, and washer/dryer hookups. New flooring, skylights, and electric baseboard heat are included. Separate entrances, electric meters, hot water heaters, and utility systems support the mixed-use configuration.
Located in Philadelphia’s Olney section, the property is near public transportation, supermarkets, restaurants, parks, and retail destinations, with access to major highways.
The upper residence has two bedrooms, one full bathroom, a living room, dining area, and kitchen with oak cabinetry, appliances, recessed lighting, and washer/dryer hookups. New flooring, skylights, and electric baseboard heat are included. Separate entrances, electric meters, hot water heaters, and utility systems support the mixed-use configuration.
Located in Philadelphia’s Olney section, the property is near public transportation, supermarkets, restaurants, parks, and retail destinations, with access to major highways.
Key Highlights
- 1,950‑square‑foot mixed‑use property with retail space and a two‑bedroom apartment
- Renovated storefront with LED lighting, tile flooring, shelving, built‑in sink, and roll‑up security door
- Second‑floor apartment includes 2 bedrooms, 1 full bathroom, kitchen, living room, and dining area
Financial Insights
Estimated NOI and Cap Rate
NOI / Yr
$16,750
Cap Rate
3.99%
Suggested Prices Based on Cap Rates
Cap Rate 5%
$335,000
$335.0K
Cap Rate 7%
$239,286
$239.3K
Cap Rate 9%
$186,111
$186.1K
Market Conditions
NOI Build-Up for 1,950 SF
Gross rent
$26.7K $13.68/SF
− Vacancy
−$2.7K −$1.41/SF
EGI
$23.9K $12.27/SF
− OpEx
−$7.2K −$3.68/SF
NOI
$16.7K $8.59/SF
Area
ZIP 19120
Vacancy
10.30%
Lease Rate
$13.68 /SF/Yr
Expense Ratio
30.00%
Simulate Cap Rate and NOI
Suggested Prices Based on Cap Rates
Cap Rate 5%
$335,000
Cap Rate 7%
$239,286
Cap Rate 9%
$186,111
Alternative Uses
Best Use
Retail
$239.3K
$209.4K – $279.2K
NOI $16,750 @ 7.0% cap · market cap 3.99%
Second Best
Mixed Use
$239.0K
$209.1K – $278.9K
NOI $16,731 @ 7.0% cap · market cap 3.98%
Theoretical Best
Office A
$465.8K
$407.6K – $543.5K
NOI $32,607 @ 7.0% cap · market cap 7.77%
Zoning and permitted uses should be independently verified with authorities.
How Realmo checks its estimates
Property Analytics
Unlock full access to Insights
Subscribe to Realmo Intelligence
Open Analytics
Current Use
Lease Details
Yes
Highway access
Location Intelligence
Trade Area within ½ mile
1,658
Businesses Nearby
45k
Monthly Visits Nearby
Explore this area
Business Placement
Foot Traffic Nearby
Shops & Services 71%
Dining 27%
Apparel 1%
AutoZone
Shops & Services
10,772 visits/mo
0.5 miles
Dunkin' Donuts
Dining
10,315 visits/mo
0.1 miles
Sunoco
Shops & Services
8,349 visits/mo
0.1 miles
Sunoco
Shops & Services
6,674 visits/mo
0.4 miles
PNC Bank
Shops & Services
3,994 visits/mo
0.1 miles
Demographics for 19120, PA
66,177
Population
25,730
Households
2.6
Avg Household Size
35
Median Age
13%
College-Educated
77%
High-School Grad
3.2 sq mi
ZIP Area
20,680
Density / Sq Mi
$51,993
Median Household Income
$32,980
Median Earnings
$1,186
Median Rent
$143,500
Median Home Value
Check the figures for this property
Cap Rate, Value Estimation, Potential NOI and more
View Realmo Analytics
Market
Vacancy Rate% for Retail in Philadelphia, PA






Frequently Asked Questions
What type of property is this?
Mixed-use property - Retail storefront with an upstairs two-bedroom apartment and separate entrances.
Where is this mixed-use property located?
The property is located at 5549 N 5TH STREET Philadelphia, PA.
What is the asking price?
The asking price for this property is $419,900.
What are key features of this property?
This property features: 1,950‑square‑foot mixed‑use property with retail space and a two‑bedroom apartment; Renovated storefront with LED lighting, tile flooring, shelving, built‑in sink, and roll‑up security door; Second‑floor apartment includes 2 bedrooms, 1 full bathroom, kitchen, living room, and dining area


