Mixed-Use Commercial
For Sale
$585,000
5519 Germantown Avenue, Philadelphia, PA 19144
Two-level mixed-use building with large windows, flexible interior layout, and five-car outdoor parking.
Property Size4,278 SF
Price / SF$136.75
Days on Market289
Property Features for 5519 Germantown Avenue
General Information
Standard status
Active
Size
4,278 SF
Property subtype
Multi-Family
Zoning
CMX25
Site & Location
Neighborhood
Wister
Taxes and HOA fees
Annual Taxes
$5,956
Amenities
Natural Gas
Yes
Oil
3
Estimated
No Pool
Public
DB0
32.00 x 150.00
0.11
No
Parking Lot
Slab
85100.00
Building Details
Building Size
4,278 SF
Year Built
1950
Listing Agency:
Coldwell Banker Commercial
(856) 222-0077
Listed By:
Christopher Twardy · License #1540241
(609) 304-2314
Source:
Thetristaterealestategroup
Added: Jan 9
Changed: Oct 6
Last Checked: Oct 24 at 3:09PM
Displayed information is deemed reliable but is not guaranteed and should be independently verified. All listing content including descriptions, pricing, images are the copyrighted material of Coldwell Banker Commercial

Ask AI about this property
Review the available facts, identify missing information and prepare questions for the agent.
Investment Insights
Based on property information with market context.
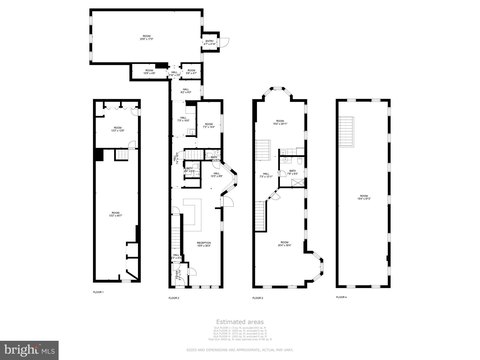
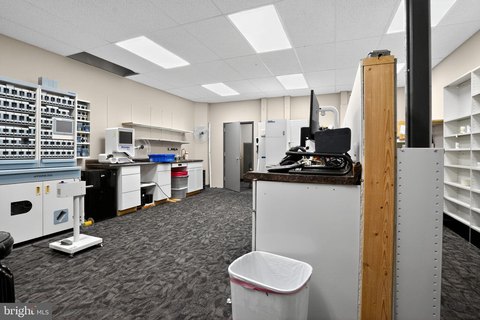
This mixed-use commercial building offers an expansive layout across two levels, including large windows for natural light and high ceilings. The current configuration includes a reception area and flexible room nooks, with a setup that can support additional partitioning. A finished lower level and third floor provide space that can be used for storage, shared common space, or living space.
The property features wide street-level presence on Germantown Avenue with a five-car outdoor parking lot, plus additional street parking. It is currently rented to one long-term tenant operating as a dental office.
The property is zoned CMX-2.5, which is intended for active neighborhood commercial corridors and supports a mix of uses, including offices and retail, as well as residential integration for live-work or rental options.
The property features wide street-level presence on Germantown Avenue with a five-car outdoor parking lot, plus additional street parking. It is currently rented to one long-term tenant operating as a dental office.
The property is zoned CMX-2.5, which is intended for active neighborhood commercial corridors and supports a mix of uses, including offices and retail, as well as residential integration for live-work or rental options.
Key Highlights
- Zoned CMX‑2.5 (Philadelphia) for versatile mixed‑use, including office, retail, personal services, restaurants, and residential integration.
- Two‑level mixed‑use building with 3 total stories, large windows, high ceilings, and a finished lower level plus third floor for storage/common space.
- Lot size approx. 0.11 acres (32.00 x 150.00) with slab foundation and public water supply.
Financial Insights
Estimated NOI and Cap Rate
NOI / Yr
$50,823
Cap Rate
8.69%
Suggested Prices Based on Cap Rates
Cap Rate 5%
$1,016,460
$1.0M
Cap Rate 7%
$726,043
$726.0K
Cap Rate 9%
$564,700
$564.7K
Market Conditions
NOI Build-Up for 4,278 SF
Gross rent
$92.4K $21.60/SF
− Vacancy
−$11.1K −$2.59/SF
EGI
$81.3K $19.01/SF
− OpEx
−$30.5K −$7.13/SF
NOI
$50.8K $11.88/SF
Area
Philadelphia, PA
Vacancy
12.00%
Lease Rate
$21.60 /SF/Yr
Expense Ratio
37.50%
Simulate Cap Rate and NOI
Suggested Prices Based on Cap Rates
Cap Rate 5%
$1,016,460
Cap Rate 7%
$726,043
Cap Rate 9%
$564,700
Alternative Uses
Best Use
Office B
$804.2K
$703.7K – $938.3K
NOI $56,296 @ 7.0% cap · market cap 9.62%
Second Best
Mixed Use
$726.0K
$635.3K – $847.1K
NOI $50,823 @ 7.0% cap · market cap 8.69%
Theoretical Best
Multifamily LT 5
$1.04M
$912.6K – $1.22M
NOI $73,004 @ 7.0% cap · market cap 12.48%
Zoning and permitted uses should be independently verified with authorities.
How Realmo checks its estimates
Property Analytics
Unlock full access to Insights
Subscribe to Realmo Intelligence
Open Analytics
Current Use
Location Intelligence
Trade Area within ½ mile
1,905
Businesses Nearby
Explore this area
Business Placement
Demographics for 19144, PA
44,481
Population
23,583
Households
1.9
Avg Household Size
37
Median Age
35%
College-Educated
90%
High-School Grad
3.6 sq mi
ZIP Area
12,356
Density / Sq Mi
$45,727
Median Household Income
$36,020
Median Earnings
$1,110
Median Rent
$224,600
Median Home Value
Check the figures for this property
Cap Rate, Value Estimation, Potential NOI and more
View Realmo Analytics
Market
Vacancy Rate% for Office in Philadelphia, PA




Frequently Asked Questions
What type of property is this?
Live-work space - Two-level mixed-use building with large windows, flexible interior layout, and five-car outdoor parking.
Where is this live-work space located?
The property is located at 5519 Germantown Avenue Philadelphia, PA.
What is the asking price?
The asking price for this property is $585,000.
What are key features of this property?
This property features: Zoned CMX‑2.5 (Philadelphia) for versatile mixed‑use, including office, retail, personal services, restaurants, and residential integration.; Two‑level mixed‑use building with 3 total stories, large windows, high ceilings, and a finished lower level plus third floor for storage/common space.; Lot size approx. 0.11 acres (32.00 x 150.00) with slab foundation and public water supply.