Mixed-Use Retail and Residential
55-61 High Street Mount Holly, NJ 08060
For Sale
$1,430,000
Four occupied retail storefronts with approved plans for six two-bedroom apartments above.
Property Size13,000 SF
Price / SF$110
Days on Market87
Property Features for 55-61 High Street
General Information
Standard status
Active
Size
13,000 SF
Property subtype
Commercial
Building Details
Year Built
1970
Listing Agency:
BHHS Fox & Roach-Marlton
Listed By:
Dawn Varallo
Source:
Deepcreeklake
Added: May 3
Changed: Jul 10
Last Checked: Jul 27 at 12:05AM
Displayed information is deemed reliable but is not guaranteed and should be independently verified. All listing content including descriptions, pricing, images are the copyrighted material of BHHS Fox & Roach-Marlton
Investment Insights
Based on property information with market context.
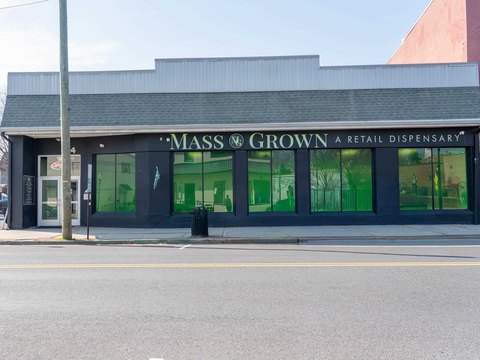
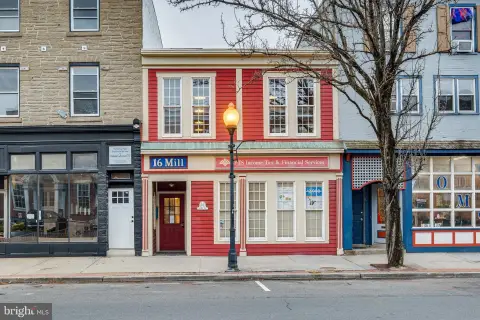
55-61 High Street in Mount Holly, NJ is a mixed-use building totaling approximately 13,000 square feet. The property includes four fully occupied commercial storefronts on the street level, with each tenant responsible for their own utilities and expenses. The upper levels are positioned for residential conversion, supported by approved plans for six (6) two-bedroom apartments.
The building is situated on High Street in downtown Mount Holly and includes a rear lot on Brainerd Street. The additional lot provides room for parking and supports access and development flexibility connected to the planned residential use.
For an investor or owner-operator, this setup offers two layers of utility: existing, leased storefront space and an approved residential path above. The combination of current commercial occupancy and permitted apartment plans can appeal to buyers looking to manage both retail operations and a structured conversion effort within the same building footprint.
The building is situated on High Street in downtown Mount Holly and includes a rear lot on Brainerd Street. The additional lot provides room for parking and supports access and development flexibility connected to the planned residential use.
For an investor or owner-operator, this setup offers two layers of utility: existing, leased storefront space and an approved residential path above. The combination of current commercial occupancy and permitted apartment plans can appeal to buyers looking to manage both retail operations and a structured conversion effort within the same building footprint.
Key Highlights
- 13,000 SF mixed‑use building in downtown Mount Holly
- Four fully occupied commercial storefronts with tenants paying their own utilities and expenses
- Upper‑level potential: approved plans for six (6) two‑bedroom residential apartments
Financial Insights For Mixed Use
Simulate Cap Rate and NOI
NOI Build-Up
- Vacancy
- income lost from leasable area expected to sit empty during the year — subtracted from gross rent.
- EGI (Effective Gross Income)
- gross rent minus vacancy losses — the realistic income before paying operating costs.
- OpEx (Operating Expenses)
- recurring costs to operate the property (property tax, insurance, utilities, maintenance, management) — excludes financing and capital improvements.
- NOI (Net Operating Income)
- income a property generates after operating costs but before financing and taxes.
| Component | $ | $/SF |
|---|---|---|
| Gross rent | $205.9k | $15.84 |
| − Vacancy | −$29.4k | −$2.27 |
| EGI | $176.5k | $13.57 |
| − OpEx | −$66.2k | −$5.09 |
| NOI | $110.3k | $8.48 |
13,000 SF · lease $15.84/SF/yr · vacancy 14.30% · expense 37.50%
Alternative Uses
Best Use
Retail
$2.78M
$2.43M – $3.24M
NOI $194,402 @ 7.0% cap · market cap 13.59%
Second Best
Mixed Use
$1.58M
$1.38M – $1.84M
NOI $110,296 @ 7.0% cap · market cap 7.71%
Theoretical Best
Warehouse
$27.19M
$23.79M – $31.72M
NOI $1,903,248 @ 7.0% cap · market cap 133.09%
Zoning and permitted uses should be independently verified with authorities.
Property Analytics
Property Profile
Location Intelligence
Current Use






Frequently Asked Questions
What type of property is this?
Mixed-use property - Four occupied retail storefronts with approved plans for six two-bedroom apartments above.
Where is this mixed-use property located?
The property is located at 55-61 High Street Mount Holly, NJ.
What is the asking price?
The asking price for this property is $1,430,000.
What are key features of this property?
This property features: 13,000 SF mixed‑use building in downtown Mount Holly; Four fully occupied commercial storefronts with tenants paying their own utilities and expenses; Upper‑level potential: approved plans for six (6) two‑bedroom residential apartments


