Craftsman Duplex with Finished
For Sale
$675,000
539 E 53rd Street, Indianapolis, IN 46220
Residential Income, Indianapolis, IN
Property Size4,040 SF
Lot Size0.20 Acres
Price / SF$167.08
Days on Market50
Property Features for 539 E 53rd Street
General Information
Property type
Residential Multi Family
Property subtype
Duplex
Zoning
Residential
Bedrooms
8
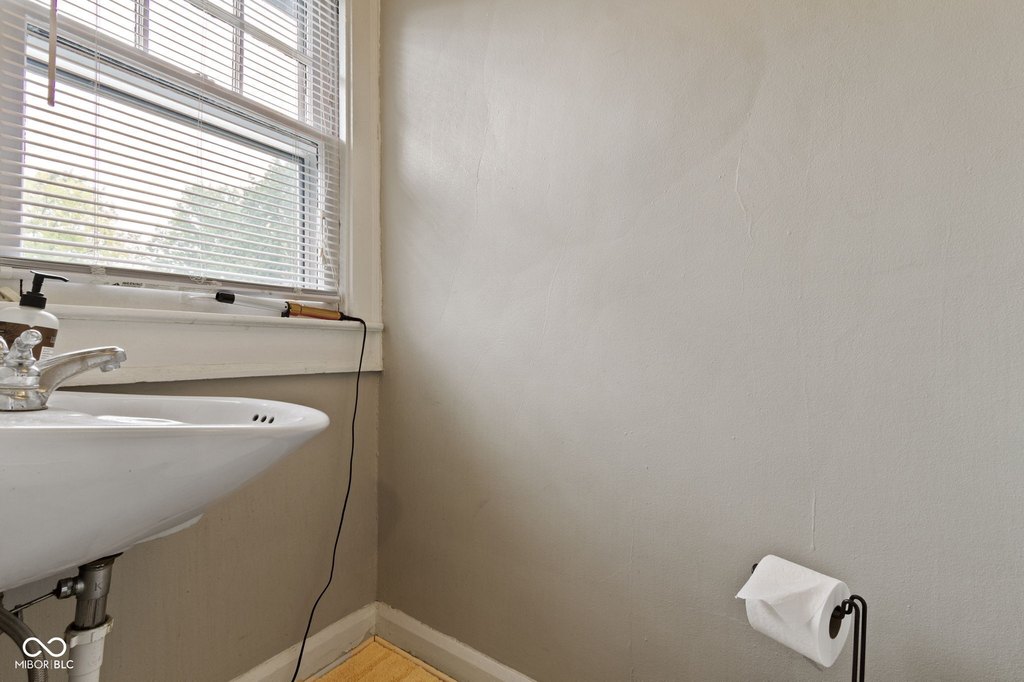
Bathrooms
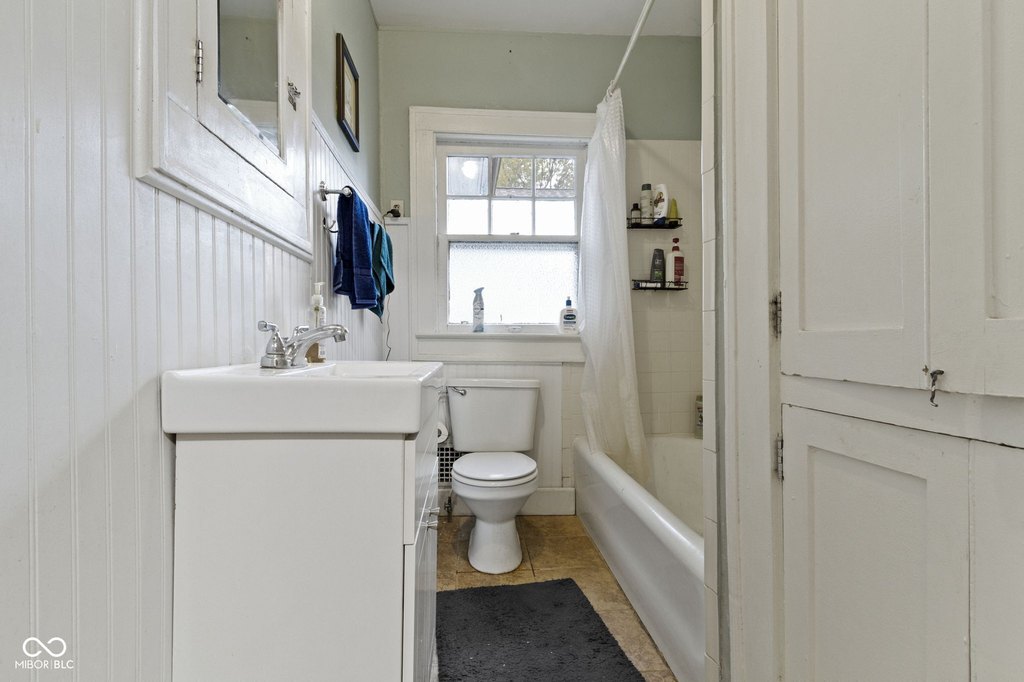
5
Full bathrooms
5
Rooms
Bedroom 3, Bedroom 7, Bedroom 4, Basement, Bedroom 2, Bathroom 3, Bedroom 6, Bedroom 5, Bathroom 1, Bedroom 1, Bathroom 4, Bathroom 2, Bedroom 8, Bathroom 5
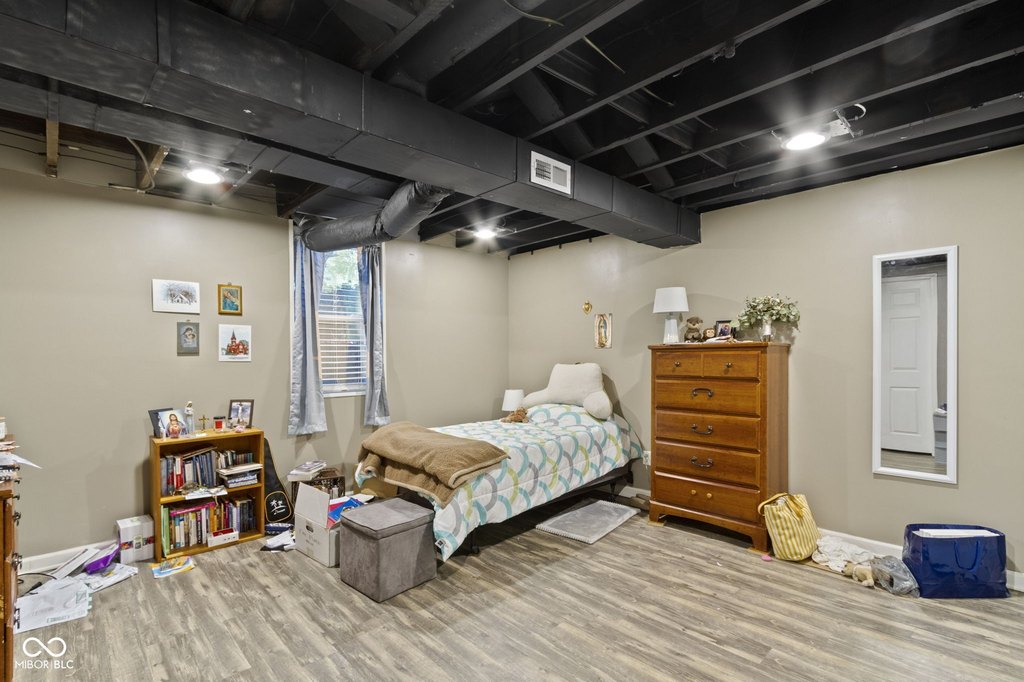
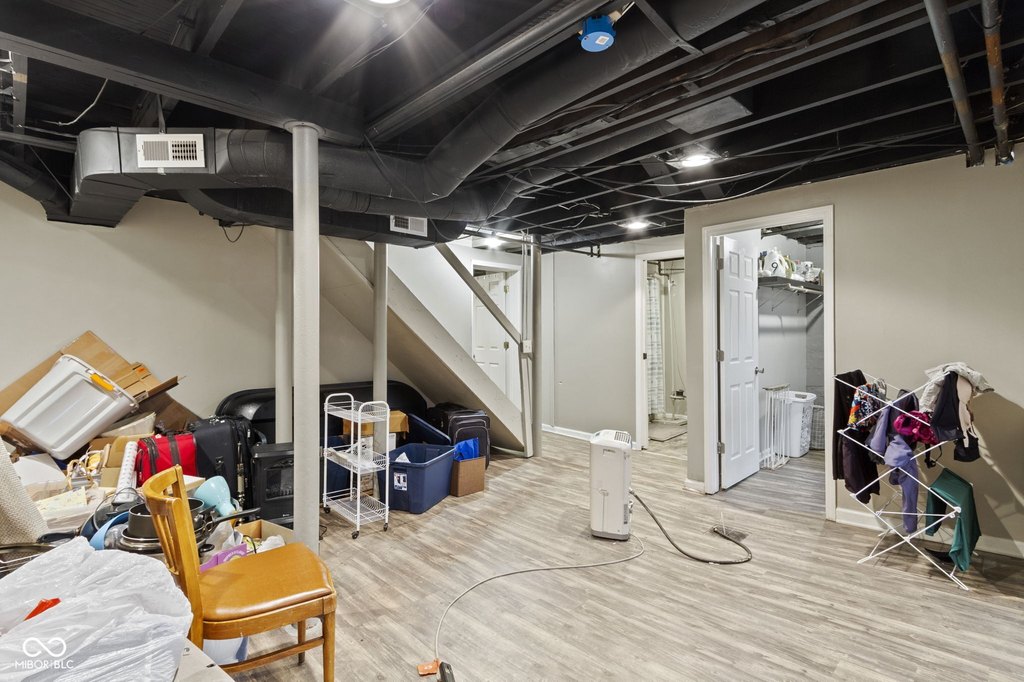
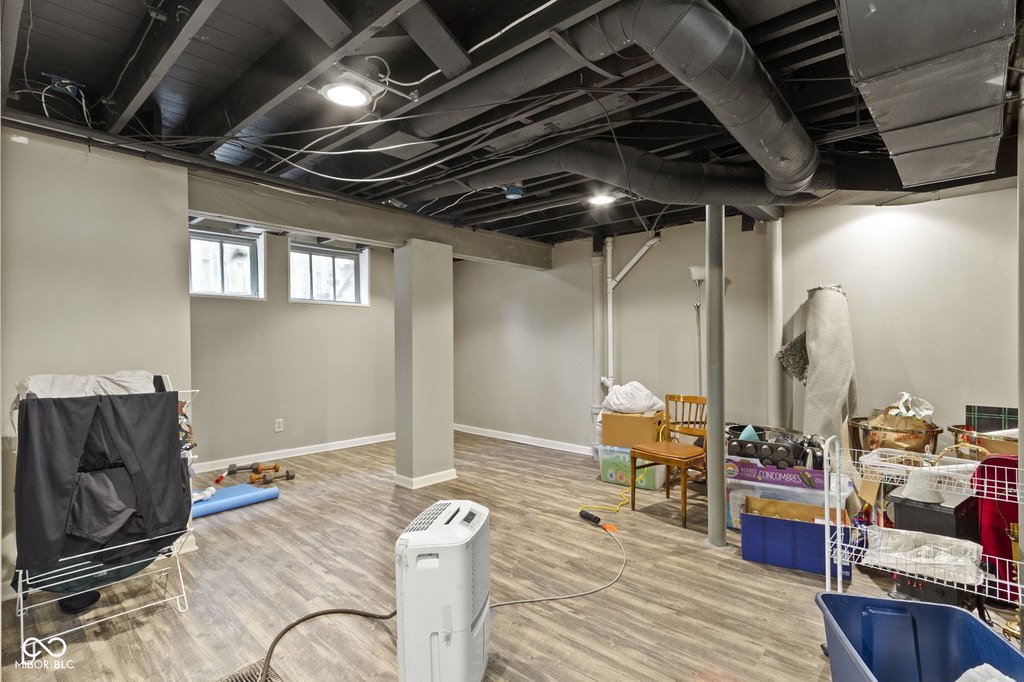
Basement
Finished
Subdivision
Mengs Park Ave
Lot features
Access, City Lot, Corner Lot, Curbs, Sidewalks, Mature Trees
High school
Shortridge High School
Elementary school district
Indianapolis Public Schools
Middle school district
Indianapolis Public Schools
High school district
Indianapolis Public Schools
Directions
GPS Friendly
Standard status
Active
APN
490612108002000801
Lot size
0.20 Acres
Taxes and HOA fees
Tax Year
2025
Tax Description
Mengs Park Ave Sub L1
Tax Annual Amount
13492
Legal Description
Mengs Park Ave Sub L1
Utilities
Heating system
Natural Gas, Forced Air
Cooling system
Central Air
Amenities
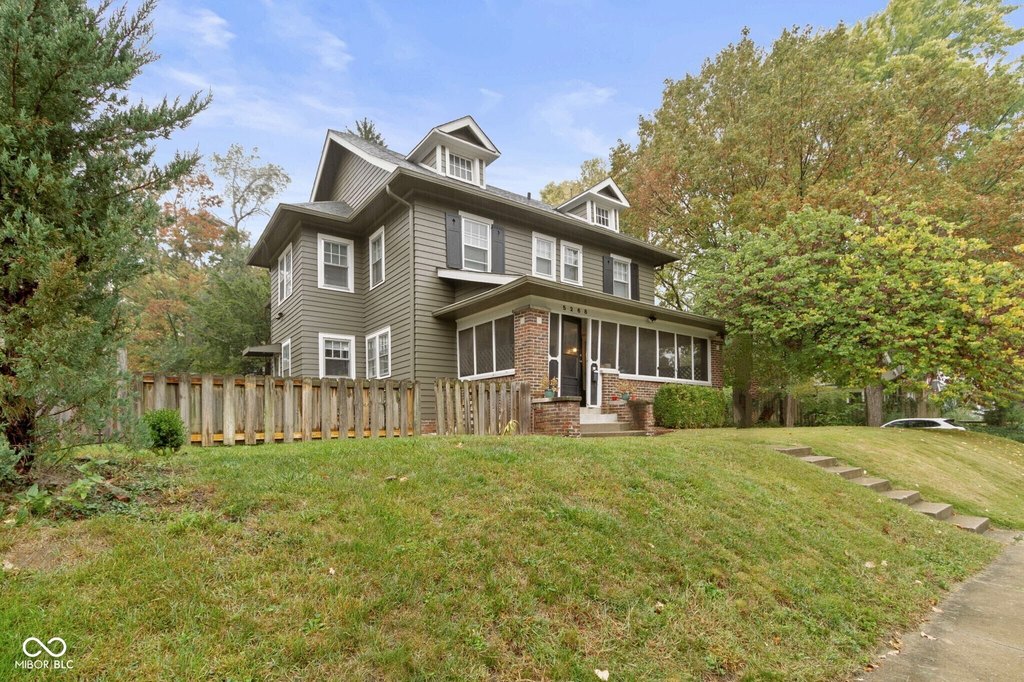
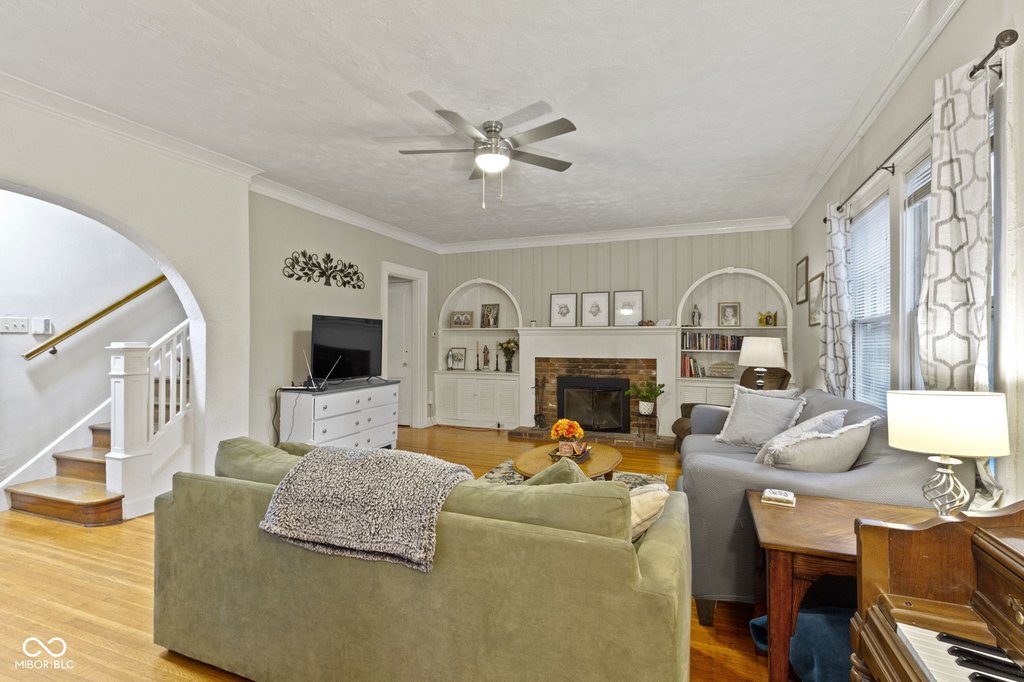
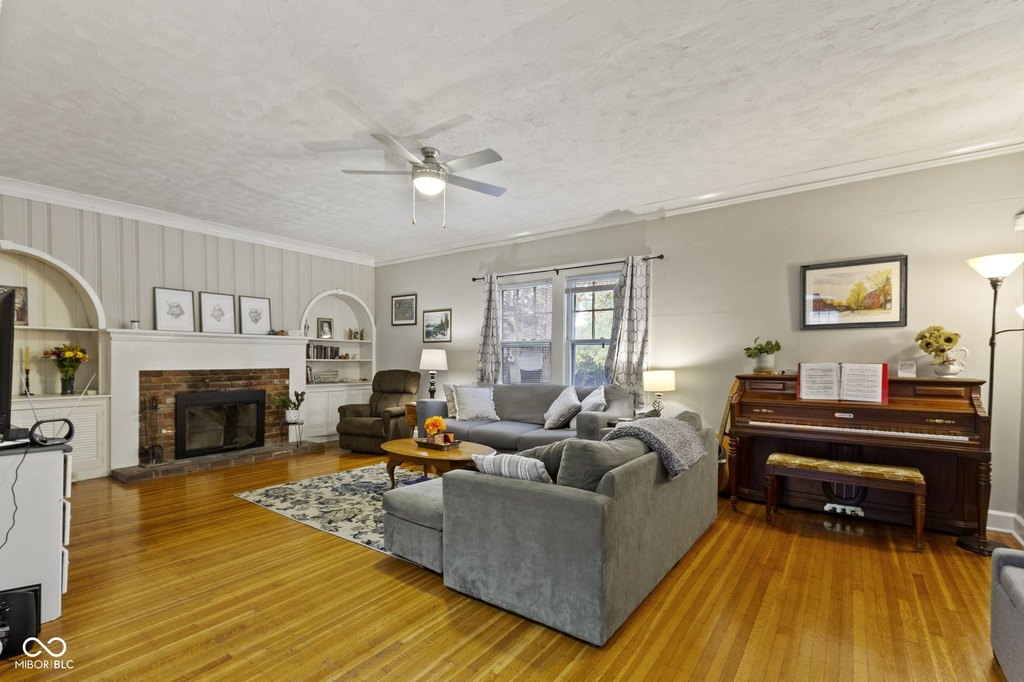
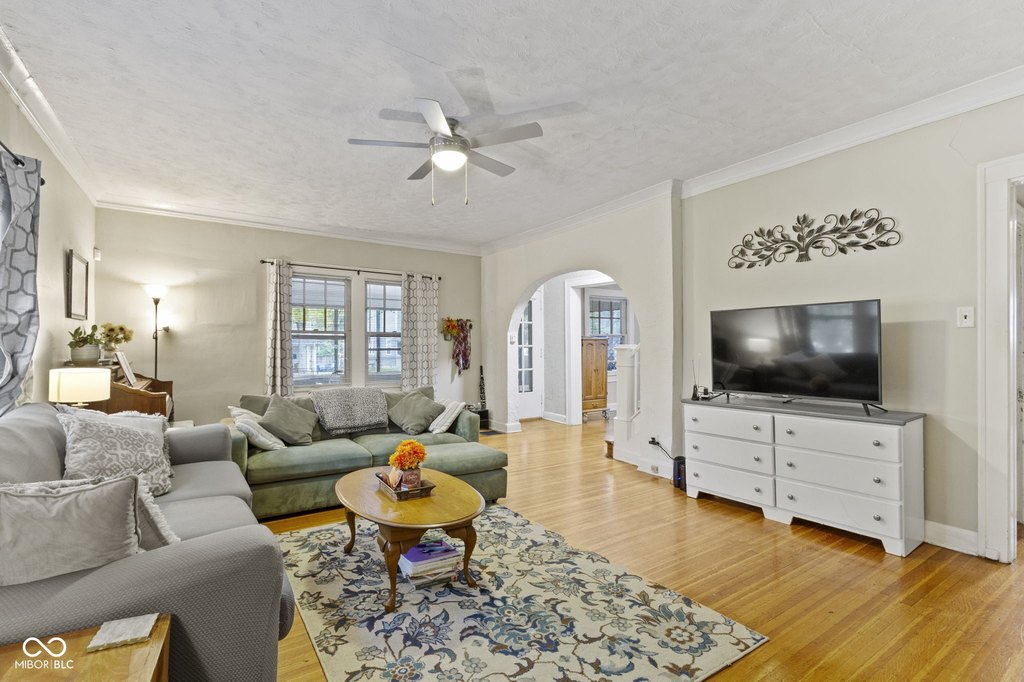
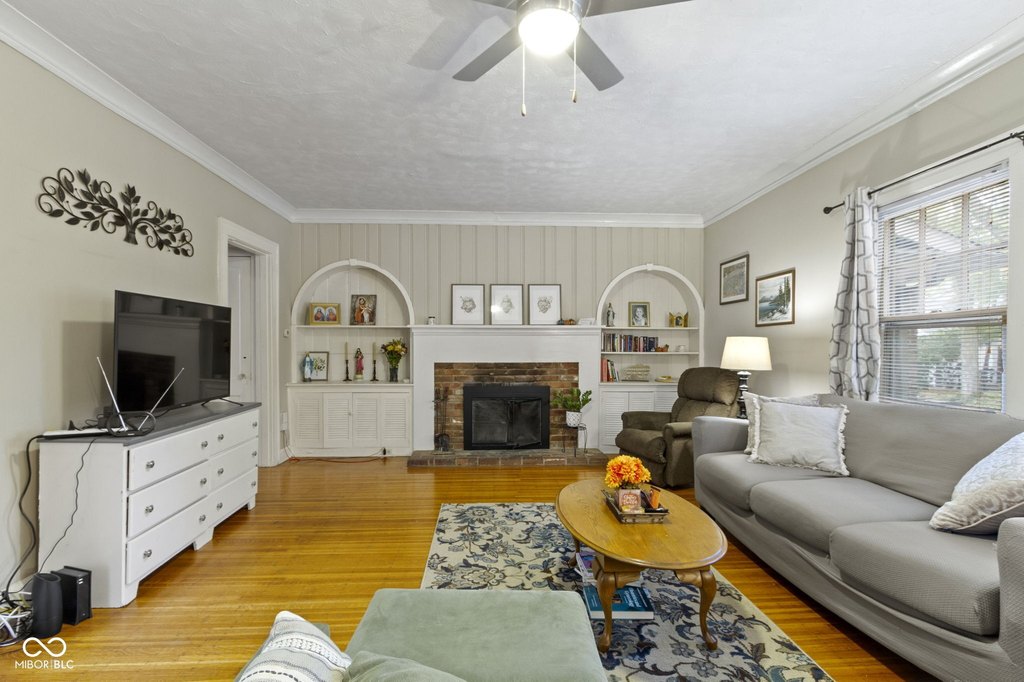
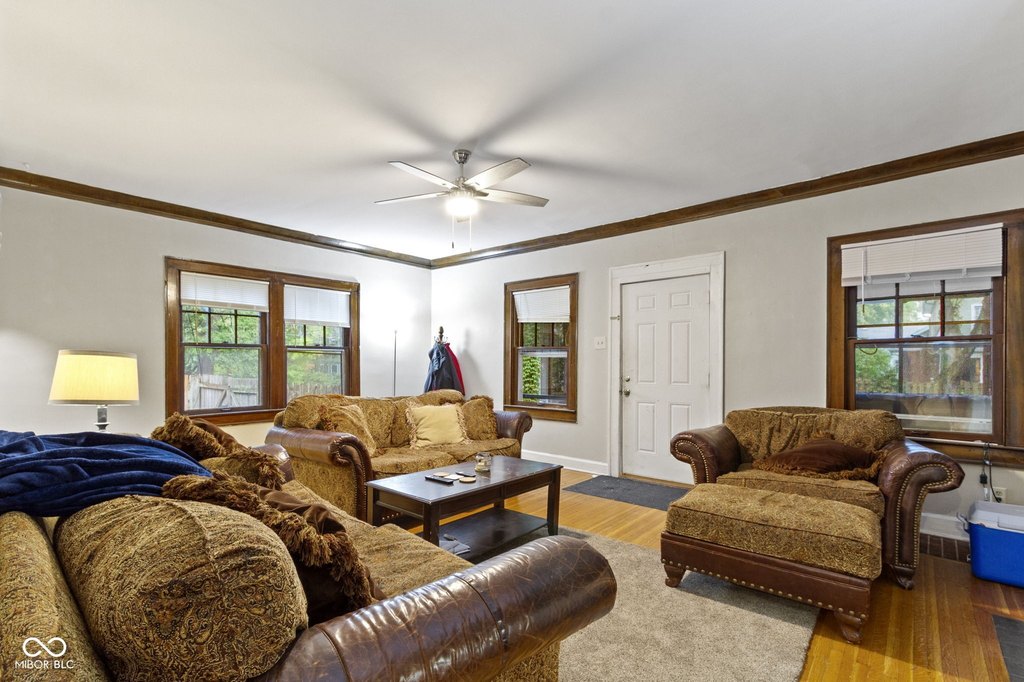
wood burning fireplace
built-in bookcases
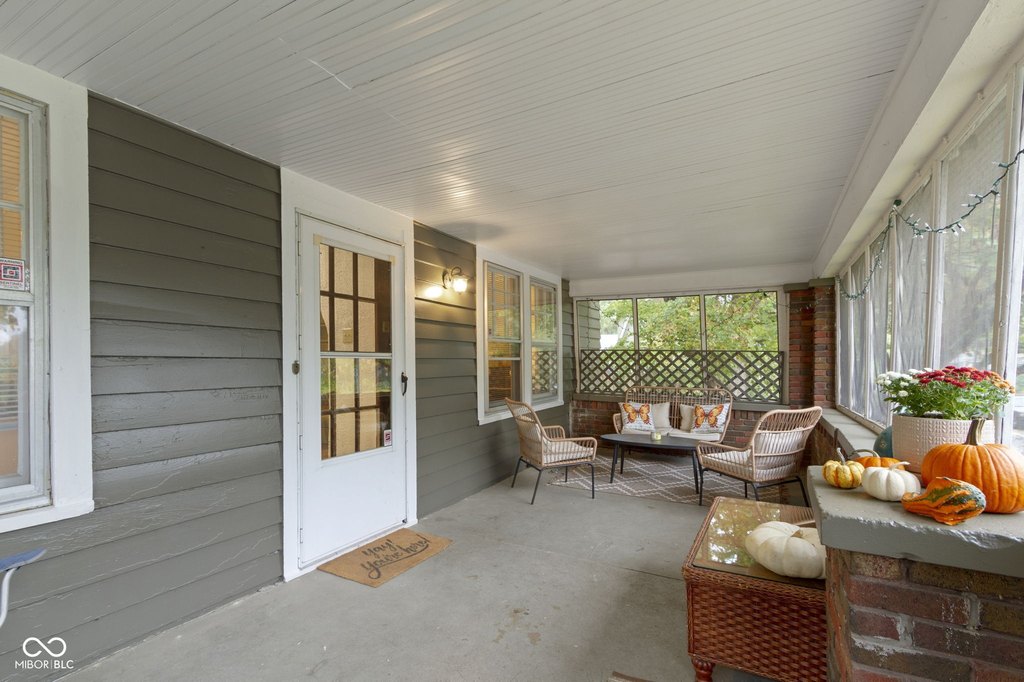
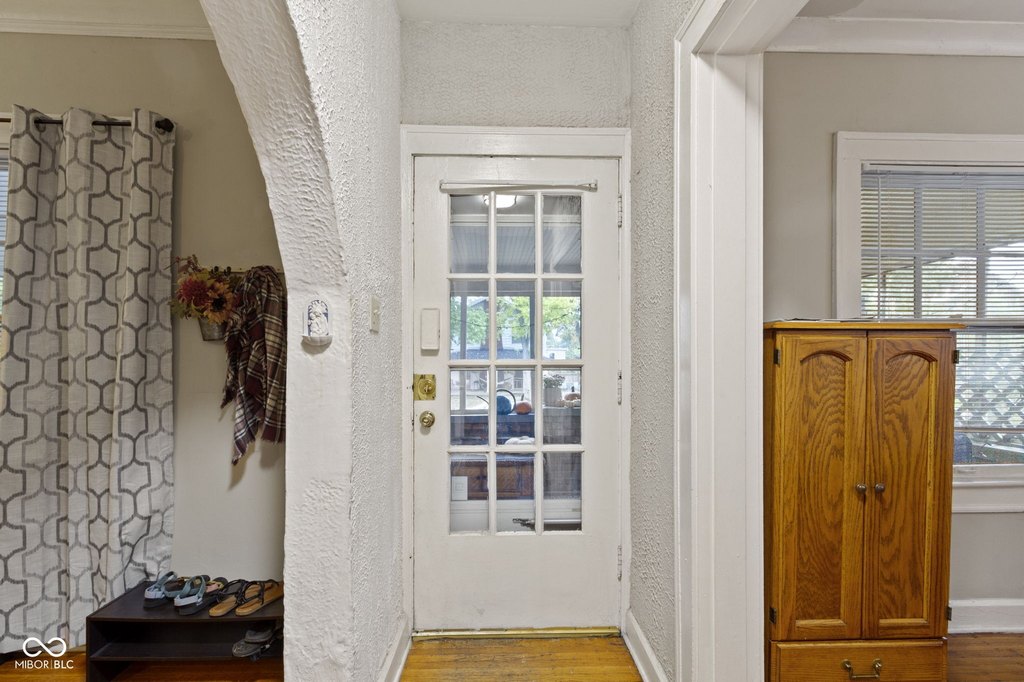
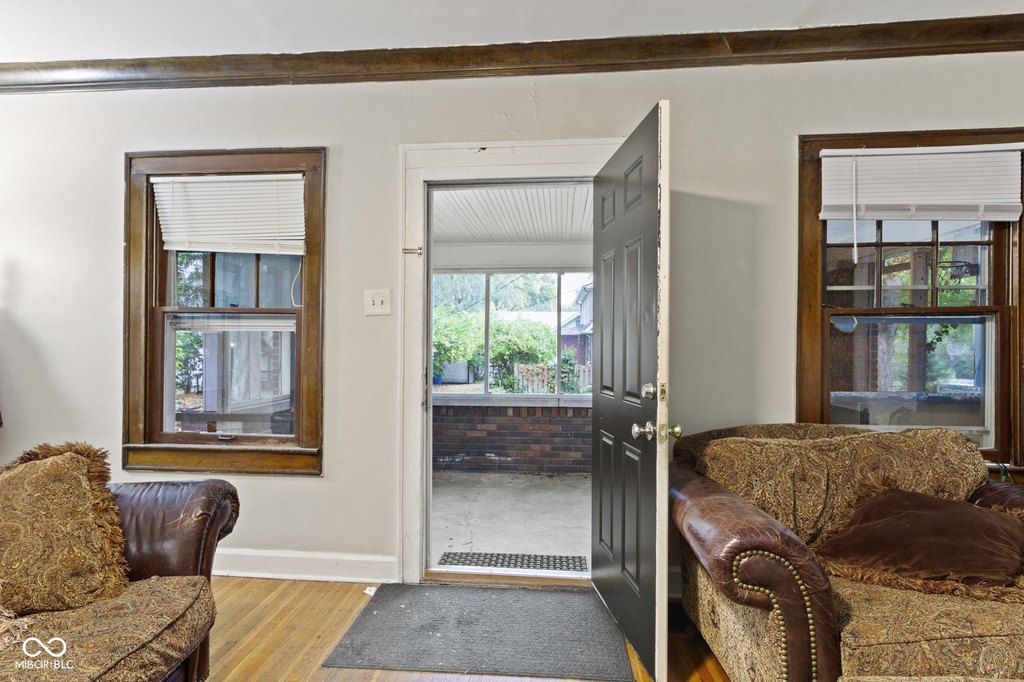
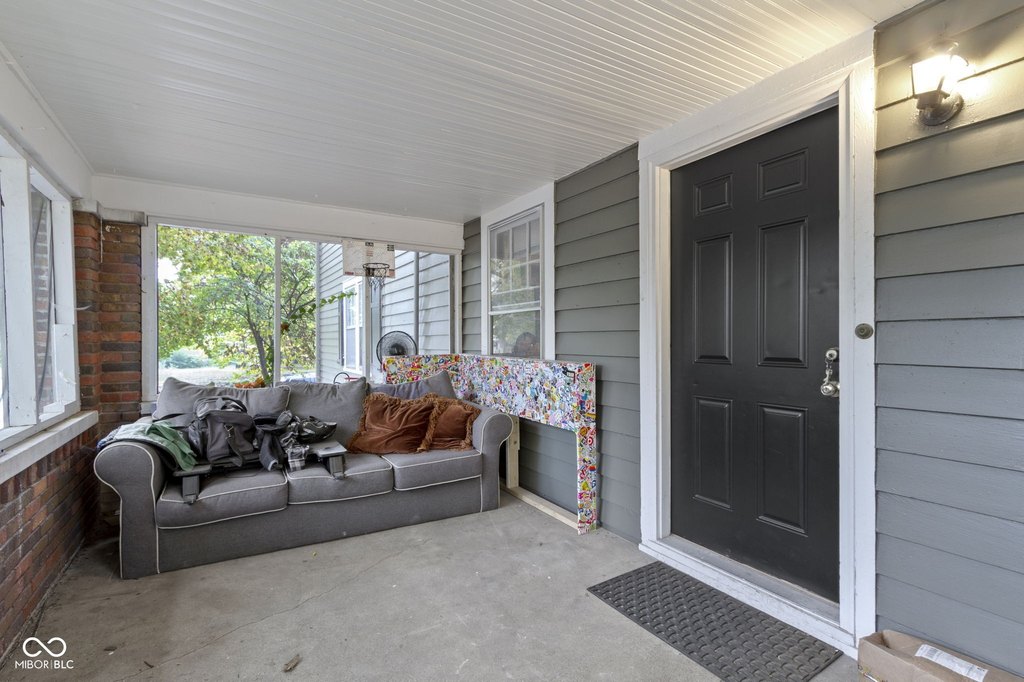
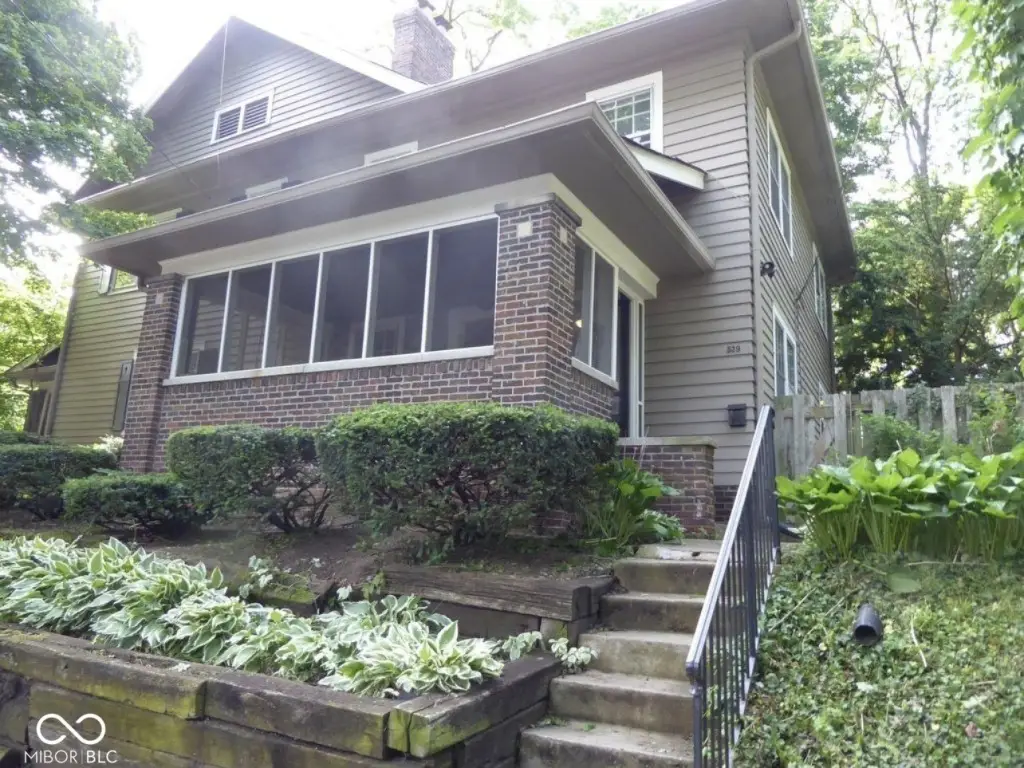
screened front porch
fenced yards
central air conditioning
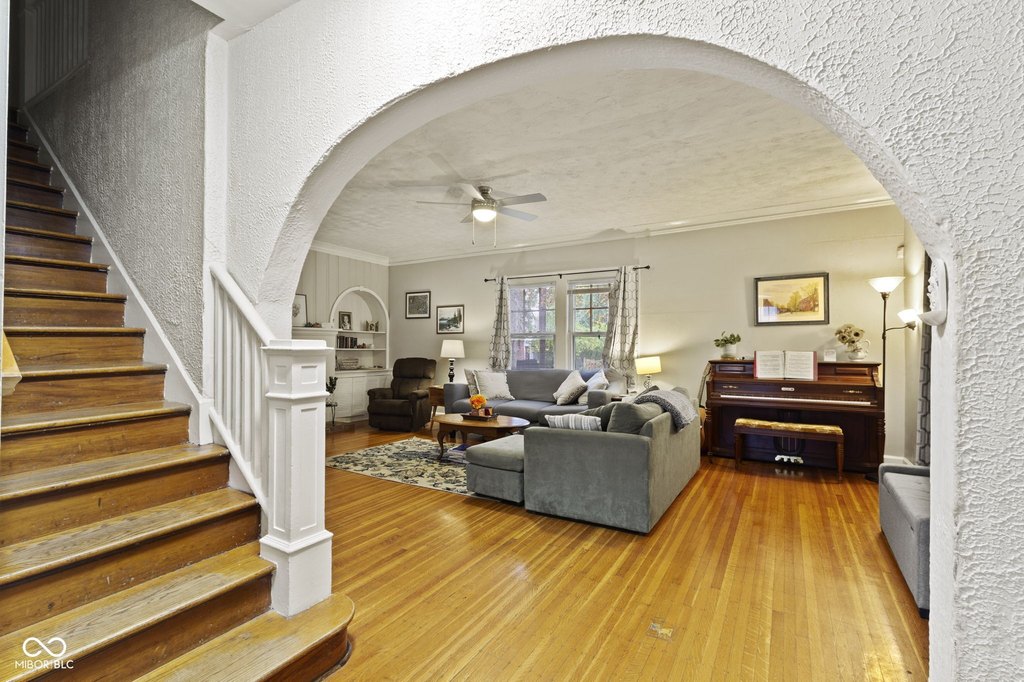
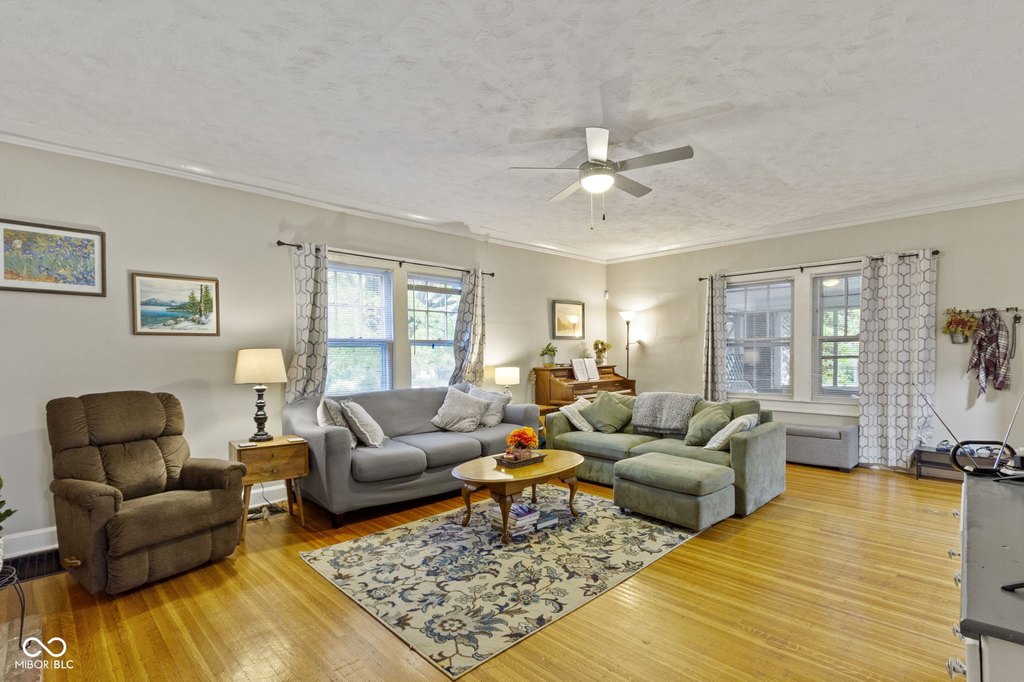
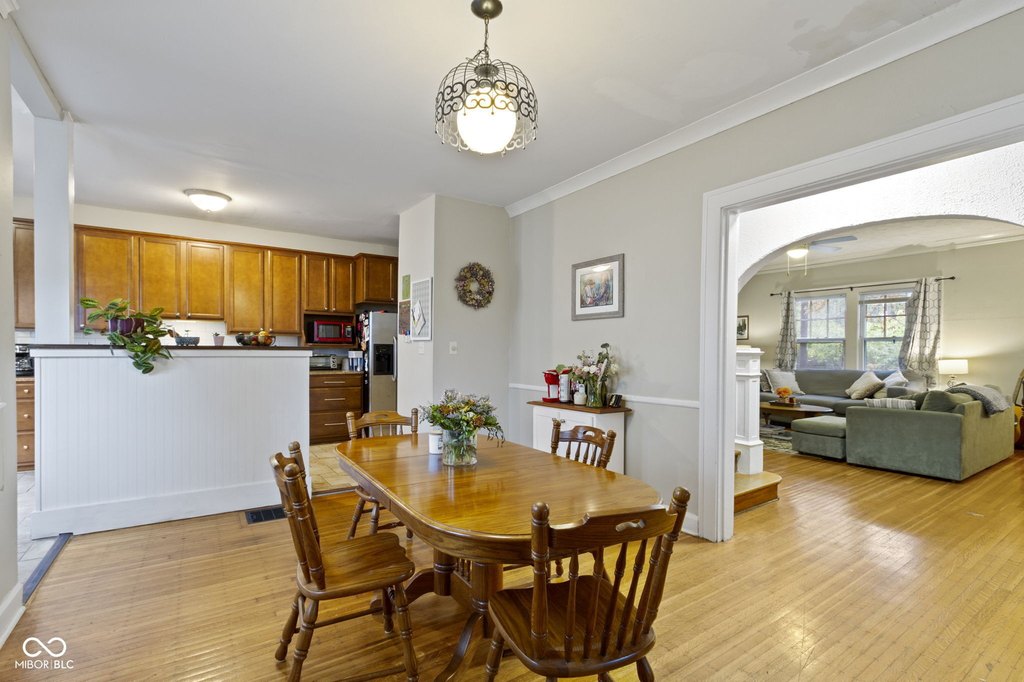
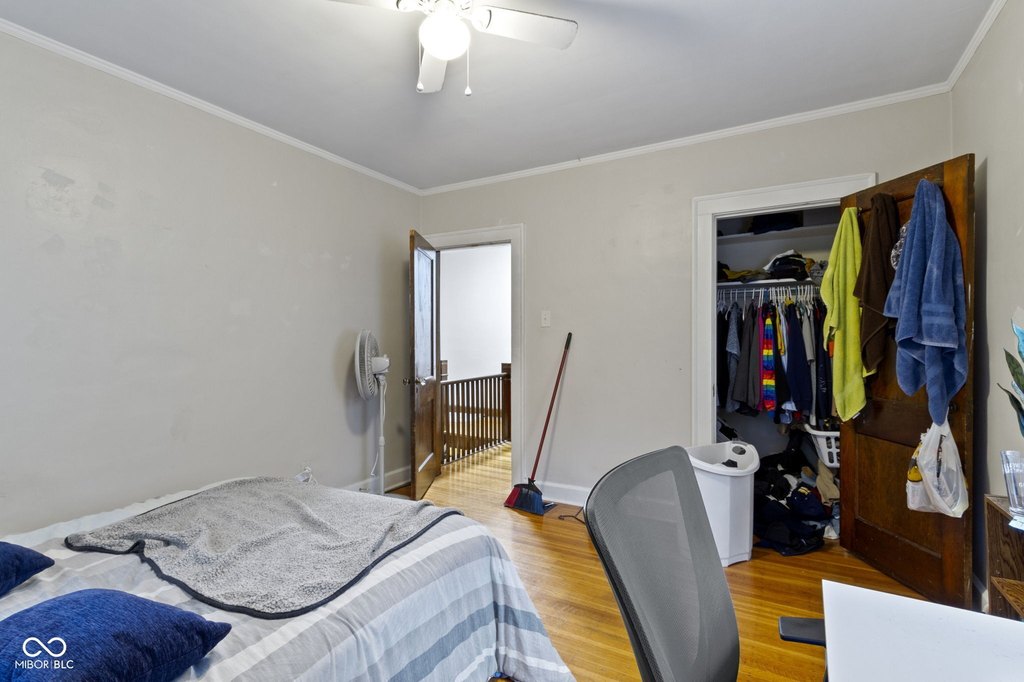
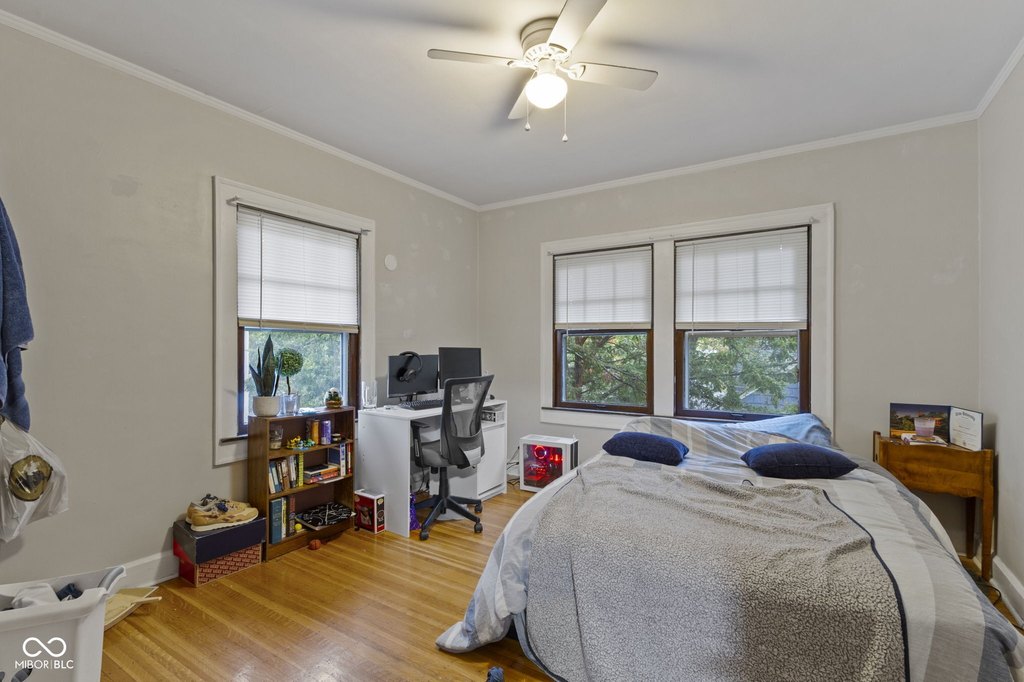
hardwood floors
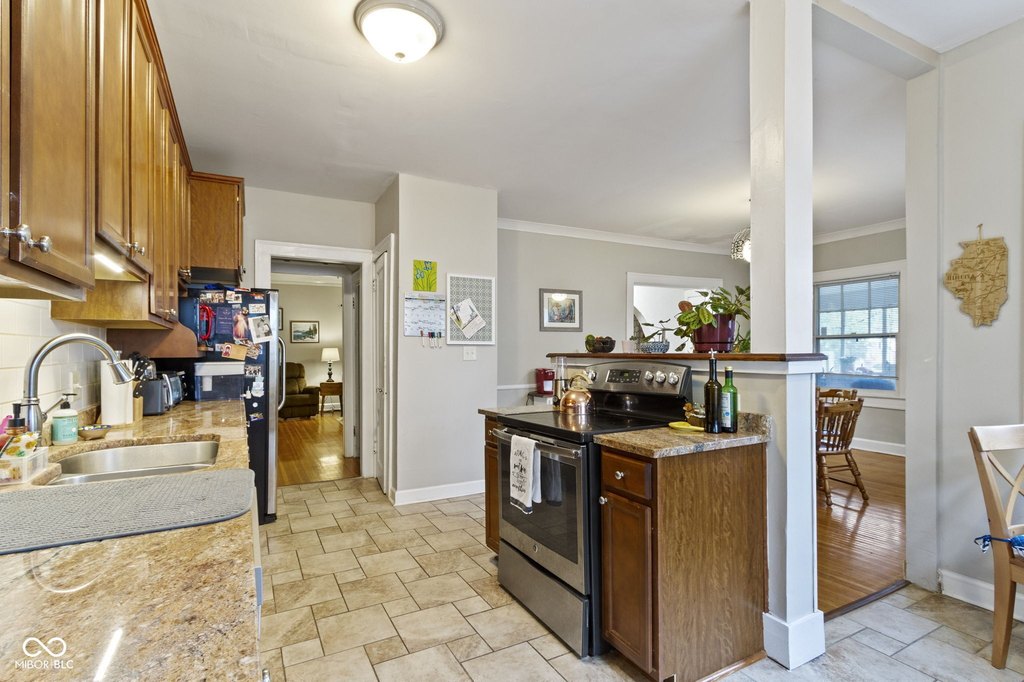
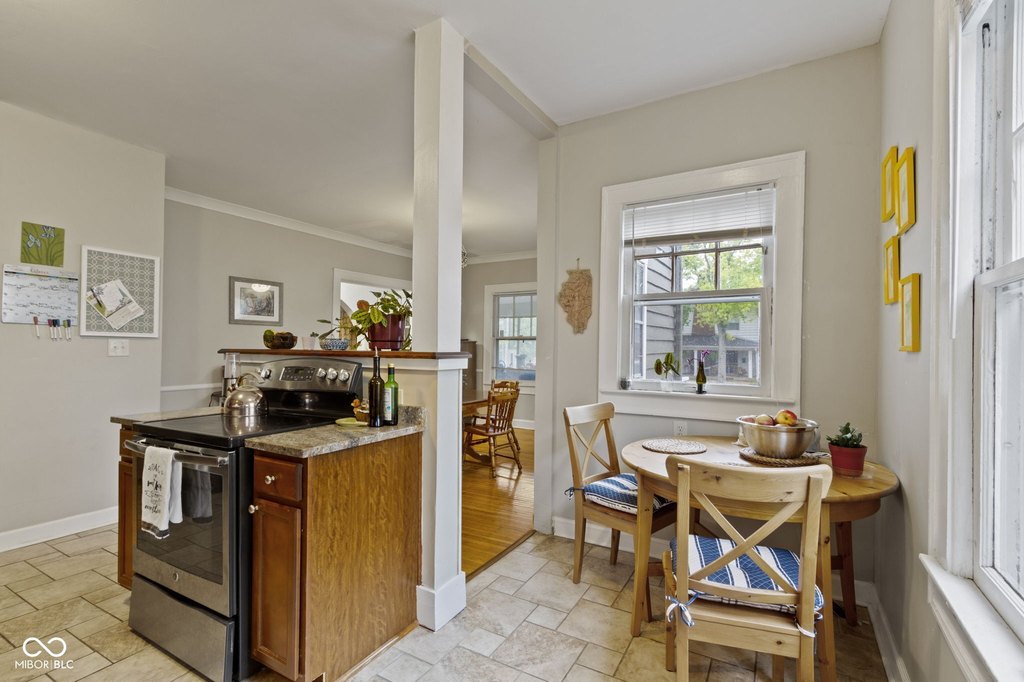
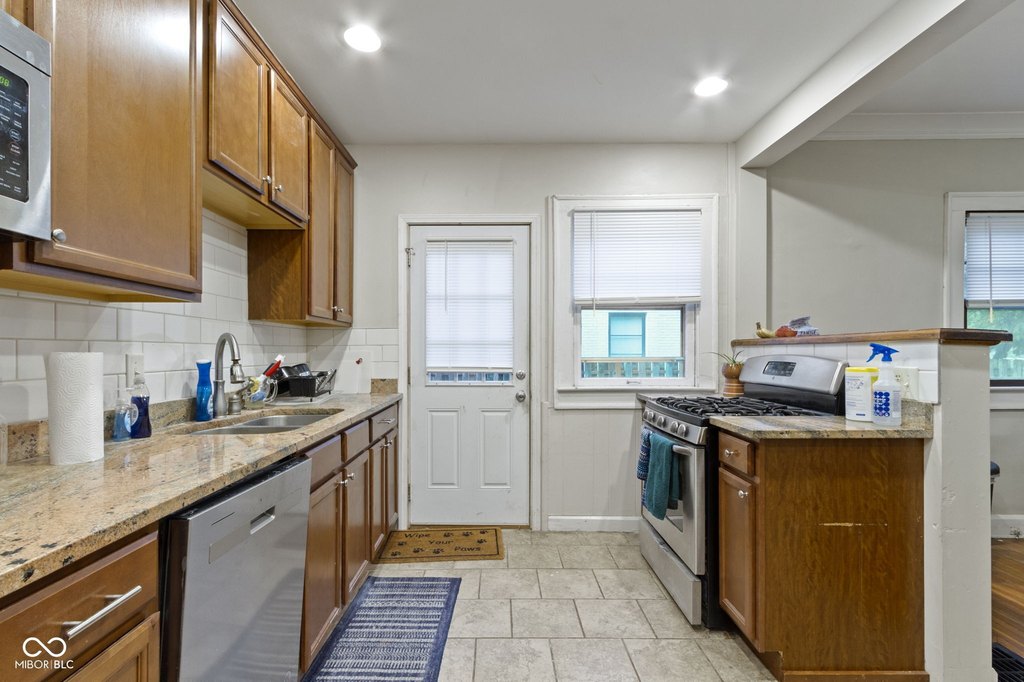
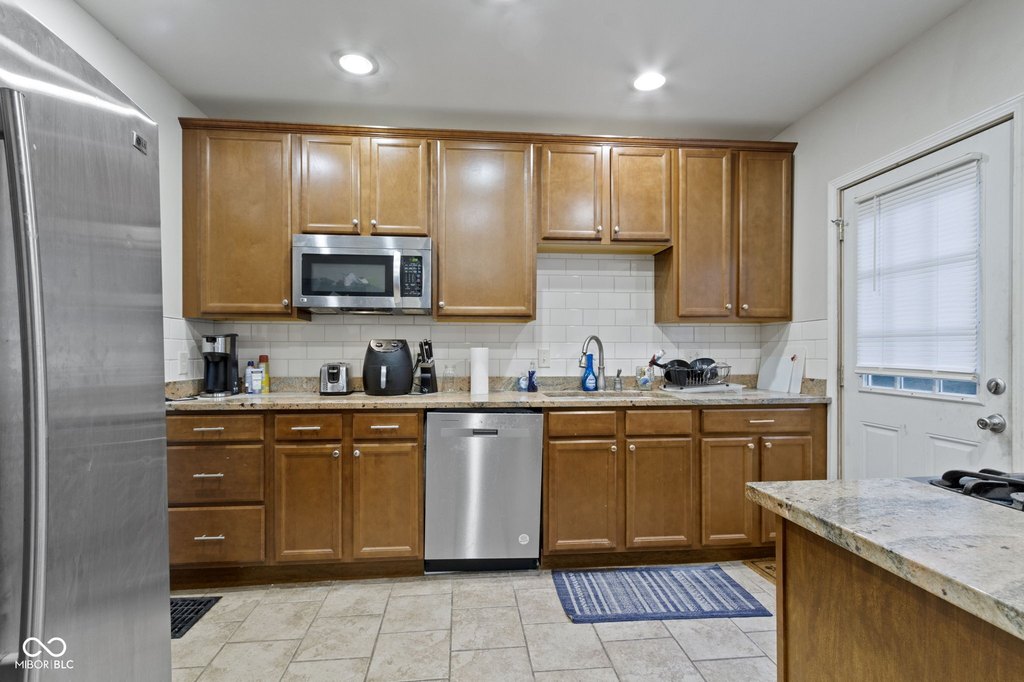
stainless steel kitchen appliances
washer/dryer
Building Details
Year built
1924
Floors in Building
2
Number of units
2
Building materials
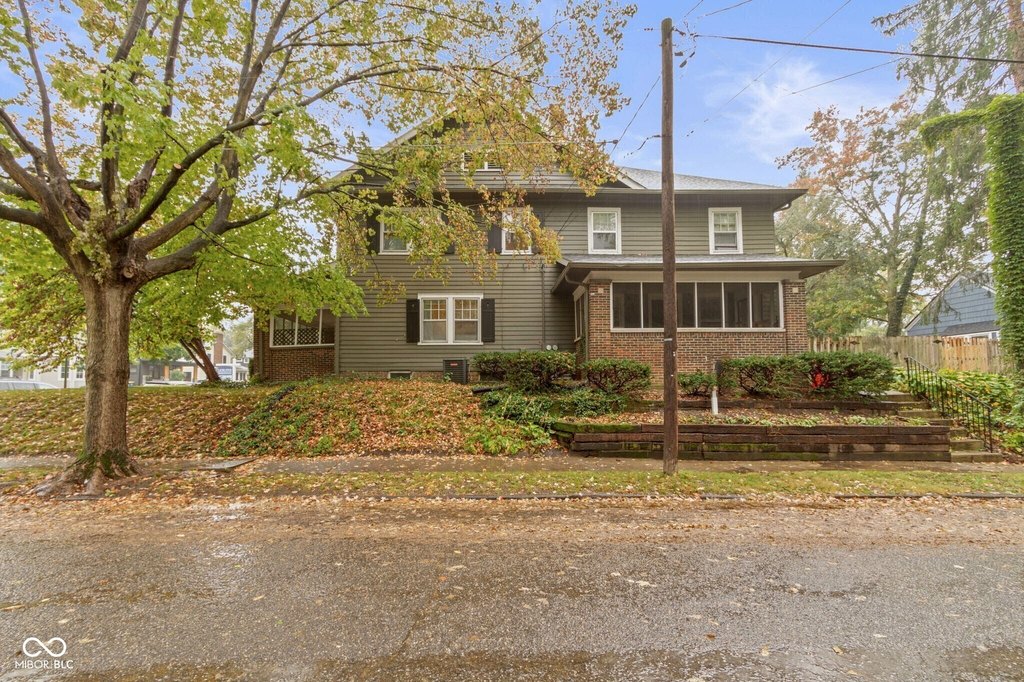
Brick, Wood Siding
Roof type
Shingle
Architectural style
Craftsman
Listing Agency:
Liberty Real Estate, LLC.
(866) 973-6660
Listed By:
Lisa Meulbroek · License #RB14026284
(317) 570-3639 x227
Added: Aug 28
Changed: Sep 12
Last Checked: Oct 16 at 4:06AM
MLS# 22122959
Copyright © 2026 Broker Listing Cooperative®. All rights reserved. All information provided by the listing agent/broker is deemed reliable but is not guaranteed and should be independently verified.

Ask AI about this property
Review the available facts, identify missing information and prepare questions for the agent.
Investment Insights
Based on property information with market context.
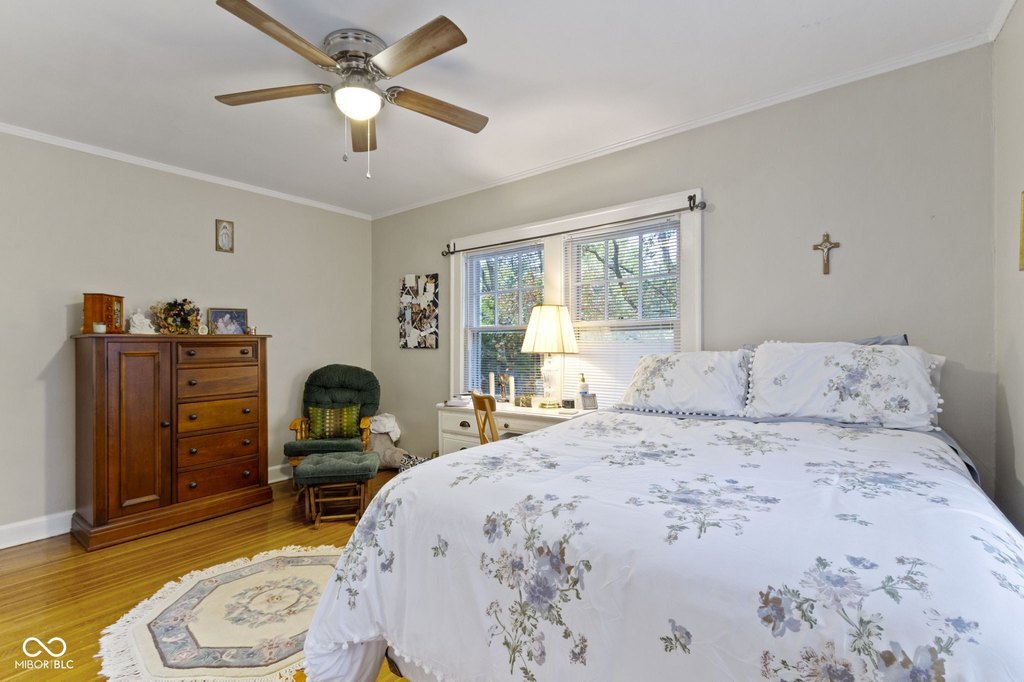
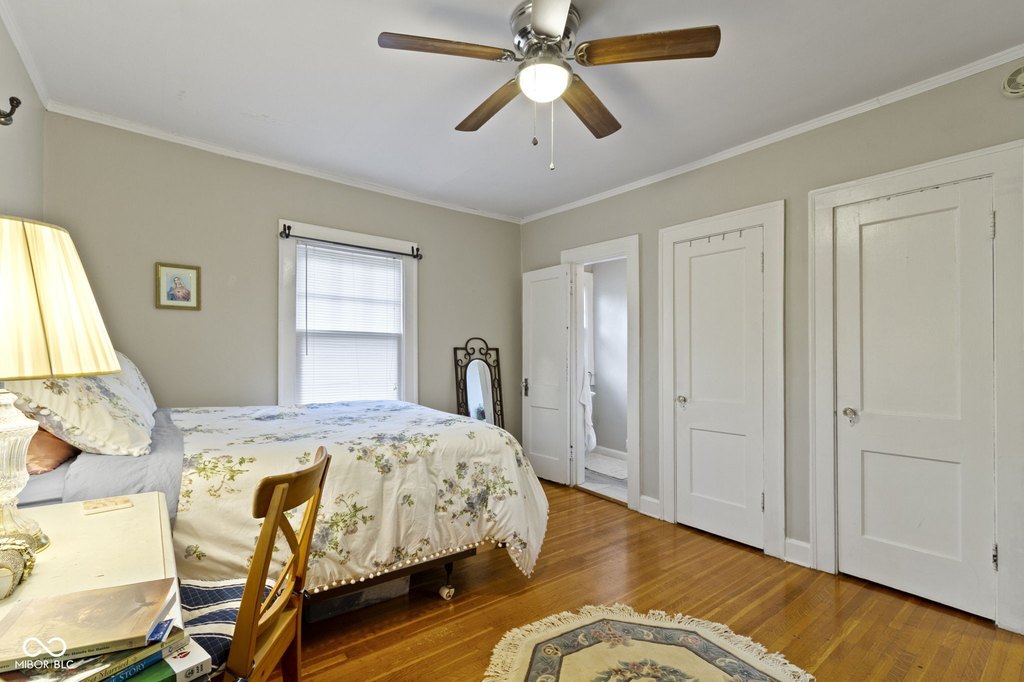
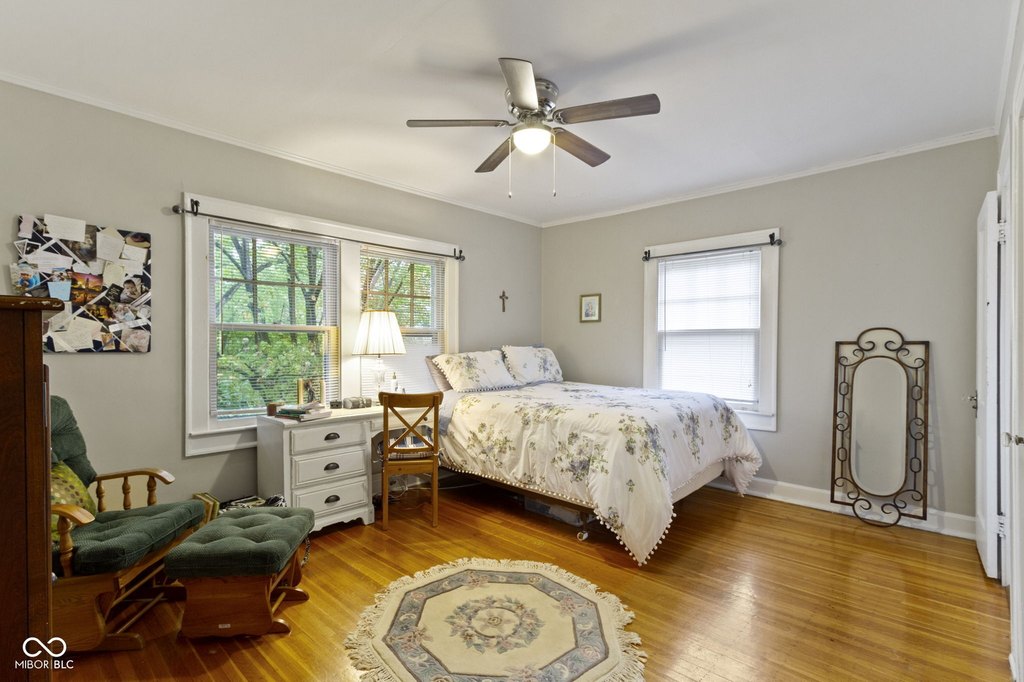
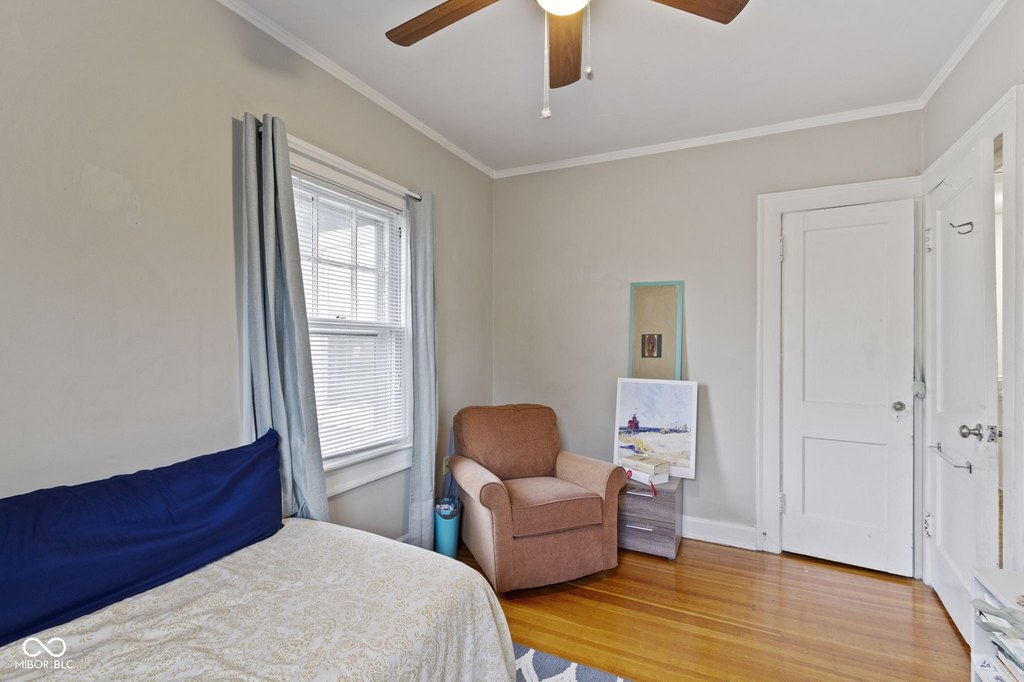
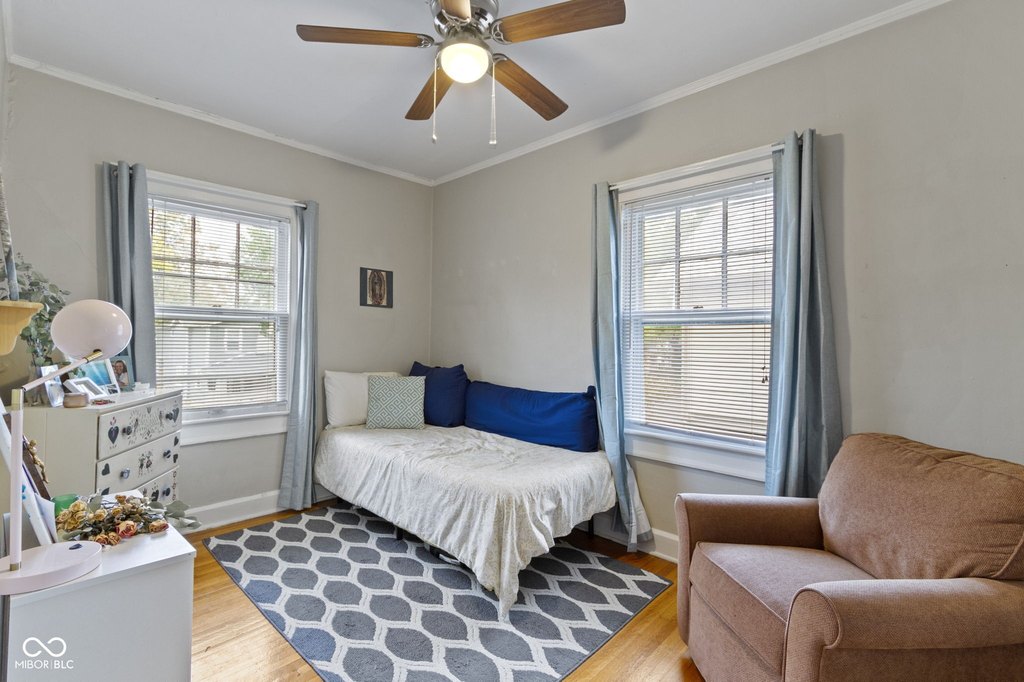
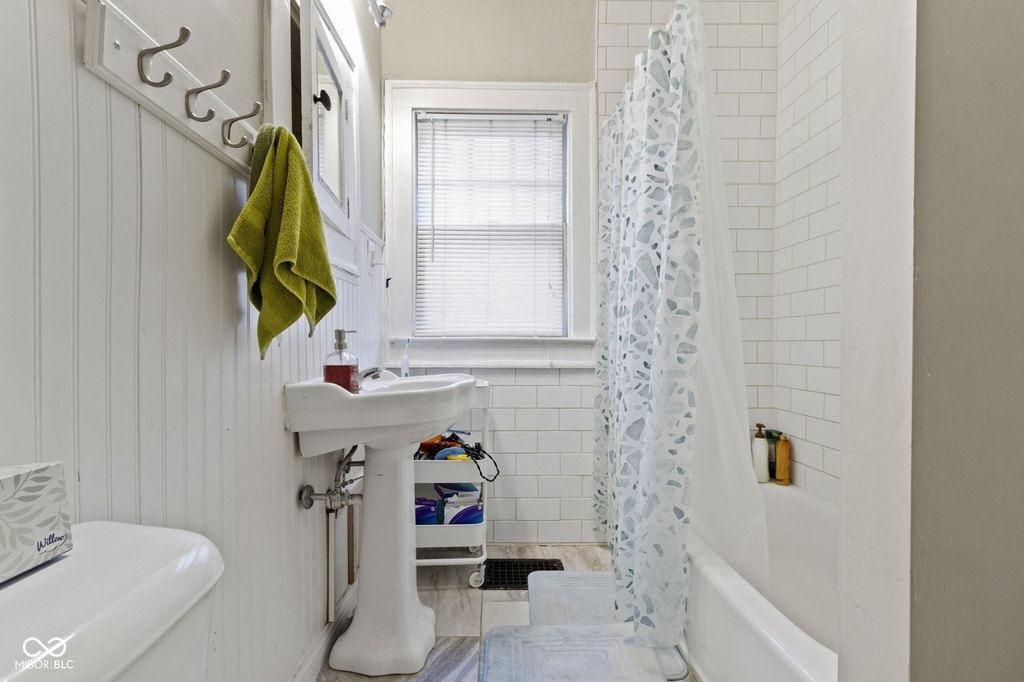
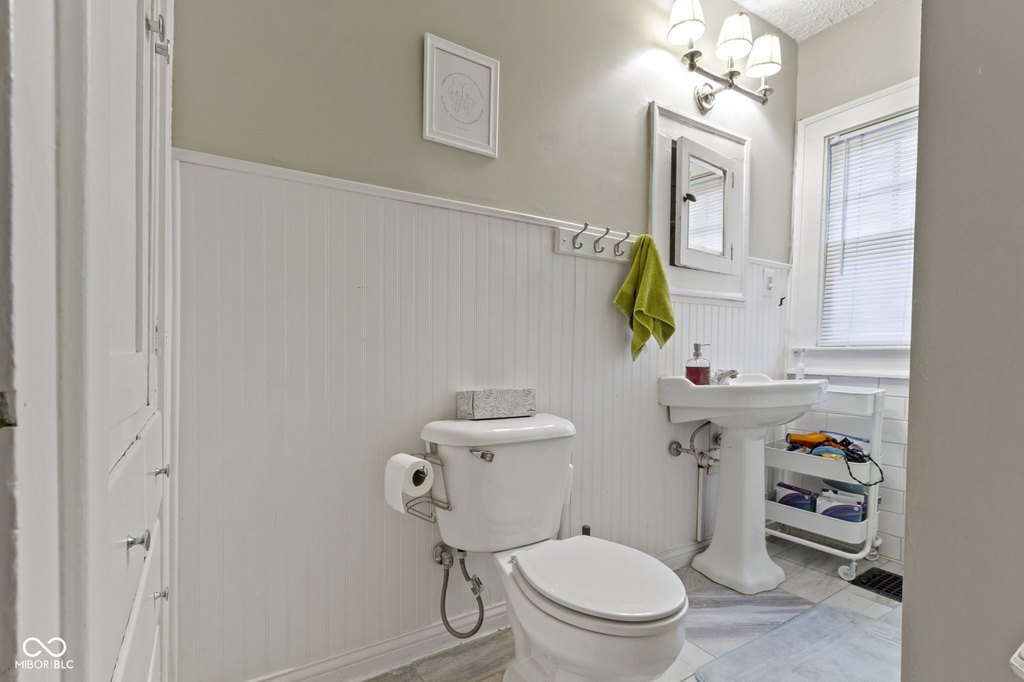
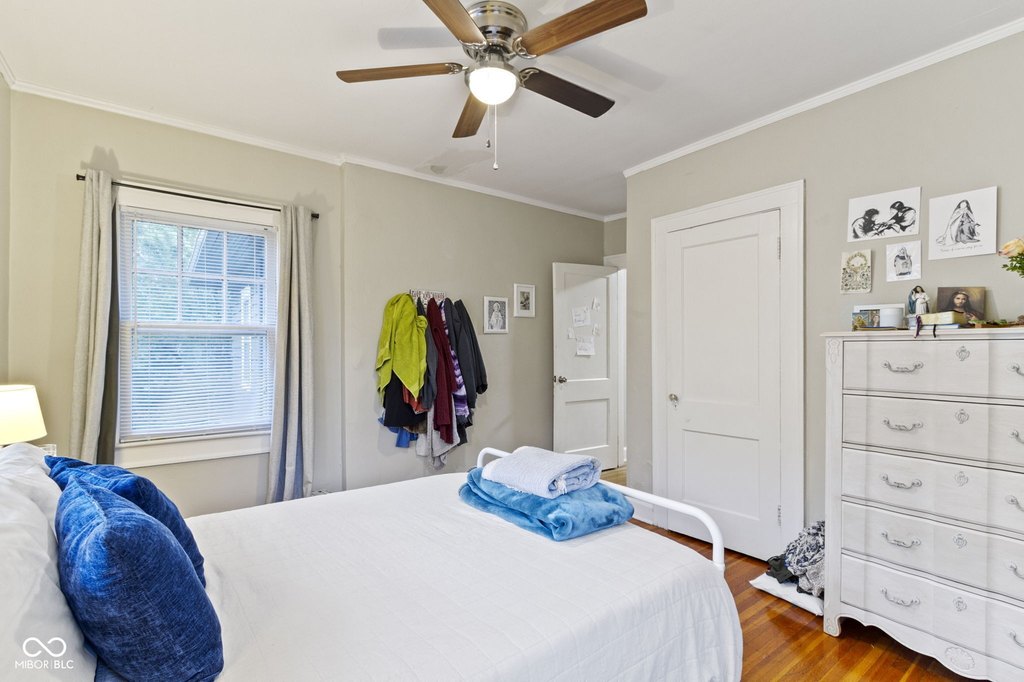
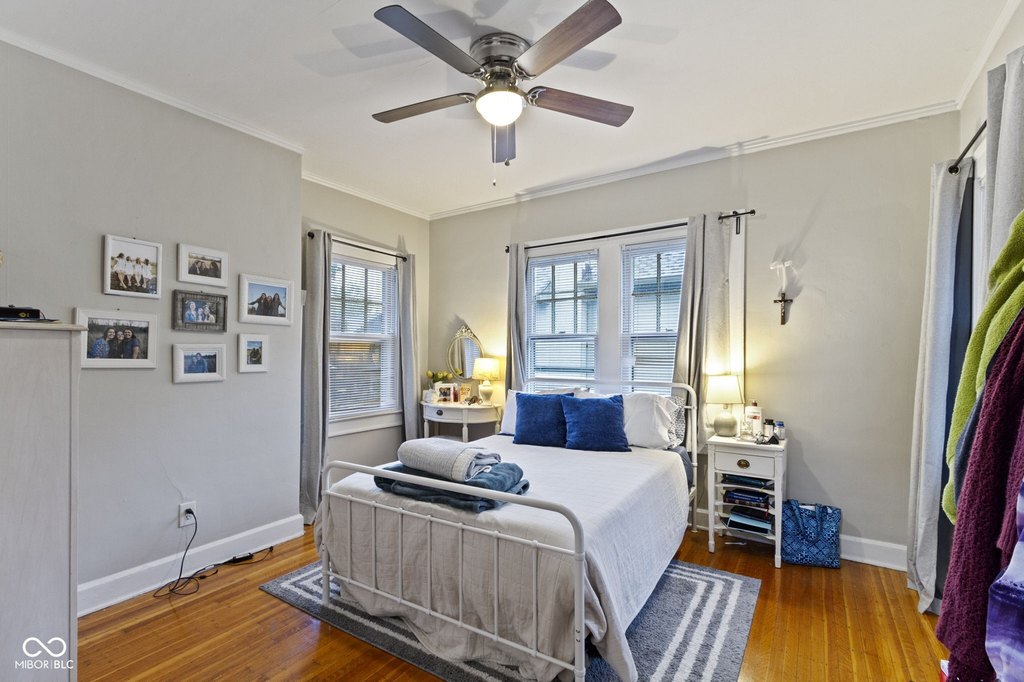
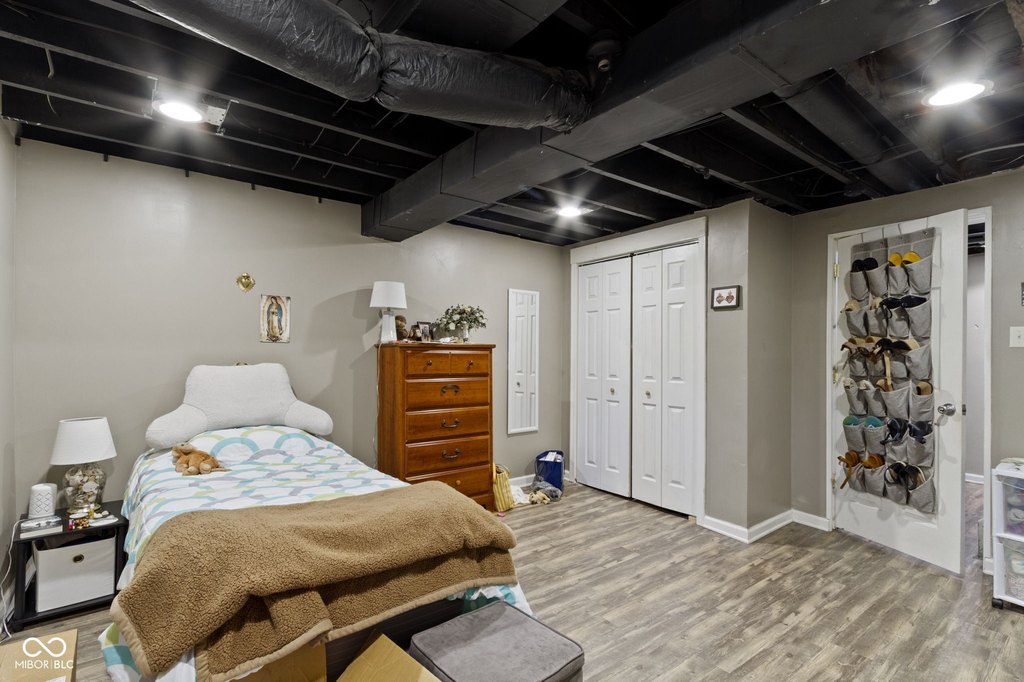
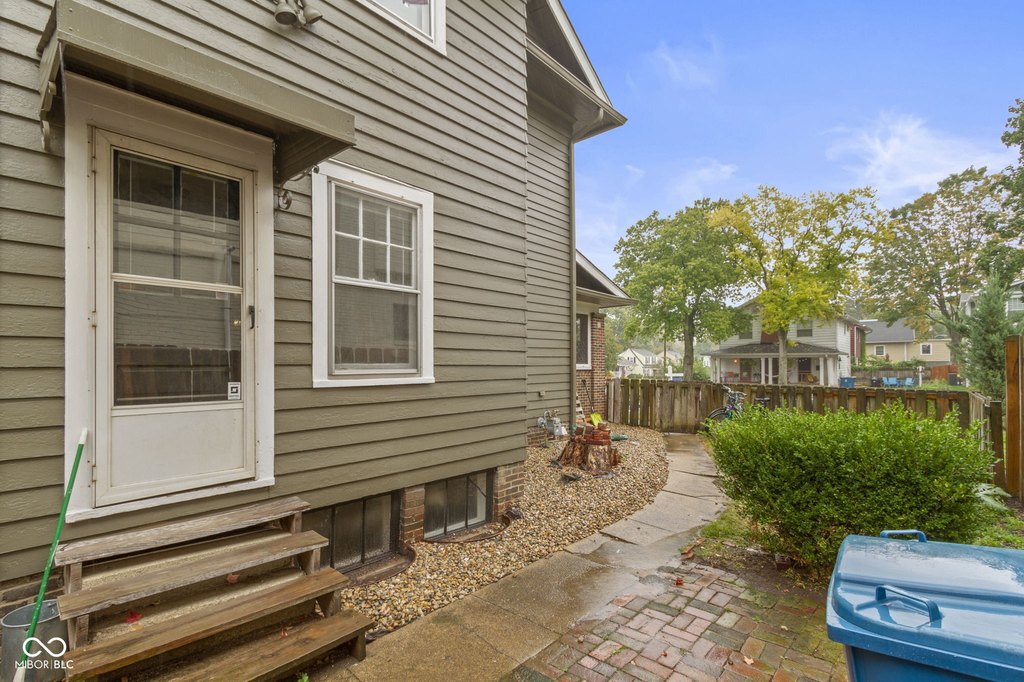
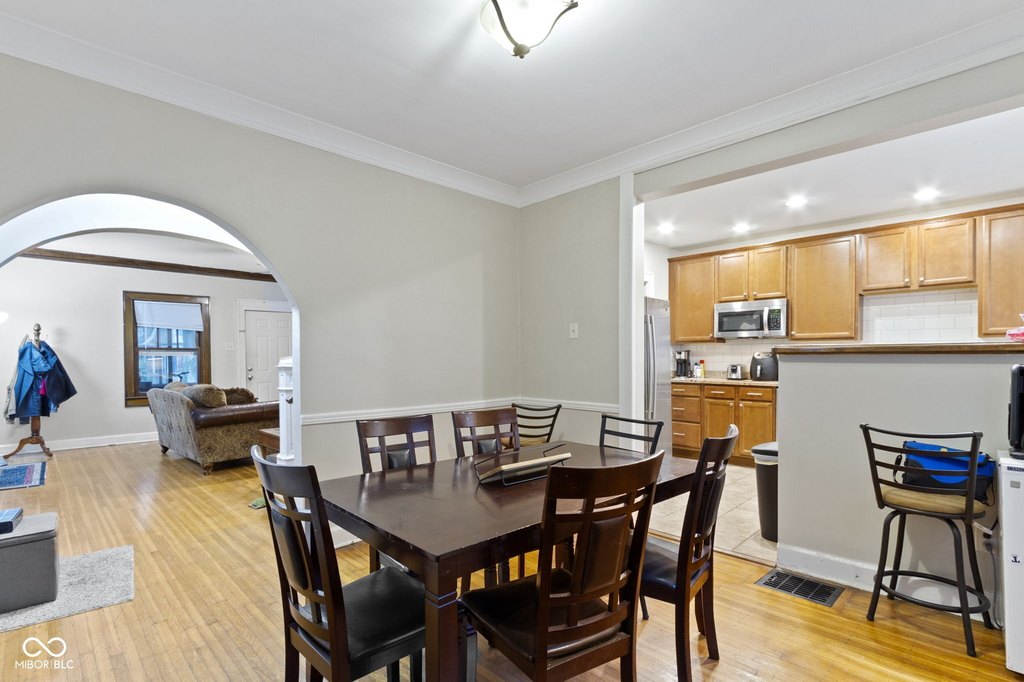
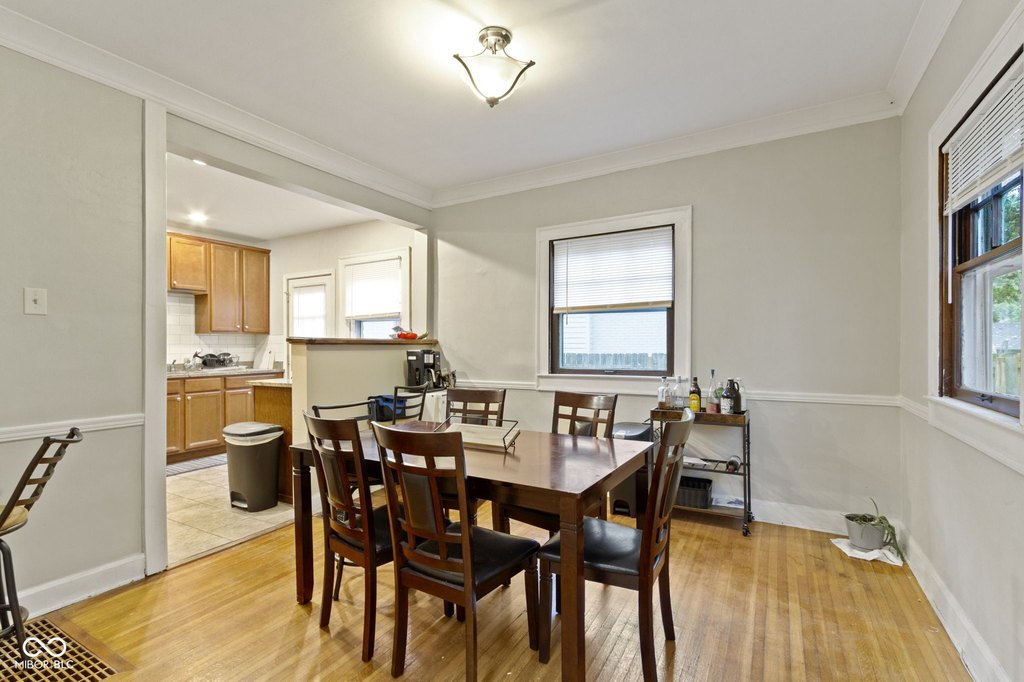
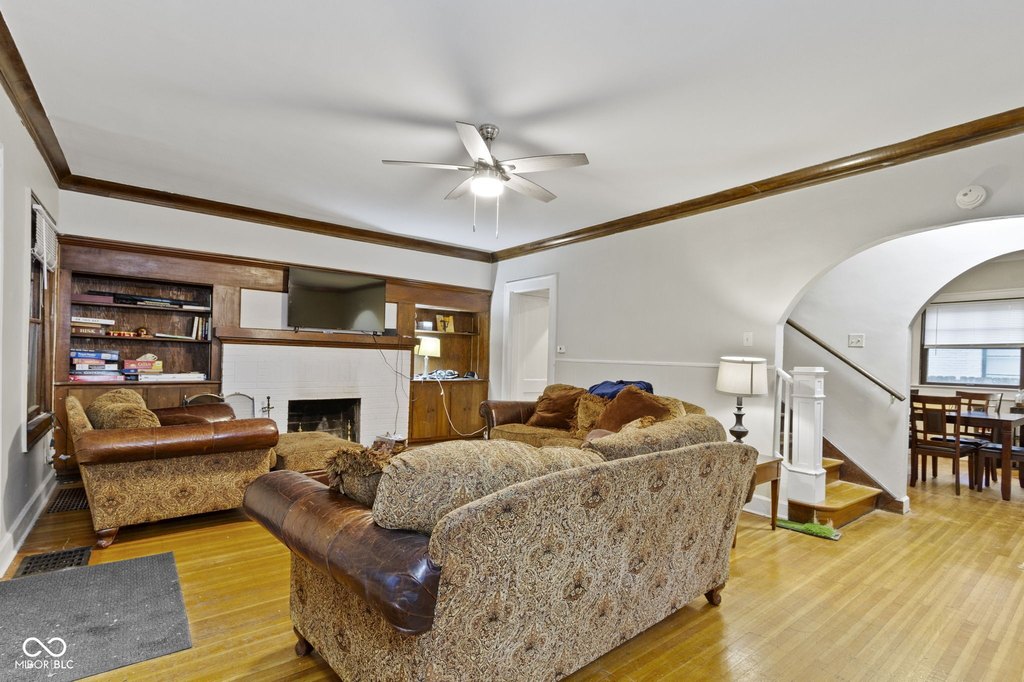
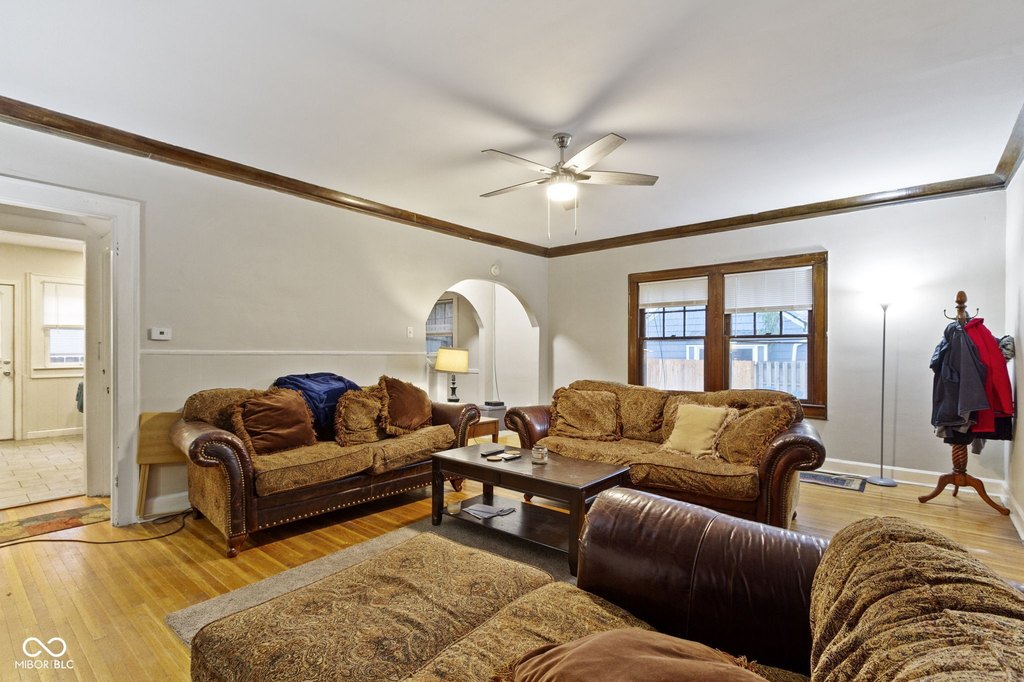
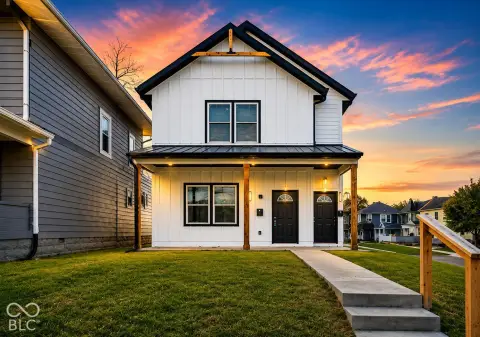
This Craftsman duplex, built in 1924, contains approximately 4,040 finished square feet across two residential units on a corner lot. One unit includes five bedrooms and 2.5 bathrooms; the other provides four bedrooms and two bathrooms. Both residences feature hardwood floors, finished basements, wood-burning fireplaces with built-in bookcases, screened front porches, fenced yards, and central air conditioning. Each basement adds a bedroom with an egress window, a full bathroom, and a bonus room. The property also includes stainless steel kitchen appliances and two washer-and-dryer sets. Natural gas forced-air heating serves the building.
Located at 539 E 53rd Street in Indianapolis, the property offers access to Broad Ripple, the Monon Trail, and Downtown Indianapolis, which is approximately 15 minutes away. The surrounding area provides access to restaurants, shopping, entertainment, parks, employment centers, and city amenities. The property is zoned Residential and has a 0.2-acre lot.
Located at 539 E 53rd Street in Indianapolis, the property offers access to Broad Ripple, the Monon Trail, and Downtown Indianapolis, which is approximately 15 minutes away. The surrounding area provides access to restaurants, shopping, entertainment, parks, employment centers, and city amenities. The property is zoned Residential and has a 0.2-acre lot.
Key Highlights
- Approximately 4,040 finished square feet on a 8,590 sq ft corner lot
- Two units: one with 5 bedrooms and 2.5 bathrooms; one with 4 bedrooms and 2 bathrooms
- 26 years of continuous rental history
Financial Insights
Estimated NOI and Cap Rate
NOI / Yr
$42,639
Cap Rate
6.32%
Suggested Prices Based on Cap Rates
Cap Rate 5%
$852,780
$852.8K
Cap Rate 7%
$609,129
$609.1K
Cap Rate 9%
$473,767
$473.8K
Market Conditions
NOI Build-Up for 4,040 SF
Gross rent
$65.4K $16.20/SF
− Vacancy
−$4.5K −$1.12/SF
EGI
$60.9K $15.08/SF
− OpEx
−$18.3K −$4.52/SF
NOI
$42.6K $10.55/SF
Area
Indianapolis, IN
Vacancy
6.93%
Lease Rate
$16.20 /SF/Yr
Expense Ratio
30.00%
Simulate Cap Rate and NOI
Suggested Prices Based on Cap Rates
Cap Rate 5%
$852,780
Cap Rate 7%
$609,129
Cap Rate 9%
$473,767
Alternative Uses
Best Use
Multifamily LT 5
$609.1K
$533.0K – $710.7K
NOI $42,639 @ 7.0% cap · market cap 6.32%
Second Best
Apartment 5plus
$529.7K
$463.5K – $617.9K
NOI $37,076 @ 7.0% cap · market cap 5.49%
Theoretical Best
Office A
$1.01M
$879.9K – $1.17M
NOI $70,393 @ 7.0% cap · market cap 10.43%
Zoning and permitted uses should be independently verified with authorities.
How Realmo checks its estimates
Property Analytics
Unlock full access to Insights
Subscribe to Realmo Intelligence
Open Analytics
Current Use
Lease Details
2
Residential units
Yes
Paved road access
Location Intelligence
Trade Area within ½ mile
641
Businesses Nearby
Explore this area
Business Placement
Demographics for 46220, IN
36,078
Population
17,524
Households
2.1
Avg Household Size
37
Median Age
67%
College-Educated
98%
High-School Grad
11.7 sq mi
ZIP Area
3,084
Density / Sq Mi
$103,735
Median Household Income
$58,867
Median Earnings
$1,330
Median Rent
$329,700
Median Home Value
Check the figures for this property
Cap Rate, Value Estimation, Potential NOI and more
View Realmo Analytics
Market
Vacancy Rate% for Multifamily in Midwest region




Frequently Asked Questions
What type of property is this?
Duplex - Two spacious units offer finished lower levels, private fenced yards, screened porches, and central air conditioning.
Where is this duplex located?
The property is located at 539 E 53rd Street Indianapolis, IN.
What is the asking price?
The asking price for this property is $675,000.
What are key features of this property?
This property features: Approximately 4,040 finished square feet on a 8,590 sq ft corner lot; Two units: one with 5 bedrooms and 2.5 bathrooms; one with 4 bedrooms and 2 bathrooms; 26 years of continuous rental history


